Final Project: Design of an Electric Vehicle
Create a MATLAB model of electric car which uses lithium ion battery and induction motor. Choose suitable blocks from Powertrain block set. Prepare a report about your model including following:
Objectives:
1. System level configurations
2. Model parameters
3. Results
4. Conclusion
Ans:
Historical background of electric car
An electric car is a car which is propelled by one or more electric motors using energy stored in rechargeable batteries.
The first electric vehicle was produced by Thomas Parker in 1884, 25 years after the invention of lead-acid batteries. After that date, many electric vehicle models appeared. However, the development of internal combustion engine technology and the reduction in mass production costs have left electric vehicles behind.
The energy crisis that lived between 1970 and 1980brought electric vehicles back to the forefront. But they couldnot reach the high speeds and long ranges of conventional vehicles. For this reason, sufficient technological development could not be achieved.
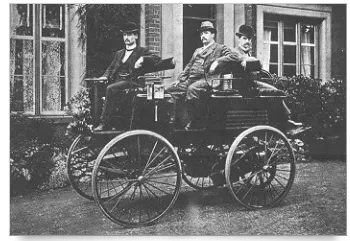
First crude electric vehicle
Further the global economic recession of late 2000s called to abandon the fuel inefficient SUVs, in favor of small cars, hybrid cars and electric cars.
Until today, many companies have produced electric vehicles. However, the range of these vehicles is short and they cannot reach high speeds. With the development of electric motor and battery technology, longer distance vehicles have begun to be produced. The time it takes to charge the batteryis very high, despite the extended range of ranges. For thisreason, electric vehicles are still not at the desired level.
T. HOFMAN and C.H.DAI, the effect of different gearboxes on energy consumption has been investigated. Thepowertrain system has been investigated using fixed gearsystem, manual gearbox and CVT gearbox .
A. Kerem, as electric vehicle technology in the world develops, interest in electric vehicles will increase. This shows that environmental pollution will decrease and dependenceon petrol will decrease .
O. Vatan, modeling of an electric vehicle withMATLAB/Simulink. The model has a 30 kWh battery. This vehicle in the city consumes 0.58 kWh/100km and 0.44 kWh/100km outside the city. The vehicle has a max range of 52-70 kilometers.
E. Schaltz, designed and modeled an electric vehicle. This vehicle consumes 148.3 Wh/km of energy. Also explains that a large part of the energy loss is caused by the auxiliary loads, the lighting system, the security systems, the comfort systems and the battery.
Electric car by Seimens, 1904 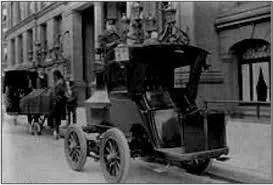
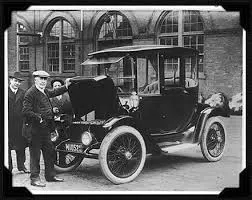 Thomas Edison , 1907-1939
Tribelhorn, 1902 - 1919 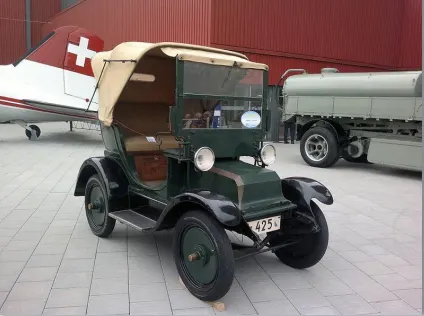
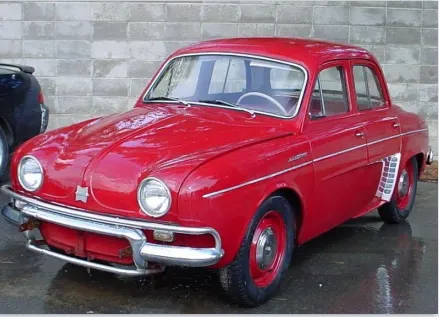 The Henny Kilowatt, 1961
Vanguard Sebring Citicar, 1974 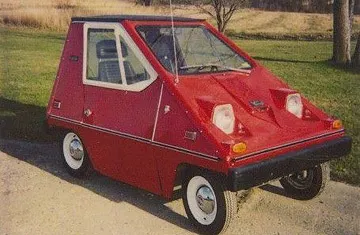
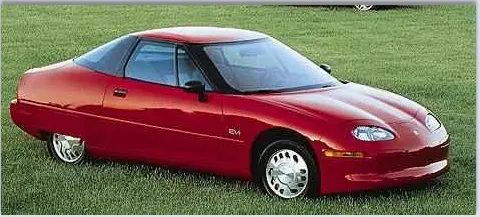 Saturn EV -1, General Motors,1996
Chevrolet Volt, 2007 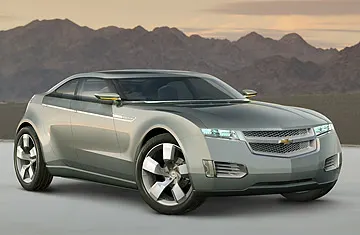
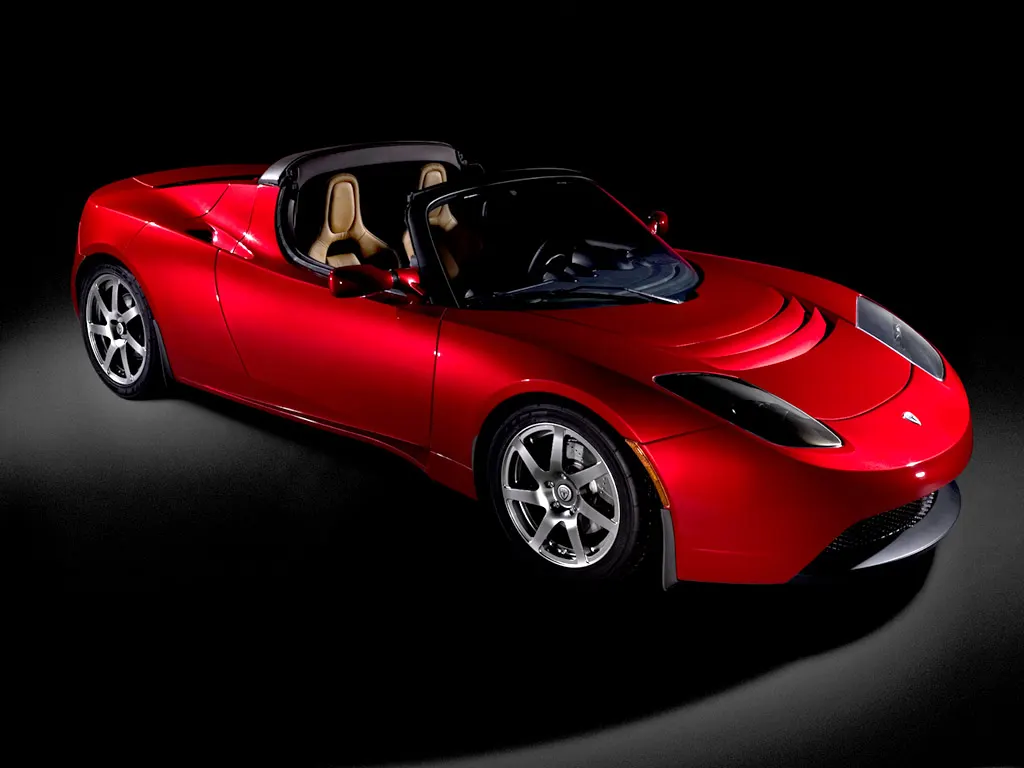 Tesla Roadster 2008
Key components of electric vehicle:
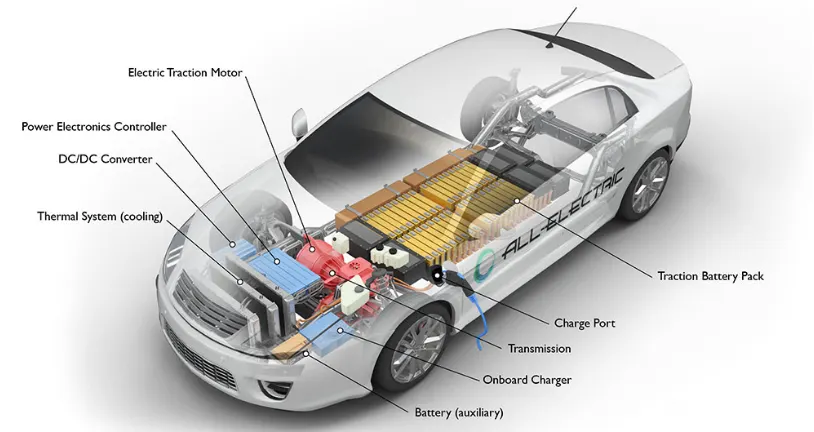
Basic principle of electric car
- An Electric car is powered by an Electric Motor rather than a Gasoline Engine.
- The Electric Motor gets its power from a controller.
- The Controller is powered from an array of rechargeable batteries.
System level configurations
The majar blocks used to design the EV vehicle using matlab simlink are:
- drive cycle
- driver
- controlled PWM voltage
- H-bridge
- battery source
- dc motor
- vehicle and others.
MATLAB model of Electric car
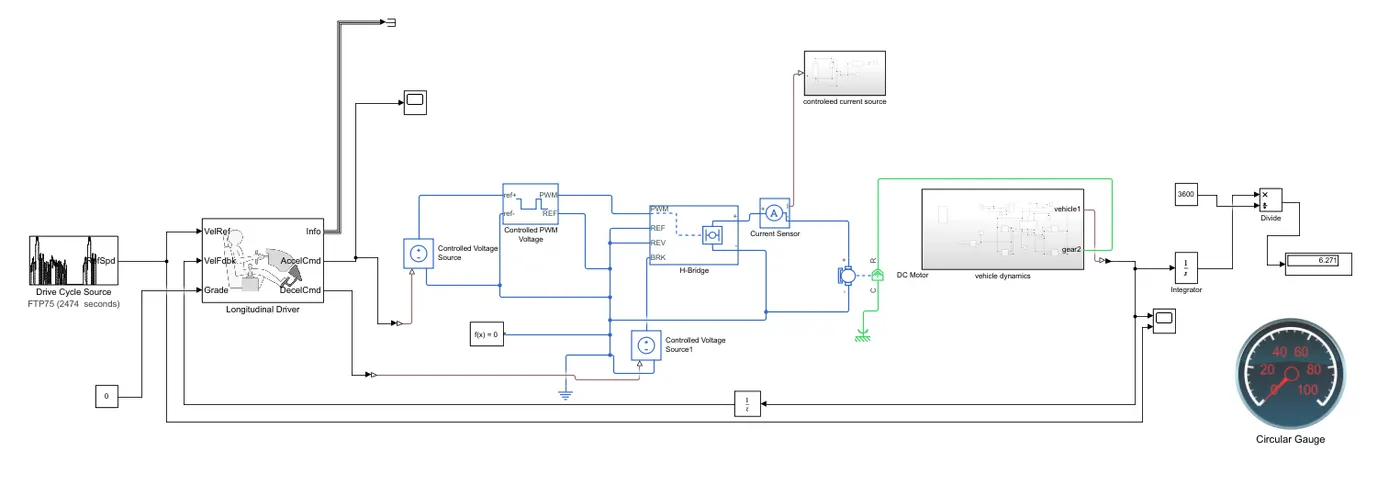
1. Drive cycle
Starting with the drive cycle I have used FTP75 for the operation of the cycle where the stop time is 2474seconds.
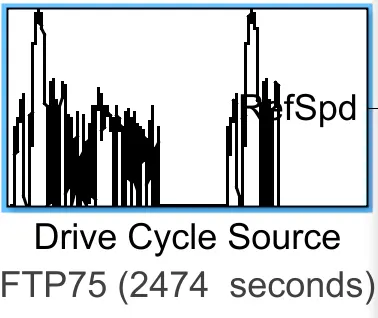
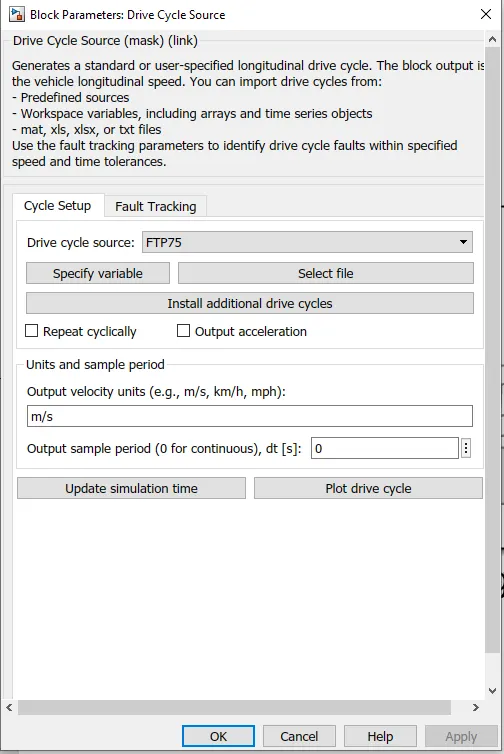
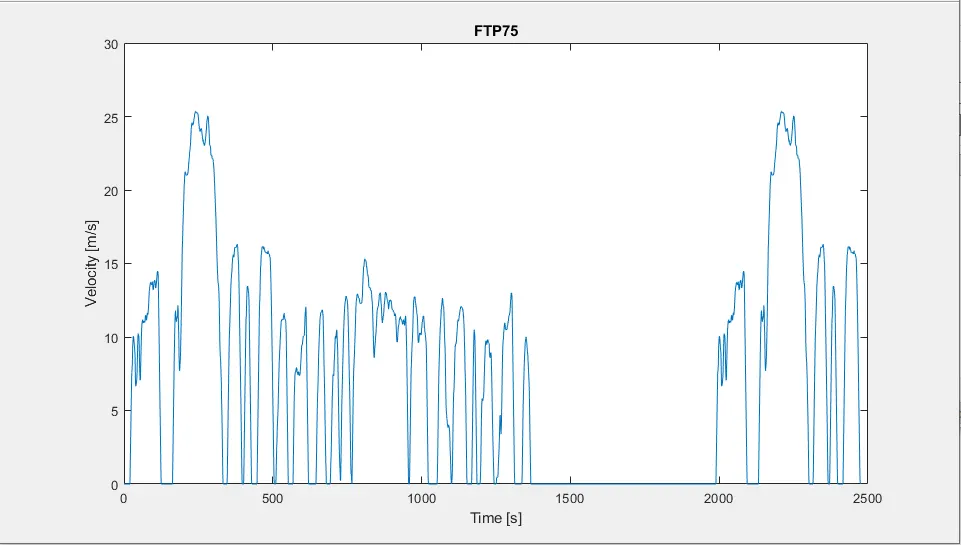
The above snap is the FTP75 drive cycle with the max velocity of 26m/s.
Then the drive cycle is connected to Vehicle reference of Longitudinal drive block.
2.Longitudinal driver
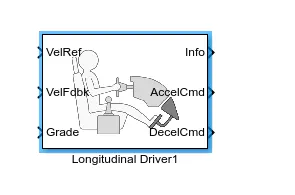
The Longitudinal Driver block implements a longitudinal speed-tracking controller. Based on reference and feedback velocities, the block generates normalized acceleration and braking commands . we can use the block to model the dynamic response of a driver or to generate the commands necessary to track a longitudinal drive cycle.
It consists of six ports they are:
VelREf = vehicle reference
VelFdbk = vehicle feedback
Grade= gradability
info= information which is terminated here.
AccelCmd = acceleration command
DecelCmd = decceleration command
Here speed is taken as feedback through a Smulink PS converter from Vehicle subsyntem and given gradeability for speed calculation integrator blook and a constant is connected with Divide blocks positive and negative terminal respectively. Acceleration command is given to Control Voltage sourcel through a simulink PS Converter.
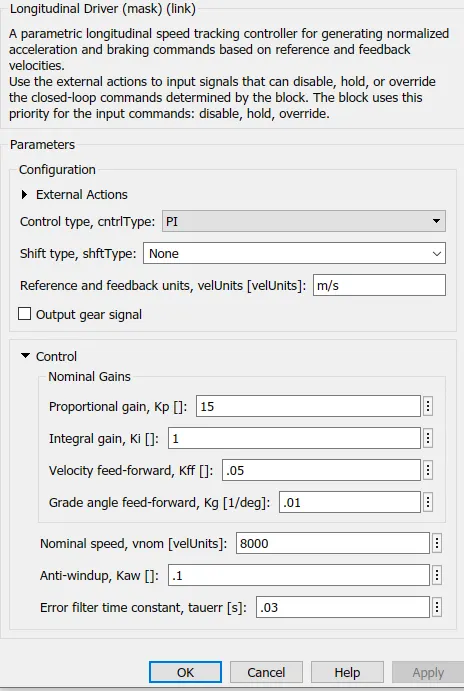
Parameter considered:
3.Controlled PMW voltage:
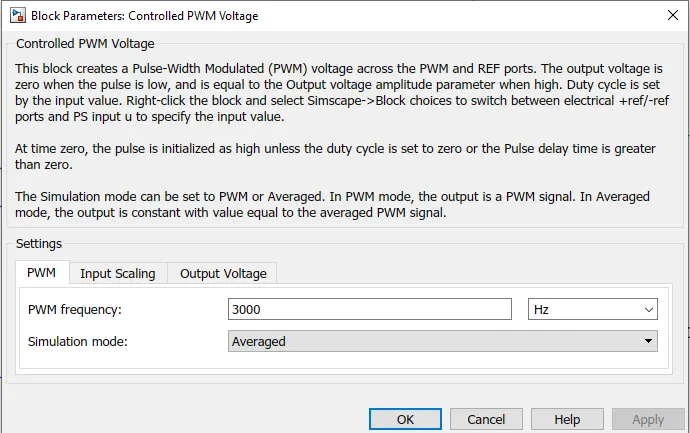
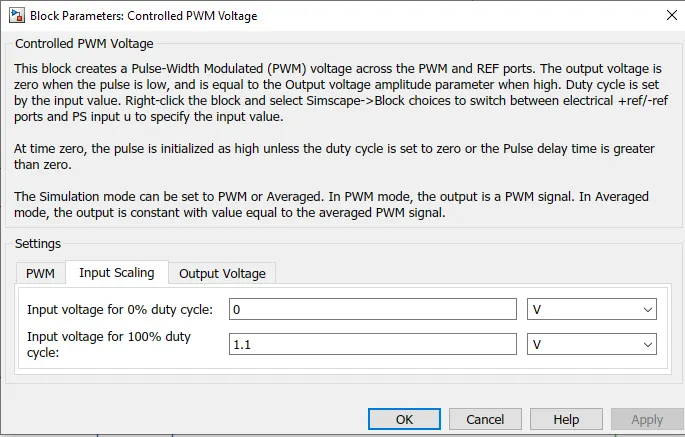
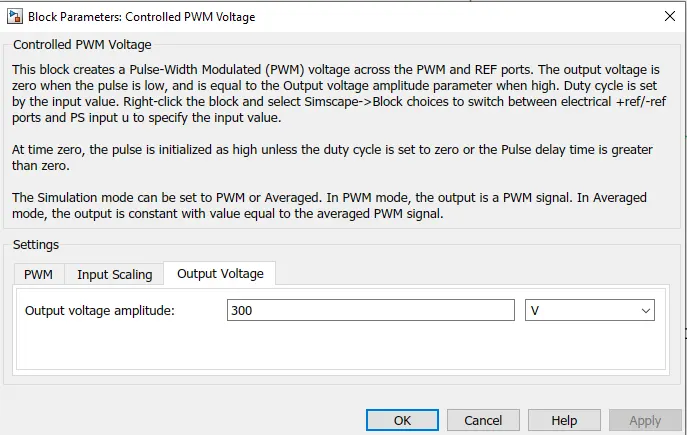
The value of the Output voltage amplitude parameter determines amplitude of the output voltage.
The Controlled PWM Voltage block represents a pulse-width modulated (PWM) voltage source.
-
Electrical input ports — The block calculates the duty cycle based on the reference voltage across its ref+ and ref- ports. This modeling variant is the default.
-
PS input — Specify the duty cycle value directly by using an input physical signal port.
where
-
Vref is the reference voltage across the ref+ and ref- ports.
-
Vmin is the minimum reference voltage.
-
Vmax is the maximum reference voltage
parameters considered:
4. H-bridge
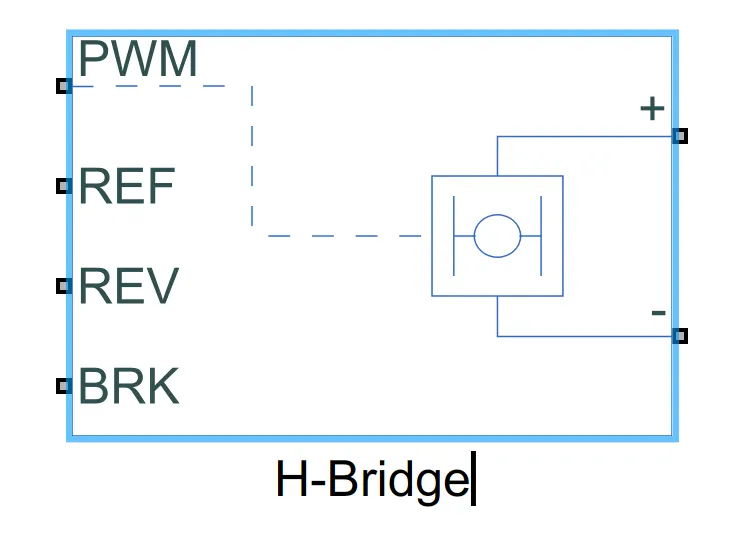
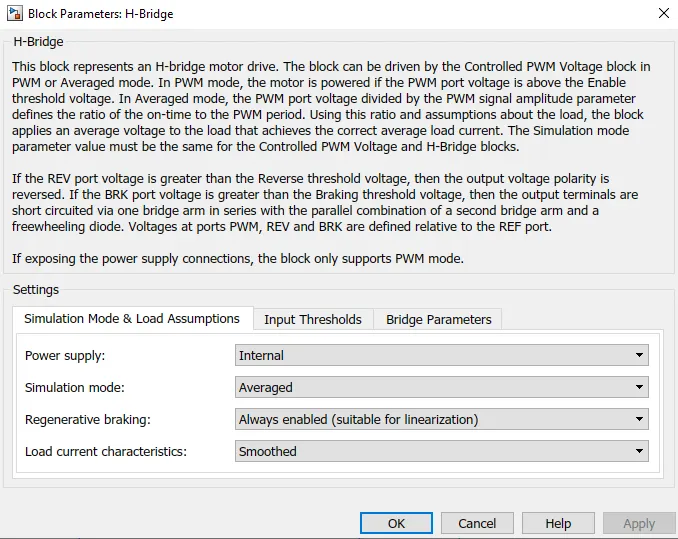
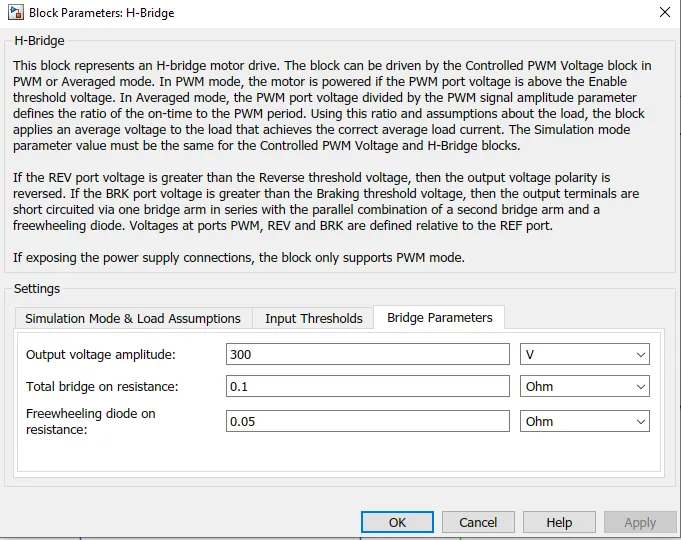
This block represents an H-bridge motor drive. The block can be driven by the Controlled PWM Voltage block in PWM or Averaged mode. In PWM mode, the motor is powered if the PWM port voltage is above the Enable threshold voltage. In Averaged mode, the PWM port voltage divided by the PWM signal amplitude parameter defines the ratio of the on-time to the PWM period. Using this ratio and assumptions about the load, the block applies an average voltage to the load that achieves the correct average load current. The Simulation mode parameter value must be the same for the Controlled PWM Voltage and H-Bridge blocks.
Reverse of H-Bridge and both Reference output ot Control PWM voltage and H-bridge is grounded. A solver configuration is connected to the ground reference. Reference output of Control PWM voltage and HBridge is connected.
Two output port of HBridge is connected to a DC motors. Also the positive output of bridge is connected to a controlled courent source through a current sensor.
parameter considered:
5. Battery source
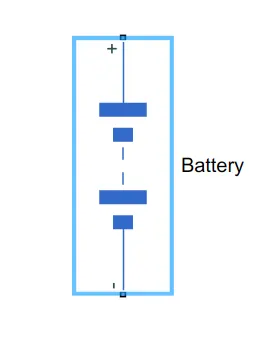
The battery is connected to the H-bridge through the current sensor where the battery is the main power source of the model.
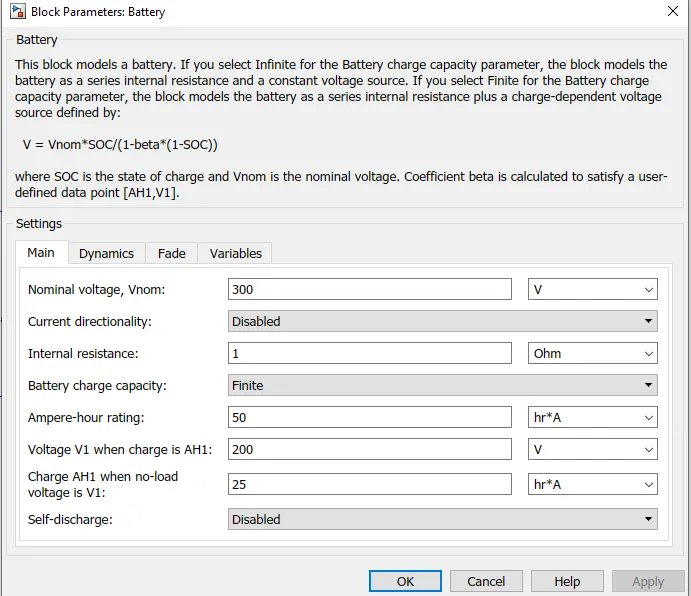
The below model is the complete battery blocks and connections which includes SOC , controlled current sourceand PS simulnk
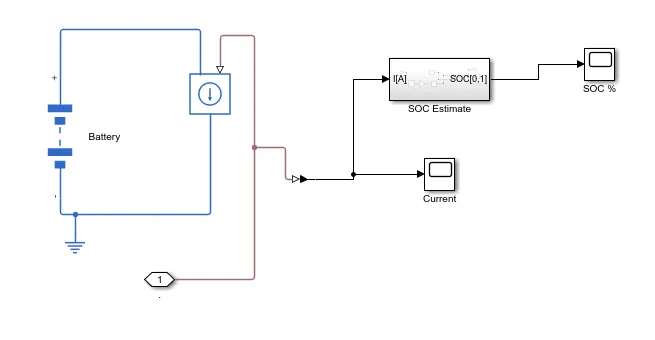
SOC estimate block
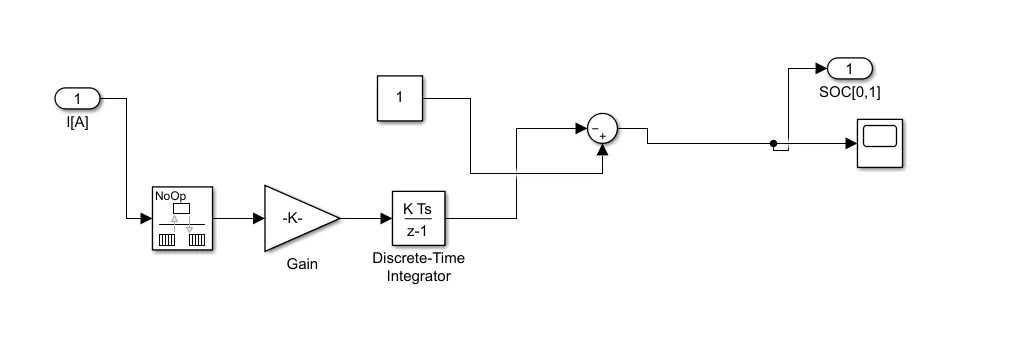
The above subsystem is the SOS estimate block where the rate transition, gain, and discrete time integrator , are connected in series after that this series is added with constant block.This arrangement gives us the SOC
Parameters considered
6.DC motor
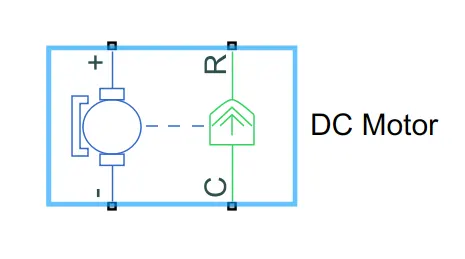
This block represents the electrical and torque characteristics of a DC motor.
When a positive current flows from the electrical + to - ports, a positive torque acts from the mechanical C to R ports. Motor torque direction can be changed by altering the sign of the back-emf or torque constants.
Here the + and - terminals of the dc motor the + and - of the H-bridge respectively.
The mechanical C port is connected to the mechanical rotational reference and R port is connected to the simple gear of the vehicle dynamics block.
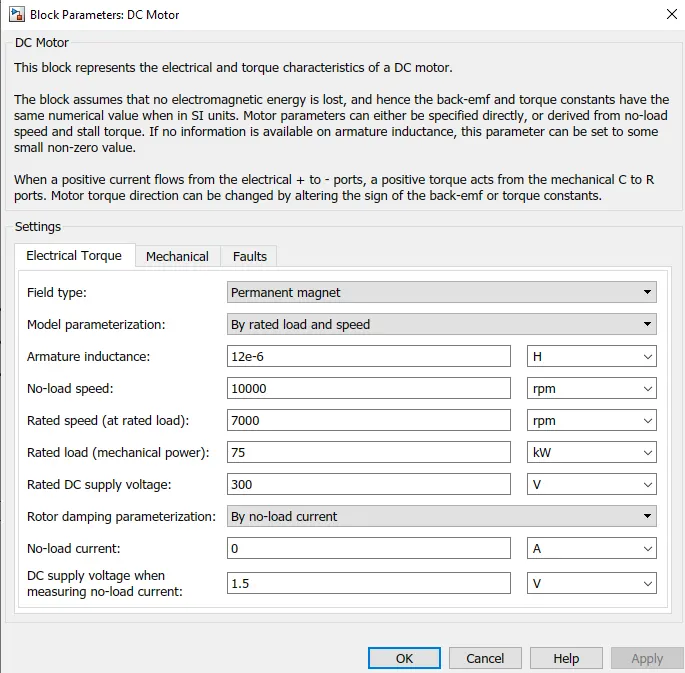
Parameters considered:
7. Vehicle dynamics
Vehicle dynamic block is a subsystem block which includes vehicle body, gear, terrain, wind, tires, inertia, ideal translational motion sensor and PS converter. The connections of the blocks are shown in the below snap.
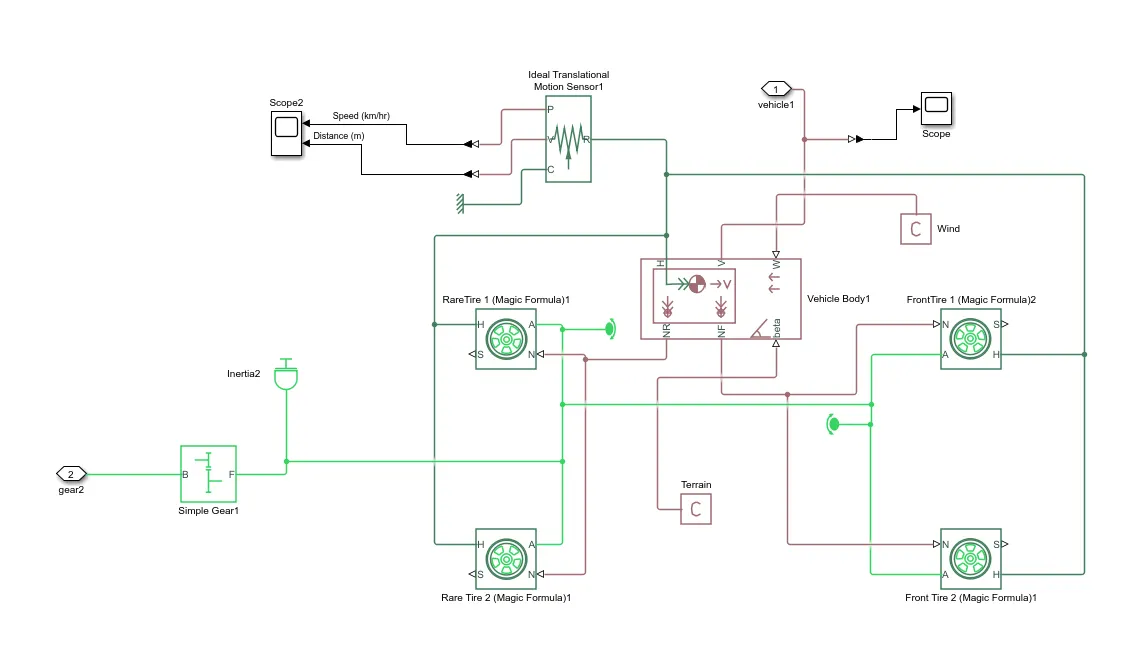
TIRE:
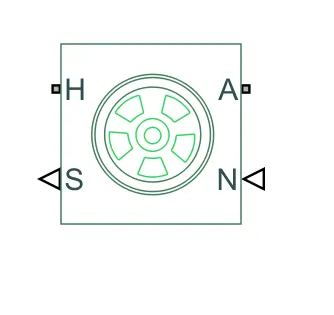
The above block is Tire with longitudinal behavior given by Magic Formula coefficients.
where H= Hub(Mechanical translational port associated with the wheel hub that transmits the thrust generated by the tire to the remainder of the vehicle).
S= slip (Physical signal output port associated with the relative slip between the tire and road).
a=axle (Mechanical rotational port associated with the axle that the tire sits on).
N=normal force (Physical signal input port associated with the normal force acting on the tire. The normal force is positive if it acts downward on the tire, pressing it against the pavement).
The parameters of the tire is taken as same as default value.
Vehicle body:
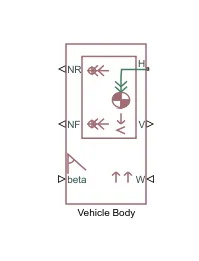
The Vehicle Body block represents a two-axle vehicle body in longitudinal motion. The vehicle can have the same or a different number of wheels on each axle. For example, two wheels on the front axle and one wheel on the rear axle. The vehicle wheels are assumed identical in size. The vehicle can also have a center of gravity (CG) that is at or below the plane of travel.
where;
`NR`=rear axle normal force (Physical signal output port for normal force on the rear axle. Wheel forces are considered positive if acting downwards.)
`NF`=front axle normal force (Physical signal output port for normal force on the front axle. Wheel forces are considered positive if acting downwards.)
beta= road incline angle (Physical signal input port for road incline angle.)
`W`= wind (Physical signal input port for headwind speed.)
`H`= horizontal motion (Conserving port associated with the horizontal motion of the vehicle body. Connect tire traction motion to this port.)
`V`=longitudinal velocity ( Physical signal output port for vehicle longitudinal velocity).
Parameters considered:
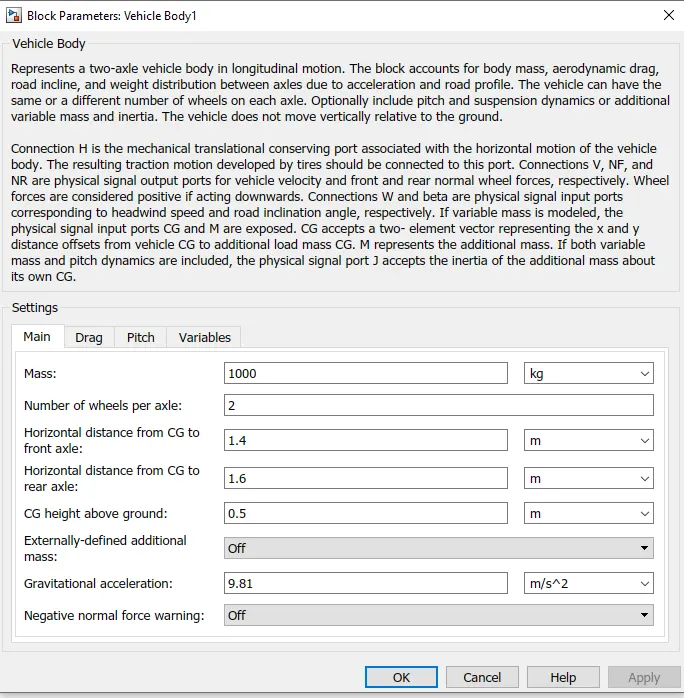
The connections are shown in the above snap of the vehicle body.
Parameters of the other blocks are taken as same as the defauilt values.
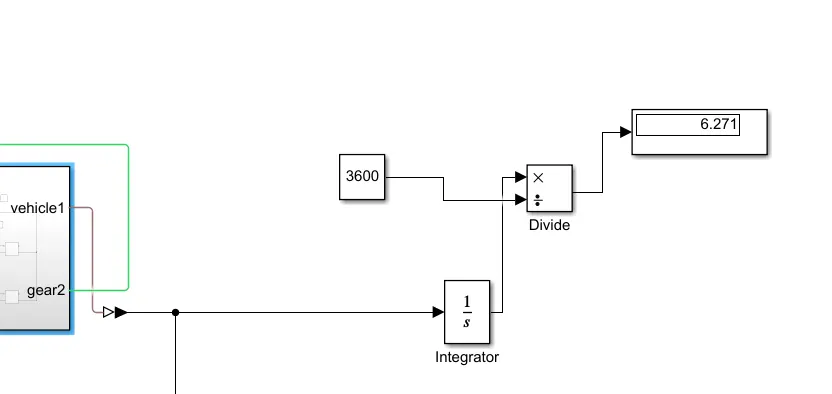
Lastly, the signal from the velocity port of the subsystem is connected to the scope through the PS converter and for the calculation of distance travelled by the vehicle , velocity port of the subsystem is taken to the integrator block and then it connects divide block as shown in the above snap.
RESULTS:
- SOC estimation graph:
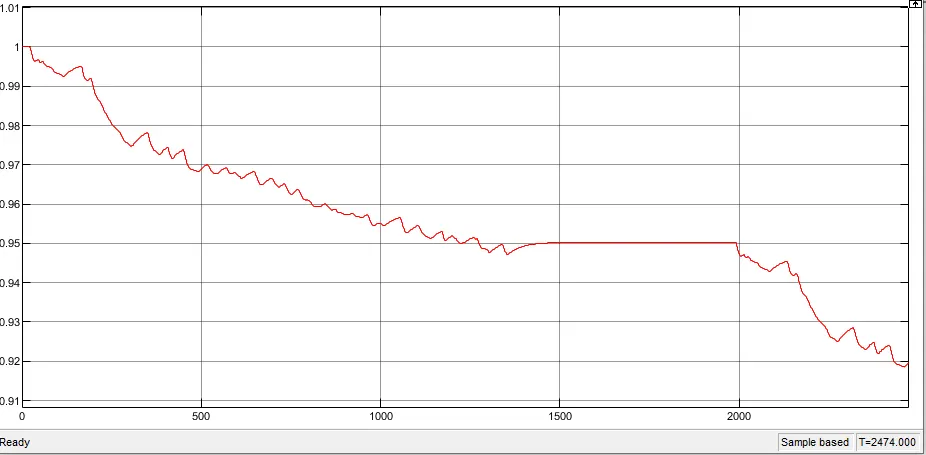
The above graph is the state of charge of the battery .In the graph we can observe some constant, ups and dips regions.
where Dips regions is due to the acceleration of the vehicle which results in discharging of the battery.
Constant value regions is due to the regeneartive braking of the vehicle or vehicle is in deaccelearation mode
and ups region due to the recharging of the battery.
Battery capacity is 100% at intial and to complete the given the drive cycle it discharged by 8%.
- Current scope:
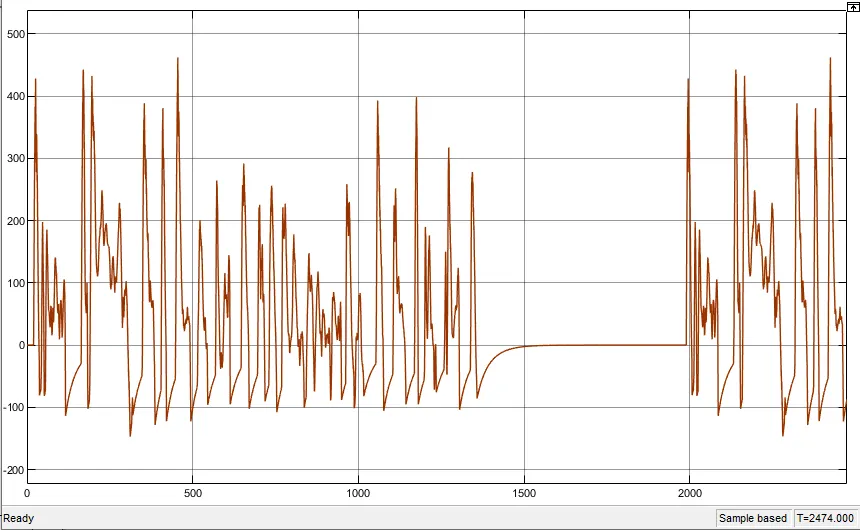
Here it shows how the current flow varying from the battery to the motor for the given FTP75 drive cycle.
Upward spikes due to the acceleartion of the vehicle that means more current is required for motor to accelerate the vehicle
downward spikes due to the deacceleartion of the vehicle that means less current is required for motor to deaccelerate the vehicle
- Vehicle feedback and drive cycle source scope:
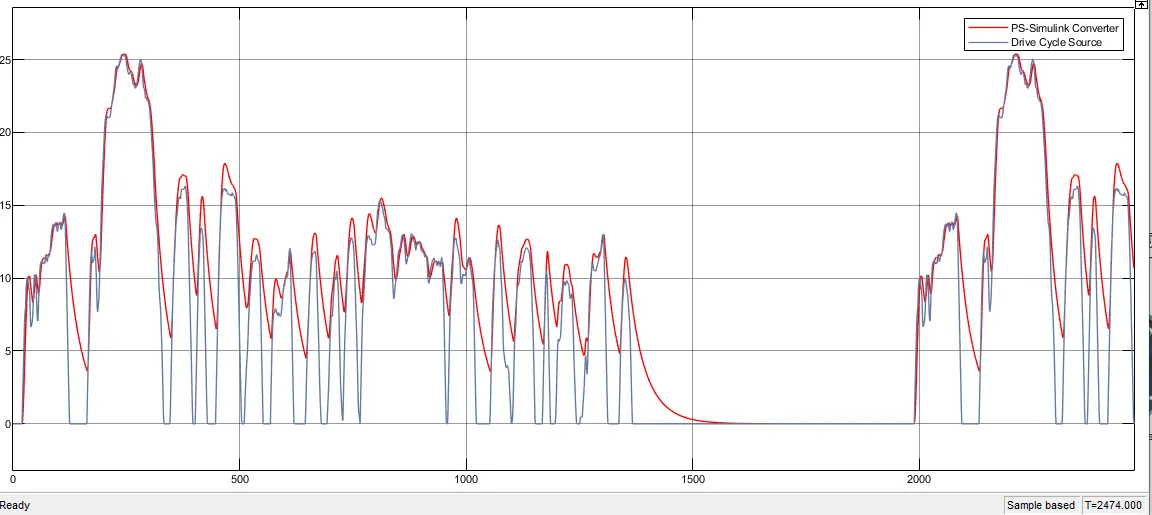
Here we can observe that the two lines overlapping to each other where Red line is speed as per vehicle feedback source and another one is as per the drive cycle source which means the vehicle speed tracks the reference speed.
The maximum speed of the vehicle attained is 26m/s.
Conclusion:
The model has been made and simulation has been run. Here we can observe that the model is dependend on many factors like drive cycle, nominal speed, output voltage amplitude , armature inductance, rated speed speed, battery modelling, rated power etc, . hence, we can conclude that if any one of the factor is not altered in a systematic way the model wont tracks the given reference speed.