Week-4 Challenge WOT Condition Part-2
-
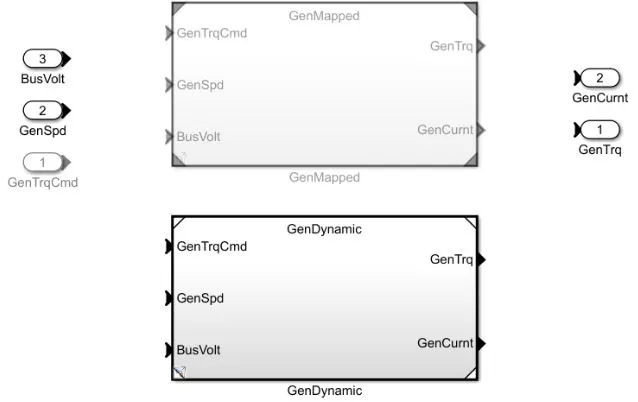
If you have engine data from a dynamometer or a design tool like GT-POWER.
-
For quasi steady-state engine simulations.
-
If you need a more detailed dynamic model and have component-level data.
-
To analyze the impact of individual engine components on the overall performance.
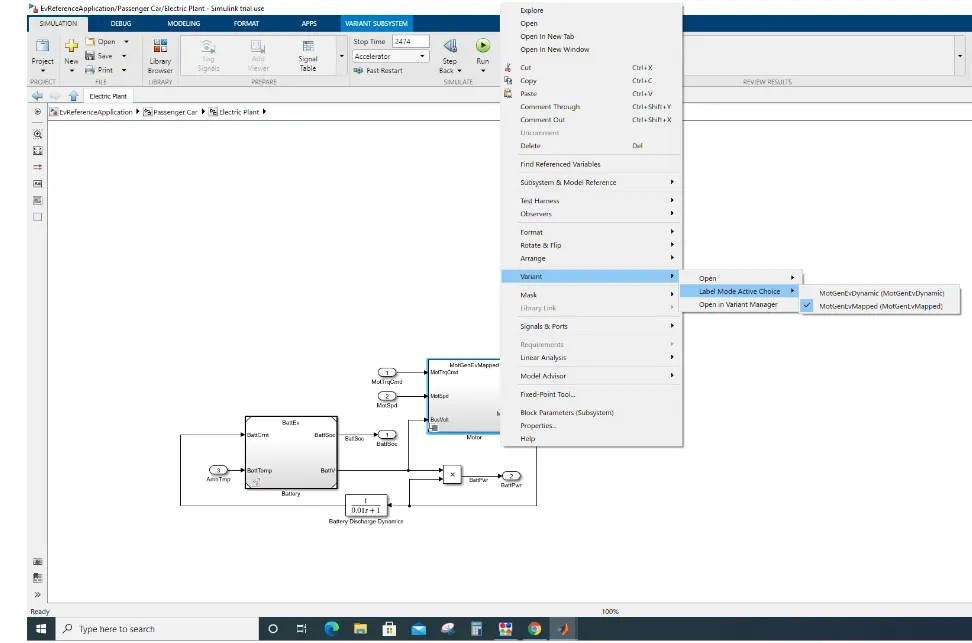
MPG, or miles per gallon, is the distance, measured in miles, that a car can travel per gallon of fuel. MPG is also the primary measurement of a car's fuel efficiency: The higher a car's MPG, the more fuel efficient it is.
The U.S. Environmental Protection Agency, or the EPA, is the government agency responsible for certifying a vehicle's MPG figures, notes
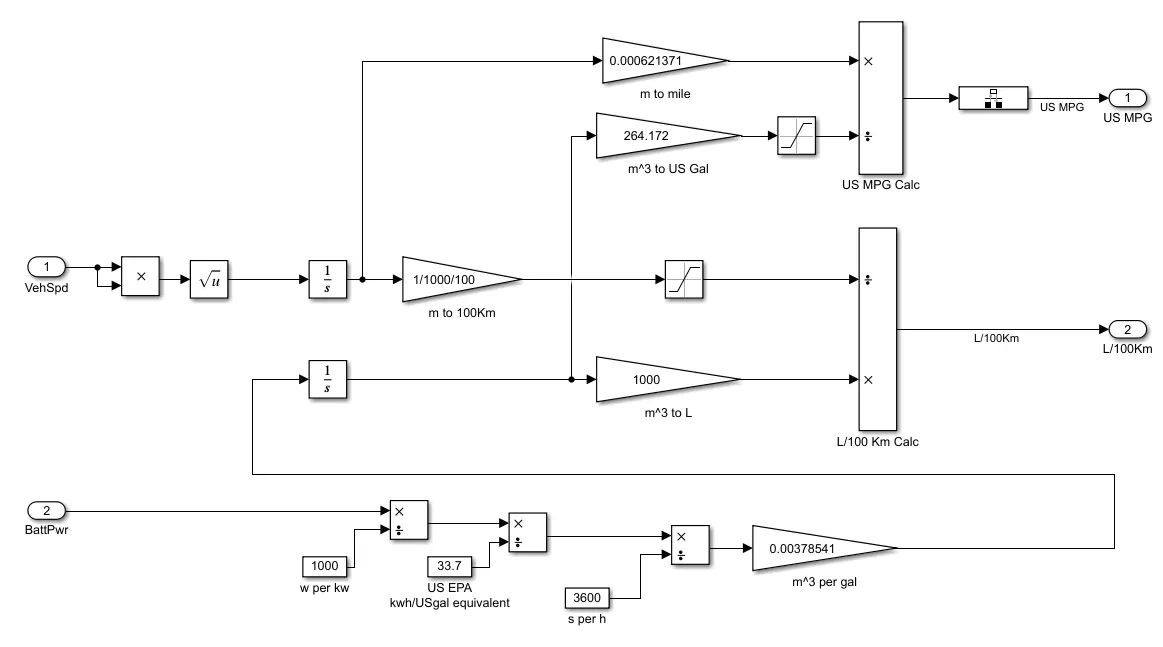
factors are considered to model fuel flow are
- Vehicle speed
- fuel flow
- Battery power
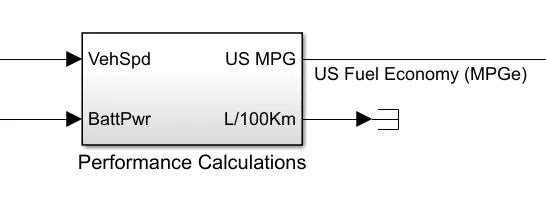
The below block is inside the visualiztion of the Ev reference model.
The below model shows the calculations in blocks for MPG
...................................................................................................................................................................................................................
3.Run the HEV ReferenceApplication with WOT drive cycle. Change the grade and wind velocity in the environment block. Comment on the results.
ANS:
Below model is the HEV powertrain block reference application with WOT drive cycle.
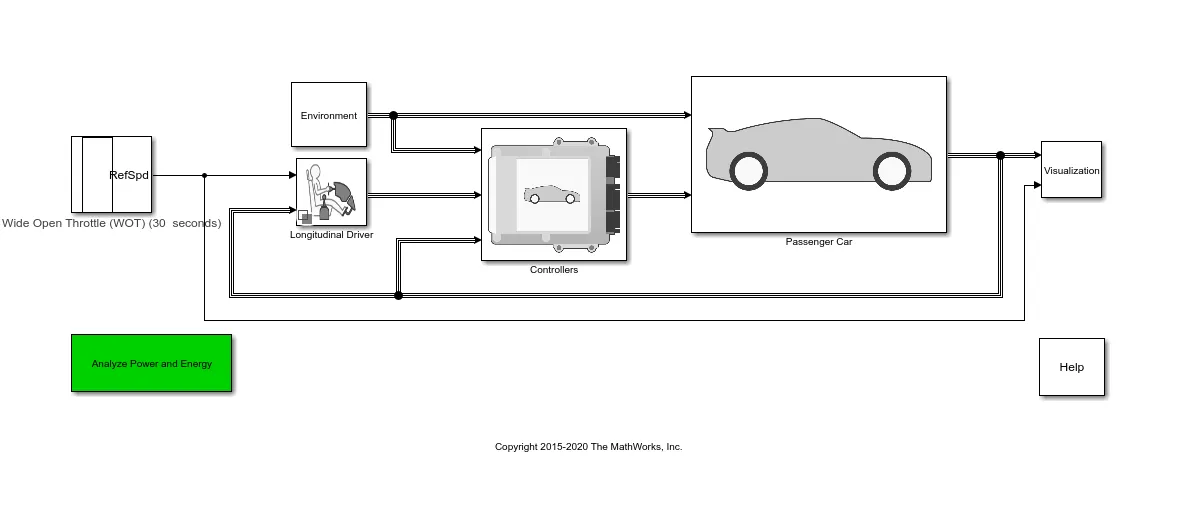
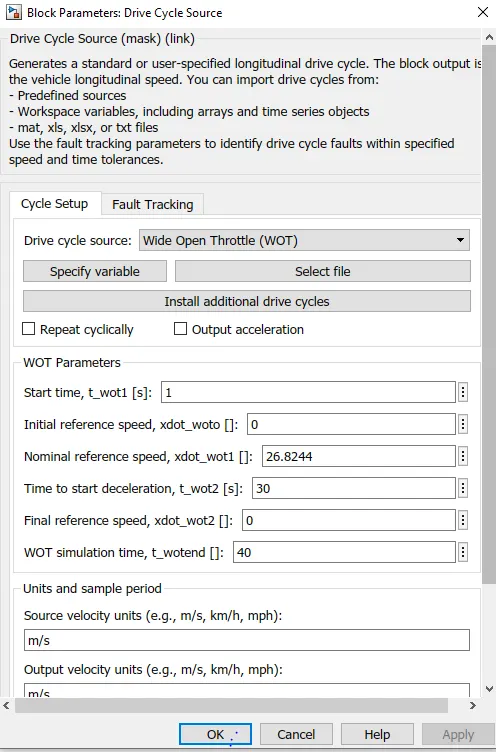
Change the drive cycle drive to WOT drive cycle And give the following values.
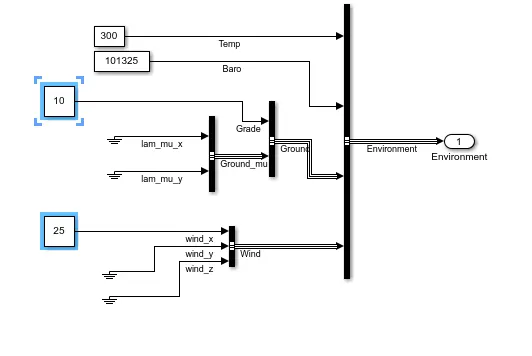
Change the grade and wind to 10 and 25 respectively in the environment block.
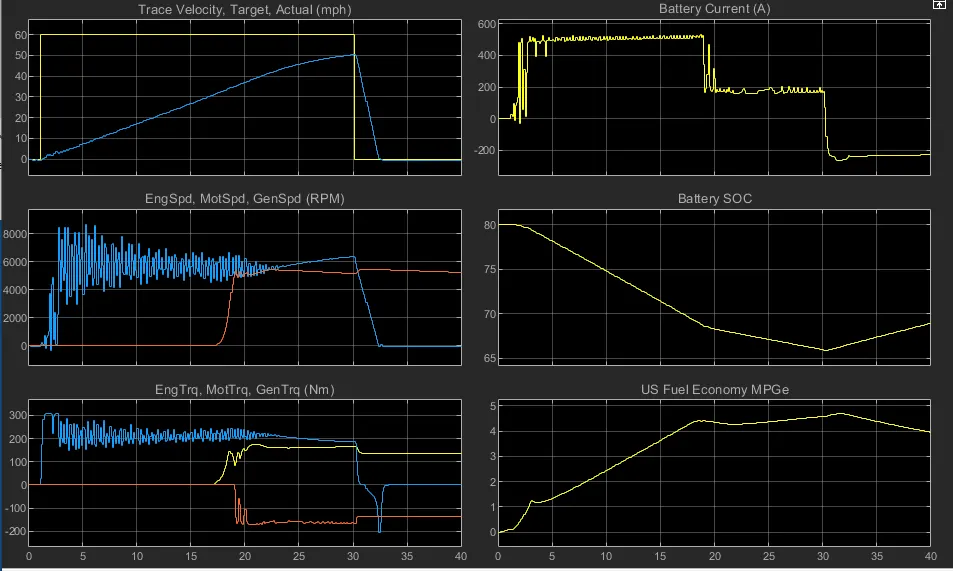
Result:
Conclusion:
plot 1:trace velocity, target, actual:
top velocity achieved =50.4 mph.
time taken to accelerate = 28.9s.
time taken to deaccelerate = 2.471s.
plot 2: motor & engine rpm:
top motor rpm=5712 rpm.
top engine rpm = 5451 rpm.
plot 3:motor & engine torque:
maximum motor torque = 306.6 N-m.
maximum engine torque = 174.7 N-m.
plot 4:battery current:
The battery supply current is at its maximum value of 521 ampere
plot 5:battery soc:
the battery soc will falls from 80 to 65 % during accelaration of vehicle and it increases slightly to 65 to 70 % during de accelaration due to regenerative braking.
plot 6:fuel economy:
maximum fuel economy achieved = 4.675MPG
................................................................................................................................................................................................................
4. Keeping all other parameters same, compare the simulated results of hybrid and pure electric powertrains.
Hybrid powertrain result
Pure electric power train result:
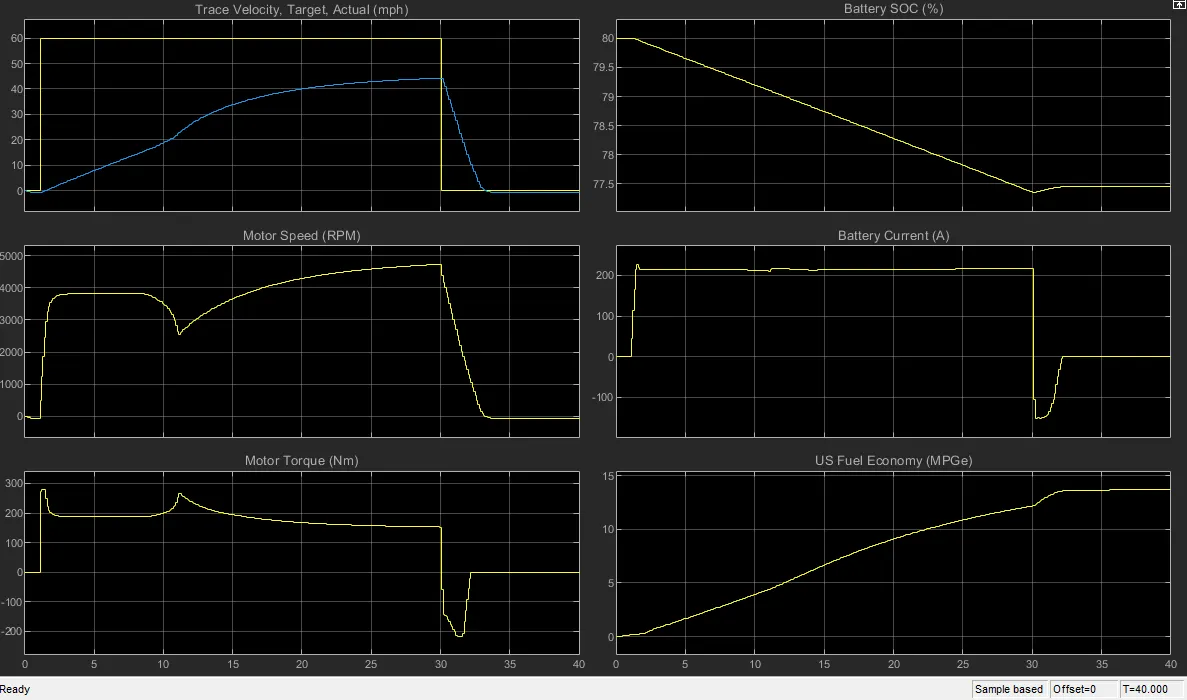
Conclusion:
The top speed achieved by hybrid vehicle is more than EV
The battery current capacity of EV is much higher than HEV
Higher fuel economy is achieved in case of pure EV.