Assignment 6-Frontal Crash Simulation Challenge
Aim:
- To set up the given simulation conditions on the BIW model for frontal crash simulation in HyperMesh/RADIOSS and discuss the results obtained.
Procedure:
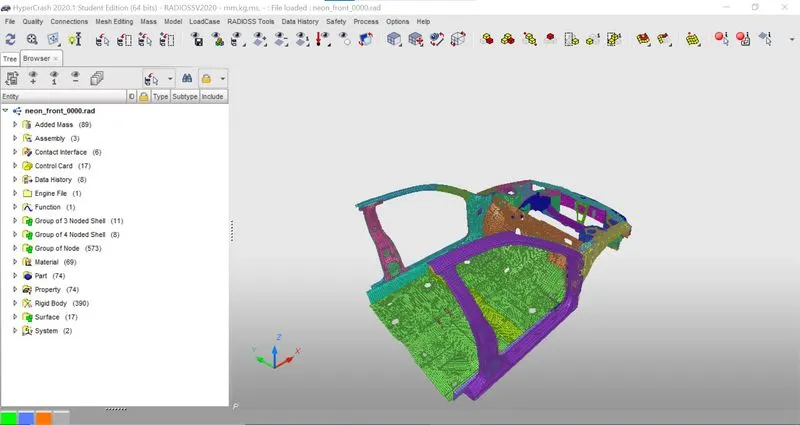
- The model is imported using the import option in the hypercrash.
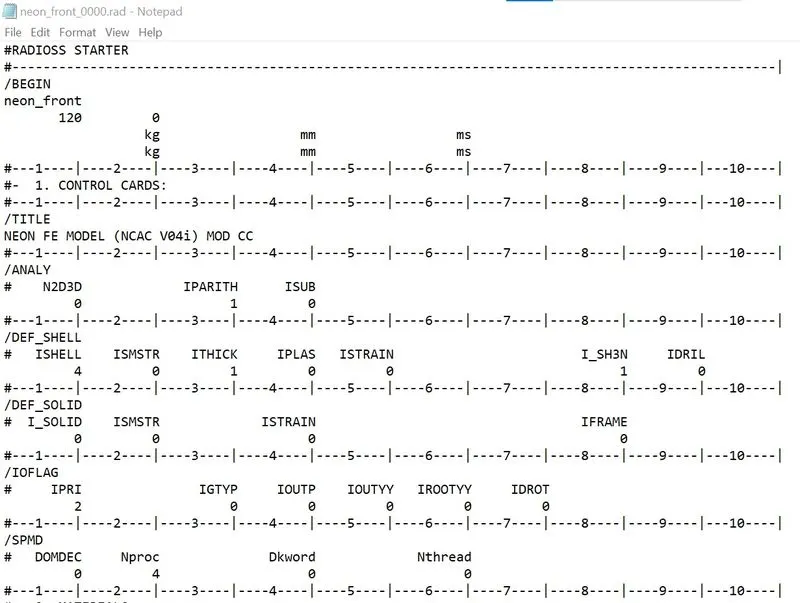
- The unit system is checked in the rad file and it is found to be kg mm ms.
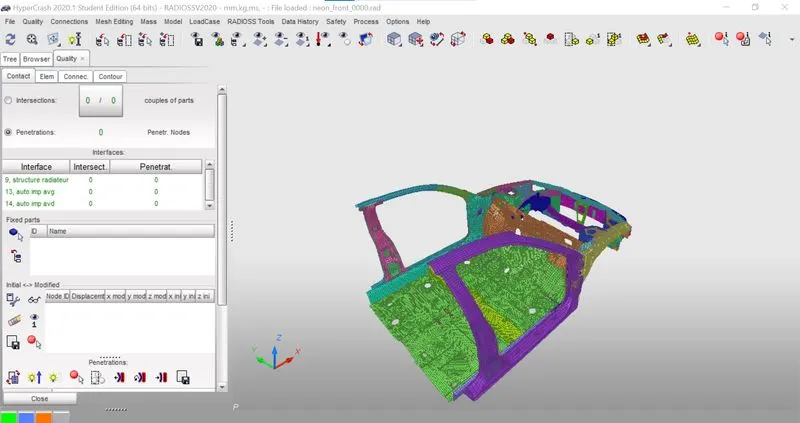
- Initially, the penetrations are check using the check all solver contact interfaces option.
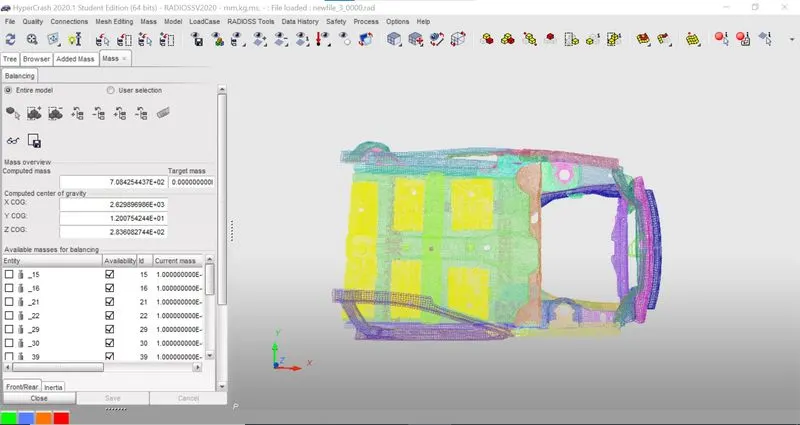
- Using added mass option in the hypercrash additional mass is added for the passenger, driver and trunk portion of the car and the total mass of about 700kg is achieved and the COG point is placed properly.
- Then the model is exported to the hypermesh using the export option.
- Then the model is imported in the hypermesh using the import option in the hypermesh.
CREATE SELF CONTACT:
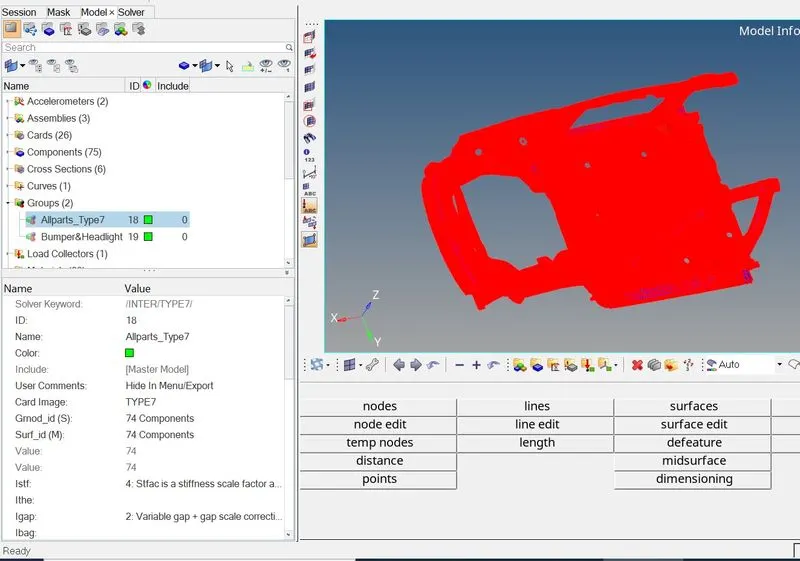
In this case, the Type 7 Contact Interface is defined. Interface TYPE7 is a multi-usage impact interface, modelling contact between a master surface and a group of slave nodes. It is also possible to consider heat transfer and heat friction.
All limitations that were encountered with interfaces TYPE3, TYPE4 and TYPE5 are solved with this interface:
- A node can be at the same time act as a slave and a master node.
- Each slave node can impact each master segment; except if it is connected to this segment.
- A node can impact more than one segment.
- A node can impact on the two sides, on the edges and on the corners of each segment.
- It is a fast search algorithm without limitations.
The main limitations of this interface are:
- Time step is reduced in case of high impact speed or contacts with a small gap.
- It does not work properly if used with a rigid body at high impact speed or a rigid body with a small gap.
It does not solve edge to edge contact (to solve this, /INTER/TYPE11 should be used along with TYPE7).
TYPE 7: NODE TO SURFACE
- Impacts occur between a master surface and a set of slave nodes, similar to the TYPE5 interface.
- A node can impact one or more master segments.
- A node can impact on either side of a master surface.
- Each slave node can impact each master segment except if it is connected to this segment.
- A node can belong to a master surface and a set of slave nodes.
- A node can impact the edge and corners of a master segment. None of the previous interfaces allows this.
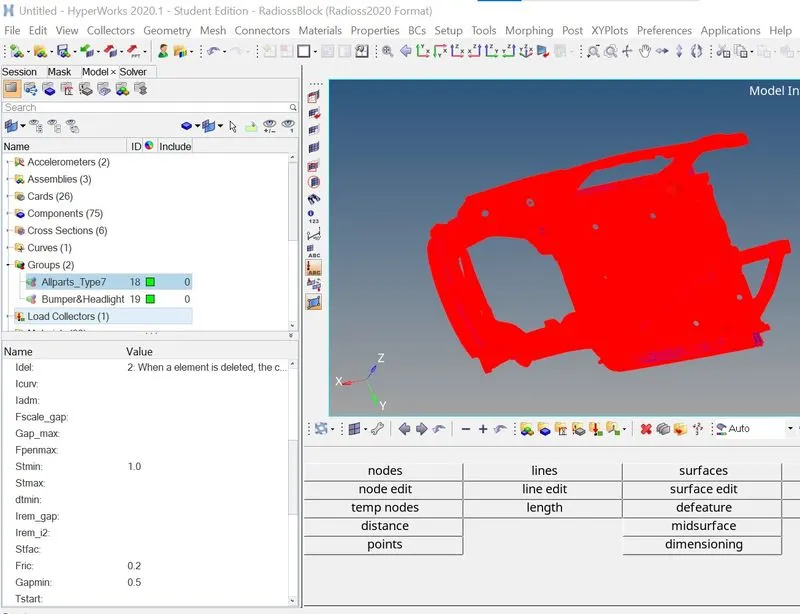
The recommended properties are as following:
1.Igap = 2 (Variable Gap took into account.)
2.Gapmin ≥ 0.5mm (minimum thickness to avoid the numerical issue.)
3.Inacti = 6 (remove initial penetrations wherever possible, else reduce to less than 30% of the defined gap)
4.Istf = 4 (Stiffness based on softer Segment)
5.Stmin = 1 kN/mm (Minimum stiffness in contact to avoid too soft contact.)
6.Idel = 2 (remove slave nodes from contact because of element deletion)
7.Iform = 2 (Frictional Forces are calculated on the basis of Stiffness parameter.)
Delete existing contacts and create new contacts with recommended properties.
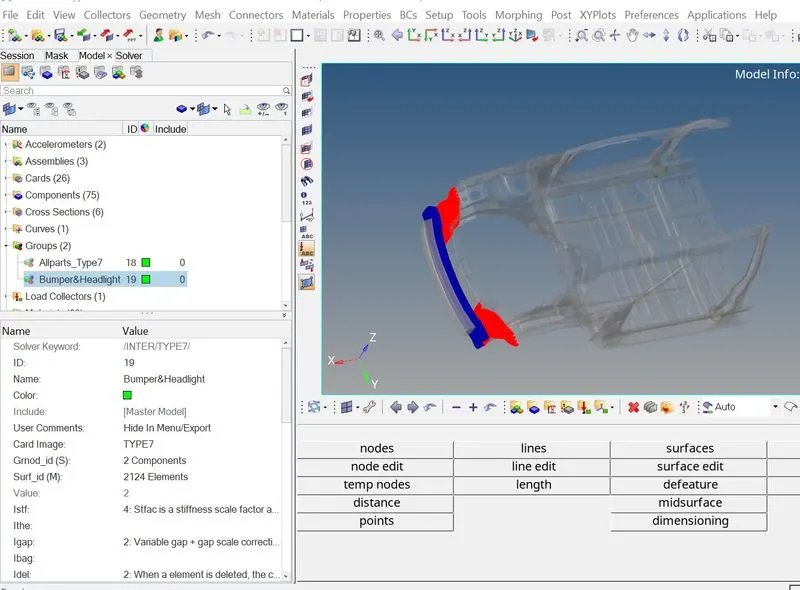
CREATE INTERFACE CONTACT BETWEEN BUMPER AND HEADLIGHT BRACKETS:
- Type-7 Contact is created using the master component as bumper and headlight as slave component.
CREATE RIGID WALL:
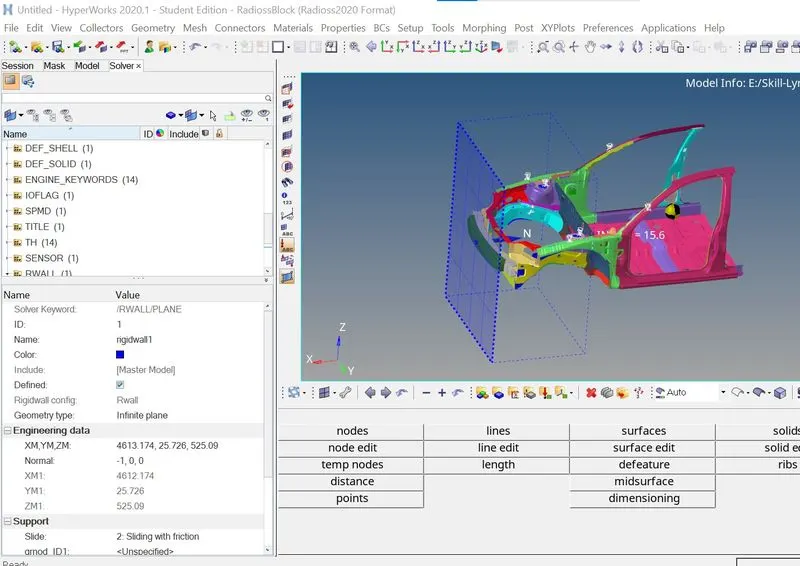
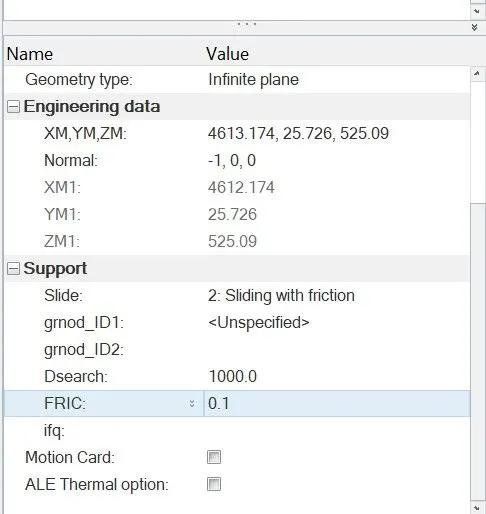
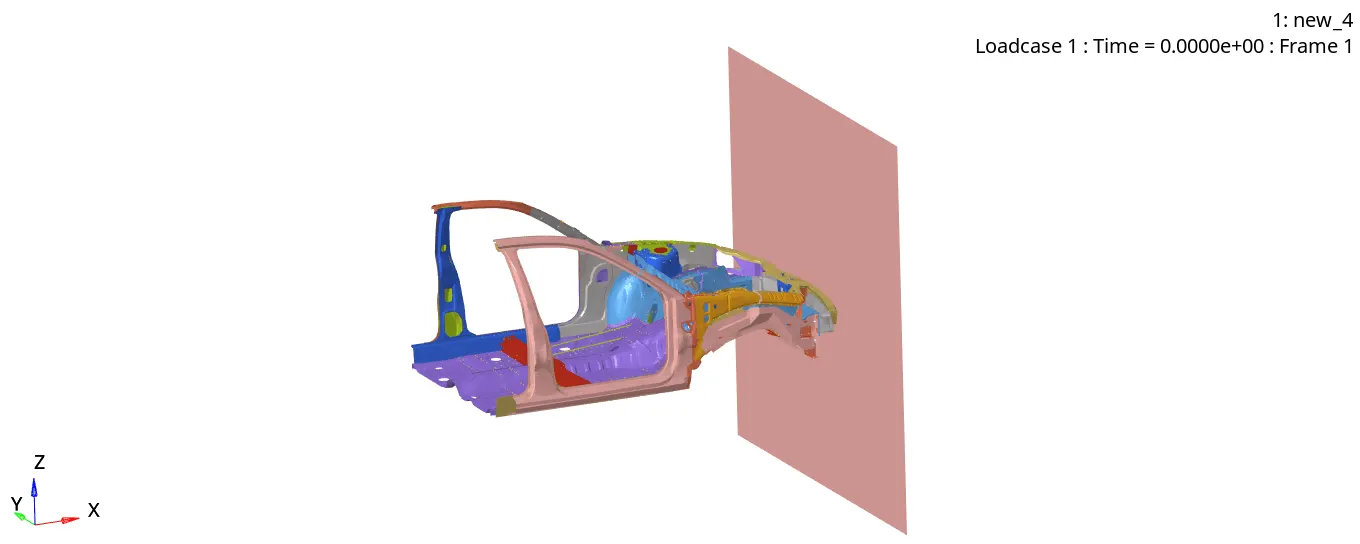
- A rigid wall is a nodal constraint applied to a set of slave nodes in order to avoid the node penetration to the wall. If contact is detected, then the slave node acceleration and velocity are modified. Mainly to constrain the movement of a moving body after impact, we will be using a plane wall. An infinite plane wall is a plane that extends to infinity. It is defined with two points.
- Rigid wall entities provide a method for treating a contact between a rigid surface and nodal points of a deformable body.
- Initially, a node is created and it is translated to some distance and using this node coordinate as a reference, the rigid wall is created.
- The friction value is set as 0.1
- To create an RWALL
- Go to Slover browser >> Create >> Rwall >> Plane .
CREATE VELOCITY:
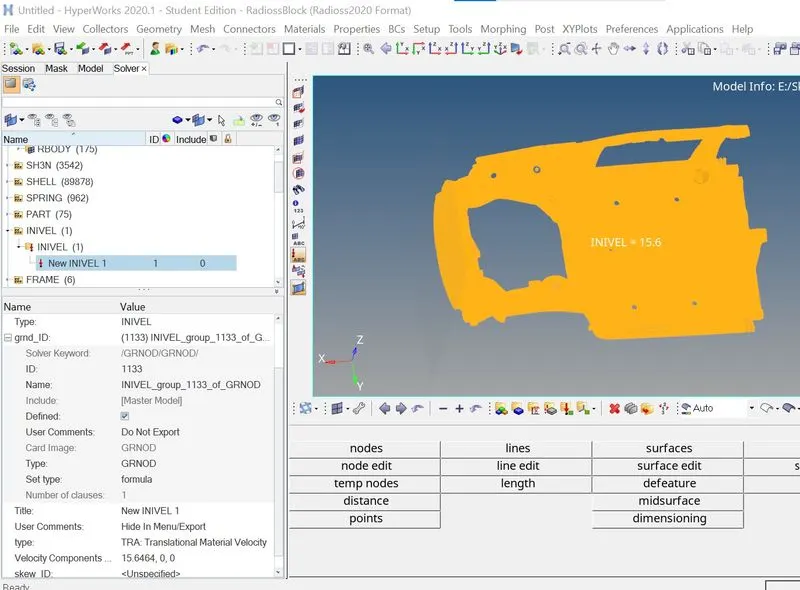
- Initial velocity 35 mph.
- Converting 35mph into ms
- 1mph = 0.447 ms
- So, 35mph = 15.6464 ms
- To create a velocity
- Go to solver browser >> Create >> Boundry conditions (BC) >> Inivel
CREATE SECTIONAL FORCES:
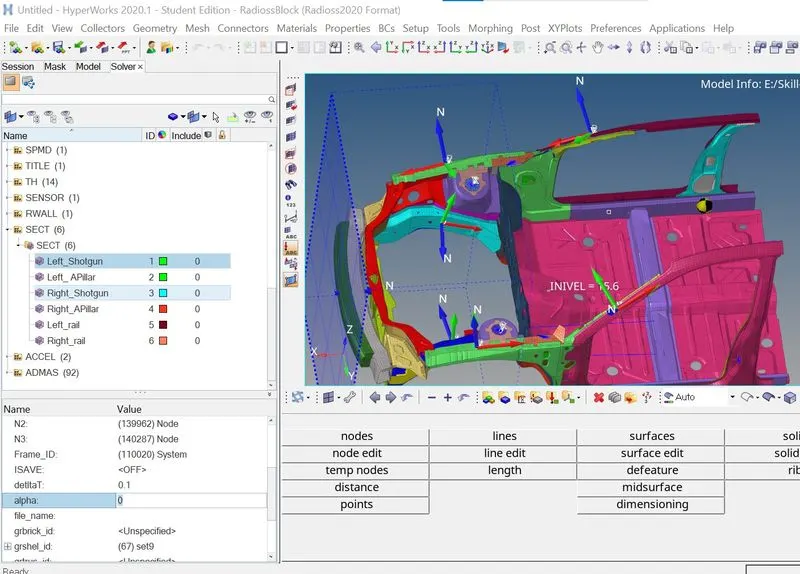
- Creation of Sections at A-Pillar, Shot Gun, rails and the Bumper in order to Study the sectional forces
- We have to know how the forces are transmitted from the Bumper to the Dashboard and the rate of deformation. It is done in order to ensure the safety of the passenger.
- Certain components have to crash (deform) more than the other so that the forces are distributed correctly leaving very little force left to transmit inside the cabin.
- We are creating sections for the following parts:
| Sl. no | 1 | 2 | 3 |
| LEFT SIDE SECTION | RAIL | SHOTGUN | A-PILLAR |
| RIGHT SIDE SECTION | RAIL | SHOTGUN | A-PILLAR |
- To create a section and Frame
- Go to Slover browser >> Create >> Section >> SEC >>
- Initially, the section was created and the fixed frame is created and it is assigned to the respective section.
- Similarly, the above-mentioned parts section was created.
CREATE ACCELERATION NODES:
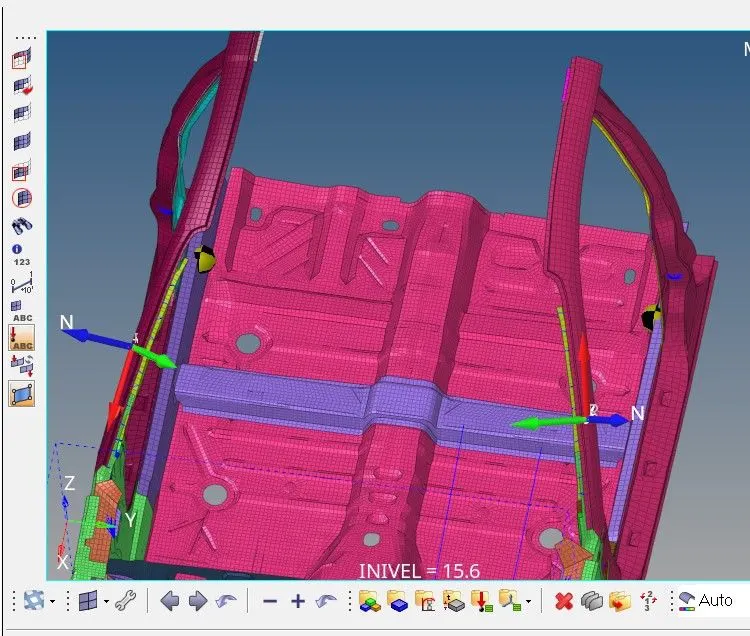
- Creating Accelerometer at both sides of the B pillar.
- An accelerometer is a basic technology that converts mechanical motion into an electrical signal. It is an electromechanical device that measures acceleration forces, whether caused by gravity or motion.
- To create accelerometer
- Go to Model browser >> Create >> Accelerometer >> Select Node_ID >> Select node >> Proceed
CREATE SPRINGS:
- We are planting Spring elements to study the intrusions (forces inside the cabin causing deformation/rupture).
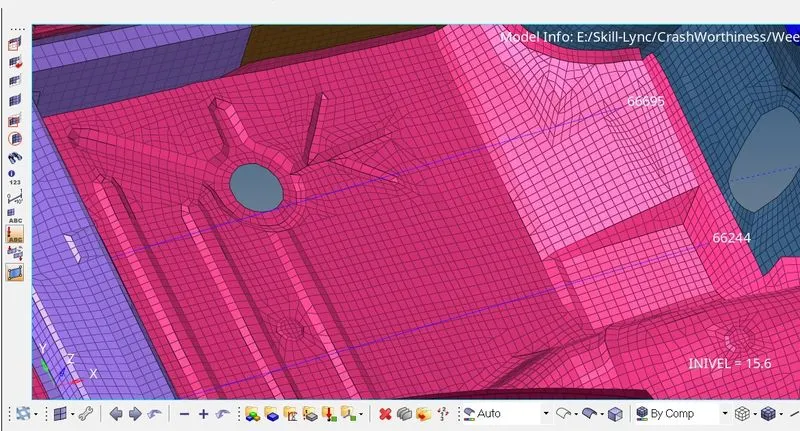
- Create 2 parallel spring elements from the indicated nodes (66695,66244) till the Crossbeam.
- Springs can be created from the 1D Panel > Springs
- To create a spring first as temp node at that particular node id then select another node on other to see deflection after crash
- After adding nodes now
- Go to 1D page >> Springs >> Select first and Second node >> Create spring
CREATE PROPERTIES TO SPRINGS:
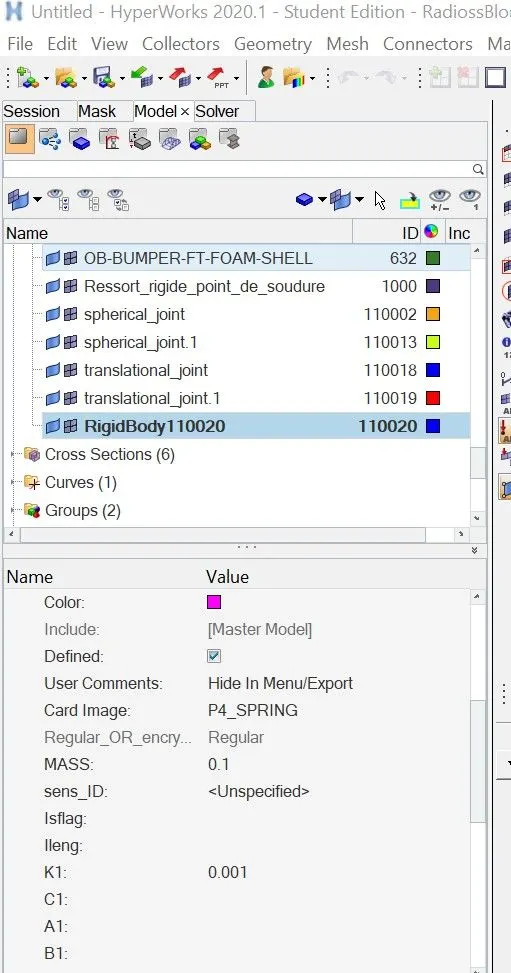
- To create spring property
- Go to Components >> RigidBody >> Property >> P4 spring type is selected, mass and stiffness value is assigned.
REQUESTING TH FOR INTRUSION SPRINGS, ACCELEROMETER, SECTION FORCE:
Delete existing TH and create new.
They are Output files that are requested in the Starter File.
- All the Global variables (Internal energy, Kinetic energy, Contact Energy, Hourglass Energy, etc.) are already requested by default.
- We have to call for additional Time History files for the boundary conditions that we have created for the frontal crash model.
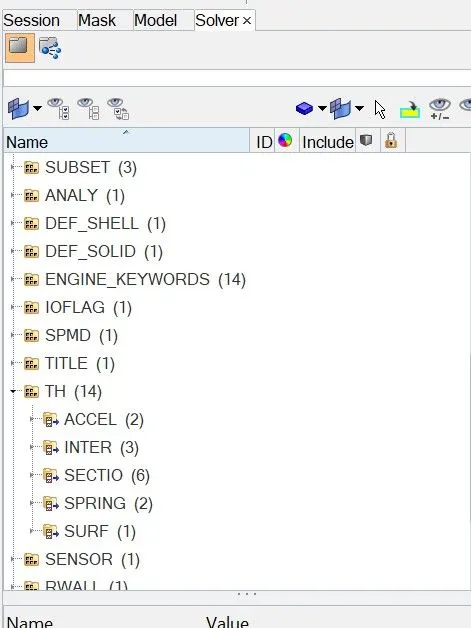
- We can create the Output requests from within the Solver Browser:
Solver Browser > Right Click > Create > TH > Select the Output Request
|
Output Requests |
Boundary Conditions |
|
INTER |
i. Self Impact ii. Left Bumper and headlight iii. Right Bumper & headlight |
|
ACCEL |
i. On Left B Pillar ii. On Right B Pillar |
|
SPRING |
i. Intrusion on node 66244 ii. Intrusion on node 66695 |
|
RWALL |
i. Rigid Wall |
|
SECTION |
i. Left Rail ii. Right Rail iii. Left A-Pillar iv. Right A-Pillar v. Right Shotgun vi. Left Shotgun |
To create TH
Go to Slover browser >> Right click >> Create >> TH >> Select section for Sectional forces >> ok.
CREATE REQUIRED CARDS:
TIMESTEP CONTROL
|
Engine Card |
TSCALE [Scale factor] |
Tmin [Critical Timestep] |
Description |
|
ENG_DT_NODA |
0.67 |
0.001 |
Mass is added to the node when the computed timestep becomes smaller than the critical timestep. |
|
ENG_DT_BRICK |
0.9 |
0.0001 |
Controls the timestep by small strain formulation on the elements if they cause the timestep to drop. |
|
ENG_DT_INTER |
0.9 |
0.0005 |
Uses the default constant timestep method. |
Enter T stop as 80ms and T freq as 5
Go to ENG_RUN enter T stop as 80ms
For T freq
Go to ENG_ANIM_DT enter T freq as 5
Then using model checker option errors were checked and in that the unused cards are deleted.
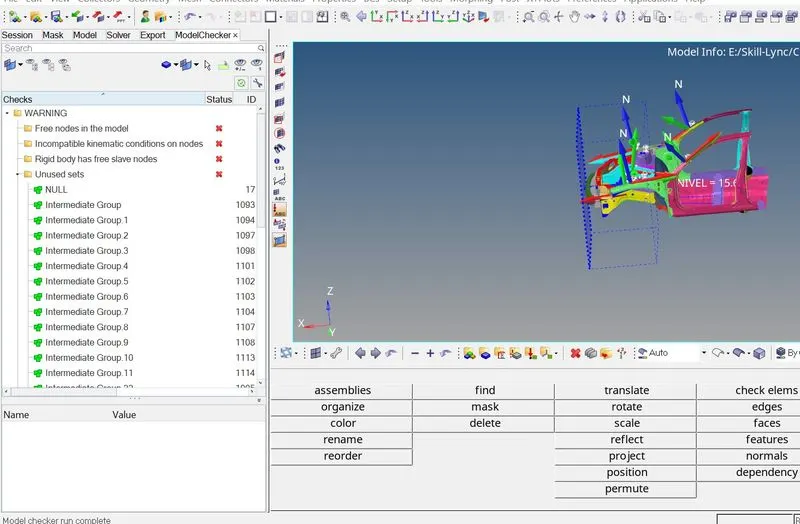
The warnings can be ignored.
RUN THE ANALYSIS:
Analysis >> Radioss >> Input File: (File Location) >> Hit Radioss
The input file is the same Started file (contains model information) that we had just imported.
The animation video along with the frames will be saved in the same folder where the starter file exists.
Review the Simulation
We have to import the animation file in HyperView first:
HyperView >> FIRST_RUN. h3d >> Apply
- The tools to review the simulation are available on HyperView.
- HyperView is a post-processing and visualization environment for FEA that gives the output of the analysis in a simulations format that is user friendly to understand.
- From the simulation, we can review how the impact force acts and causes deformations and point of rupture on the model.
VonMises:
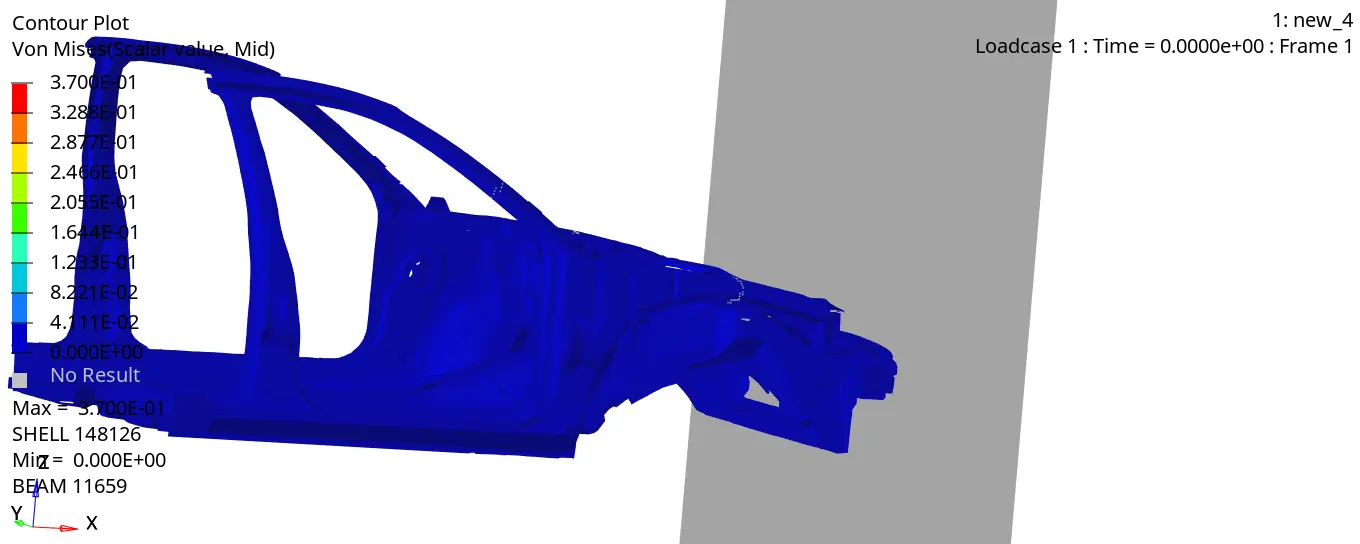
From the simulation, we can see that, Initially, the bumper starts crushing then the bumper forces are transferred to the left and right rail from the rail forces are transferred to A-Pillar LH and RH. In each stage, the forces are going to reduce because energy is absorbed in each stage. Because of no engine blocks, suspension system etc the car BIW is going to go down at the end of the simulation.
Results after simulation:
1) Energy and Mass error:
- At the end of the simulation, do the energy error and mass error checks and determine whether results would be acceptable
- Open the save location file and click on the output file of the simulation to check for the Energy error and Mass error.
- If the error is negative, it means that some energy has been dissipated.
- In the case of under integrated elements (Belytschko shells, solids with 1 integration point), the Hourglass Energy can explain a negative Energy Error since it is not counted in the energy balance. The normal amount of Hourglass energy is about 10% to 15%.
- If the error is positive, there is an energy creation.
- In the case of using QEPH shell formulation or fully integrated elements, the Energy Error can be slightly positive since there is no Hourglass energy and the computation is much more accurate. An error of 1% or 2% will be acceptable.
- In the case of a larger positive energy, the source of this energy has to be identified. Incompatible kinematic conditions can lead to such a situation.
- If the error reaches ±99%, the computation has diverged; except in the first cycle of a run for which the initial energy of the system was null so that a relatively false energy balance often introduces large relative error.
After simulation run
Check the Starter Output File for Errors:
- A starter Output file of .out format is generated after analysis.
- The Output file contains the data during simulation, such as Cycle, Timestep, Energies, and Errors.
- We have to check for energy and Mass error which means that the solver did not need to add mass onto the nodes to reduce the timestep to further avoid the Hourglass Error.
OBSERVATION:
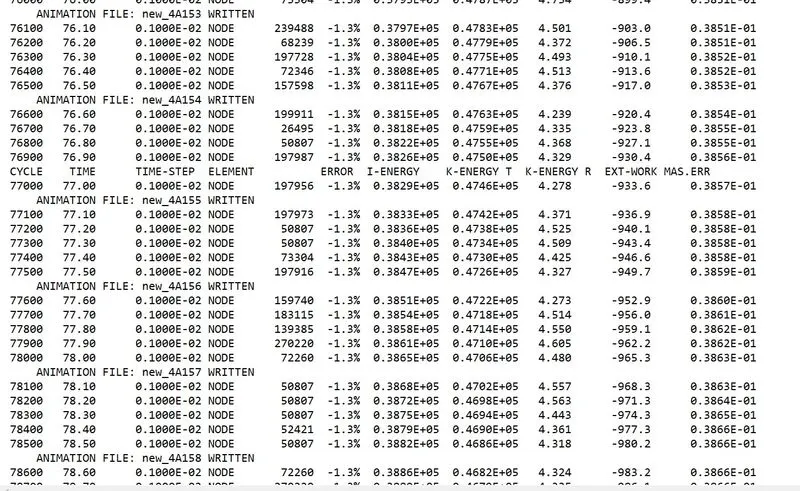
- The Energy Error is Negative and it is in the range -1.4% to 0.8% which is acceptable.
- Mass error is 0.014 to 0.038 which is acceptable.
- We can conclude that there are no errors in the analysis.
PLOT THE GRAPH AND COMPARE RESULTS:
The tools to plot the graph are available on Hypergraph.
Hypergraph 2D >> Data File >> FIRST_RUNT01 >> Apply
A hypergraph is a data analysis and plotting tool that represents the FEA from the simulation in graphs with respect to the selected unit system.
INTERNAL ENERGY AND KINETIC ENERGY:
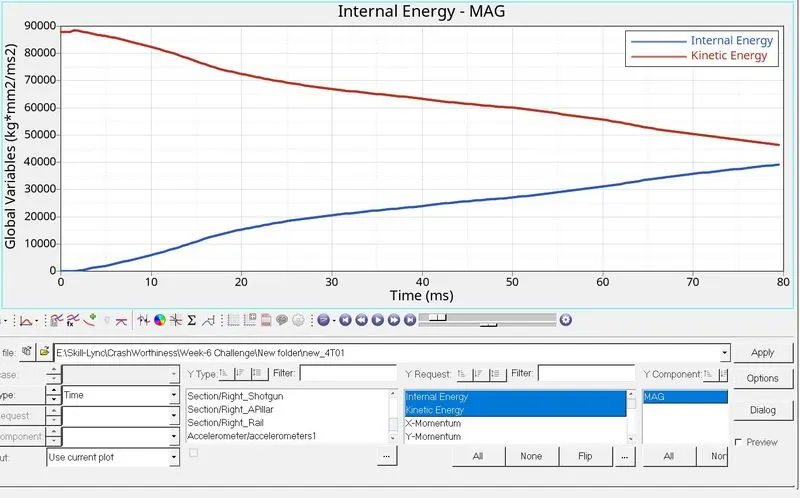
Internal energy is nothing but distortion energy. When the Kinetic Energy is Decreases, the Energy absorbed by the system increases i.e we all know that Energy neither be created nor be destroyed. Once the vehicle is moving with a certain velocity (Say 15.646mm/ms for the Model), the initial kinetic Energy will be High (Refer to Above Graph). Once the car is hit by the rigid wall, the vehicle starts deforming results in absorbing the Surrounding Energy and Stored it. Thus, internal Energy starts increasing. At the Maximum deformation, the Velocity will become Zero and thus the kinetic Energy will also be dropping down to zero resulting there is no energy to absorb in the system. Thus, Internal Energy Remains Constant thereafter.
CONTACT ENERGY AND HOURGLASS ENERGY:
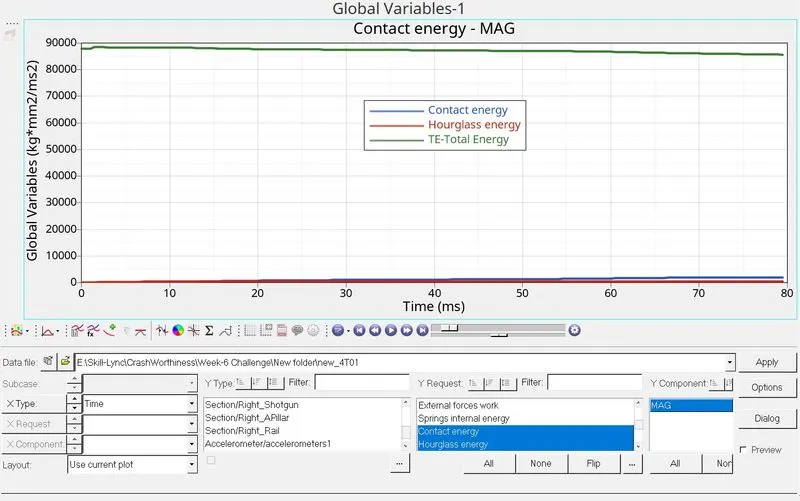
From the above graph, we can see that the Hourglass energy is almost negligible since we have used Improved integrated element formulation (QEPH).
Ideally, all of KE should be converted into IE and the Total Energy must remain constant, but in our case, since we have Hourglass Energy error, our Total Energy is decreasing. We can rectify this hourglass energy by further reducing the Timestep of the simulation and giving the Ideal Properties wherever we can. Our Requirement from an Ideal Simulation is that we have minimal Contact energy and maximum Energy absorption/Deformation in the elements. We can check the Energy error in the Engine output file, which has maxed out at -1.4% to 0.8% which is within the limits. Our Mass error is also very minimal which means that the solver did not need to add mass onto the nodes to reduce the timestep to further avoid the Hourglass Error.
Contact Energy is nothing but the opposite energy generated from the System to Avoid Penetration. To avoid penetration, we have determined the Gap min value to 0.5. When the car is moving with a velocity of 35mph and hits the rigid wall, it starts deformation at the bumper section and hence the penetration of the elements occurs and thus the opposite reaction force also exerted in order to avoid the penetration. Hence the contact energy increasing gradually from zero.
SECTIONAL FORCES:
1. On RAILS:
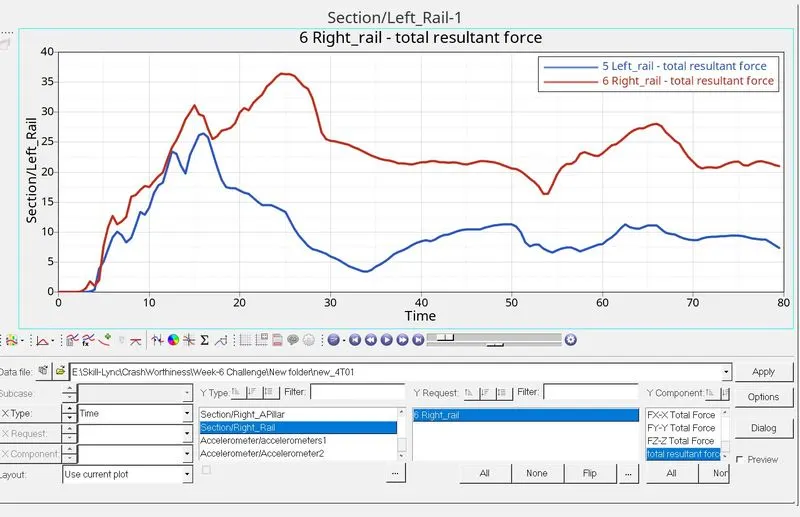
The maximum cross-sectional force at Left Rail is 26 kN/mm at t= 16ms whereas the maximum cross-sectional force at the Right rail is 36 kN/mm at t=25 ms. The force acting on the rail is the force transmitted by the bumper during the crash. The force transmitted by the bumper to the rail can be unequal due to which the force received at the LH rail may differ from the RH rail. During a crash, the rail will get into direct contact with the rigid wall which will increase the compressive force and then deform. Therefore, the compressive force drops down.
2. On Shotguns:
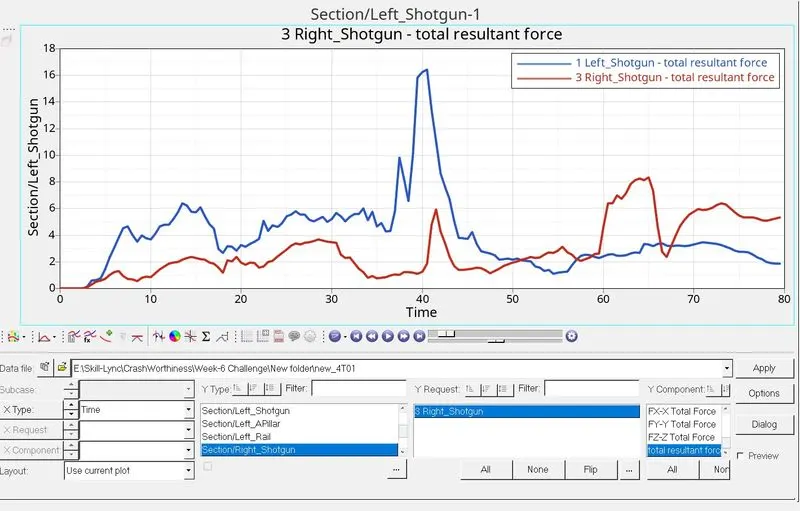
The maximum cross-sectional force at Left Shotgun is 16 kN/mm at t=41 ms whereas the maximum cross-sectional force at Right Shotgun is 8 kN/mm at t=65ms. The Force that occurred at the shotgun is the force transmitted from the rail section. The force propagation is not the same at both the rails and hence the amount of deformation at both the shotgun sections are different. Once the Compressive force reaches its maximum value it starts to deform rapidly. Therefore, the Compressive force is decreasing as referred from the graph. As the crash happen continuously, the shotgun will come into contact with the Rigid wall as found in Animation, the rigid wall also exerts the force directly on to the shotguns and hence there is an increase in the Sectional force as seen in the graph.
3. On A-Pillars:
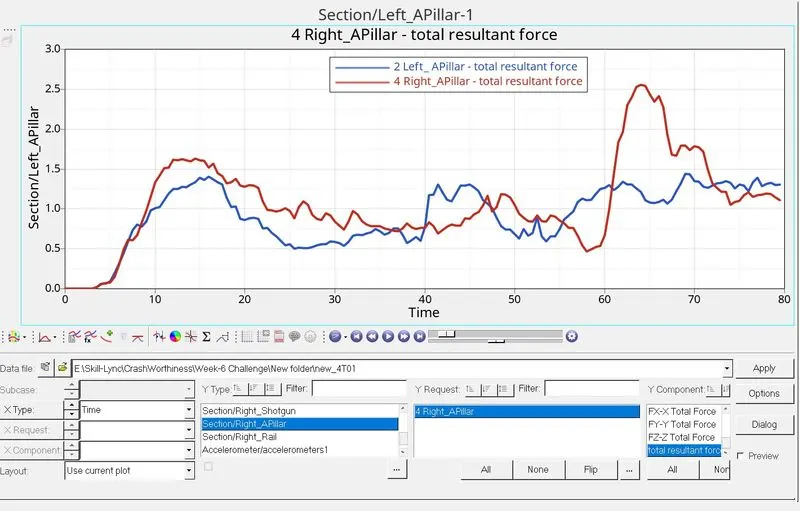
The maximum cross-sectional force at Left A-Pillar is 1.5 kN/mm at t= 69 ms whereas the maximum cross-sectional force at Right A-Pillar is 2.5 kN/mm at t=64 ms when the car hits the rigid wall, there will be some amount of force coming into the A-pillar at both sides. These forces coming to the A-pillar are nothing but the force transmitted from the rail and the shotgun. The force flowing into the LH and RH of the A-pillars will not be equal and hence the deformation of the elements will differ accordingly. During a frontal crash, the sectional force reaching the A-pillars are coming in from the rails and shotgun, hence the force at the A-pillars will be less when compared to the front sections. When the compressive force between the wall and car is maximum, the rail and shotgun get in contact with the rigid wall which causes the shotgun and rail to exert more force. This force then propagates to the A-pillars and hence the force reaching the A-pillar increases again.
INTRUSION SPRINGS:
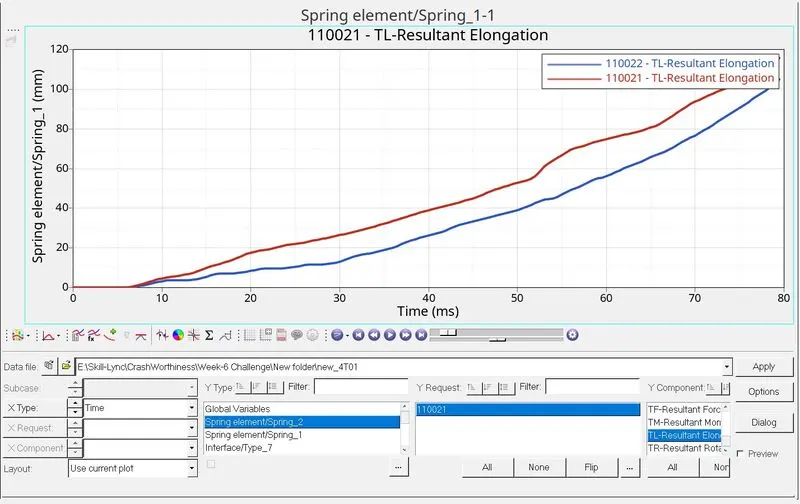
To check the Intrusion at the dash wall at the particularly given node, we have created the spring over the place. The intrusion at this particular node is calculated in order to check whether the crash will result in the safety of the driver due to the deformation that occurred at the front portion of the vehicle. From the above graph, we can see that the maximum intrusion occurred in the spring (Node 66695,121754) during a crash is 102 mm and the maximum intrusion occurred in the spring (Node 66244,121868) during a crash is 112 mm. Practically this elongation referred to which extent the foot pedal or the passenger's legs will move once the crash is happening. From the animation, we can notice that there is not much deformation that occurred at this location and the elongation is also low. Hence, we can conclude that there are fewer injuries will happen to the Passenger/driver.
ACCELEROMETER:
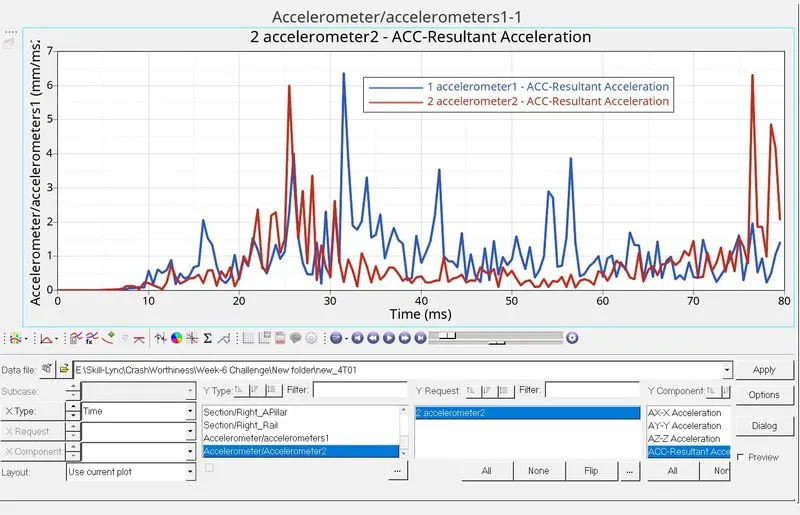
As we all know that an Acceleration is the rate of change of velocity. To measure the acceleration, we have placed the accelerometer near the Rocker of B-Pillar on both sides. From the above graph, we can see that initially, the acceleration is constant before the vehicle hitting the rigid wall. Once the Car hits the rigid wall with the initial velocity, The acceleration of the vehicle during the crash is not constant across the structure. The front of the vehicle slows down immediately as it hits the rigid wall, while the rest of the structure decelerates at a slower rate as seen in the graph. As seen from the graph there is a sudden increase in the acceleration, this might be because of some vibration that occurs during the crash with respect to the point where the accelerometer is placed.
Maximum acceleration at LH = 6.5 mm/ms2 at t=32 ms
Maximum acceleration at RH = 6 mm/ms2 at t=25 ms
AXIAL FORCES ON RAIL OF BUMPER:
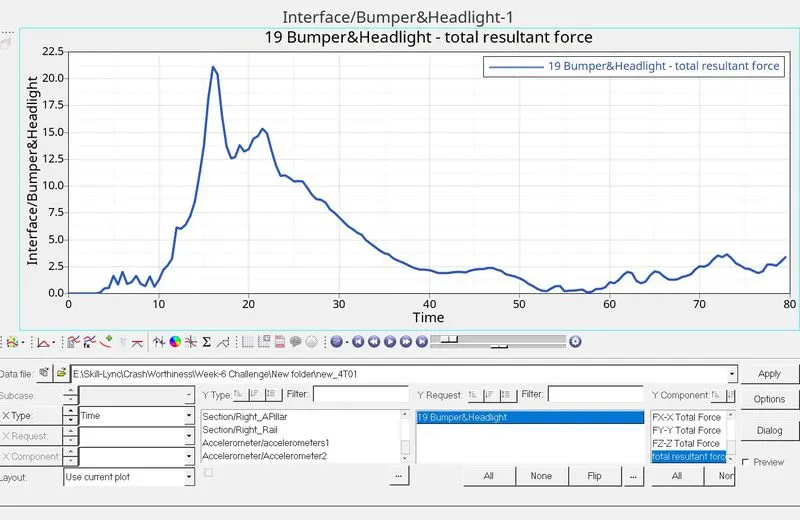
From the graph we can see that initially there is no axial force is transmitted from the bumper to the Rail. Once the Vehicle hits the rigid wall, first the Bumper will start deforming transmitting the strain energy to the rail sections. From the graph, we found that the Maximum axial force received from the bumper to the rail is 21 KN at 16ms
Learning Outcome
- Learned how to set up a frontal crash test.
- Learned how the Rigid wall interface works and can lead to incompatible Kinematic conditions.
- Learned how Sectional forces are generated.
- Learned how the distribution of forces among the components during a frontal crash.
- Learned how some components are designed to deform in such a way to ensure the safety of the passengers inside the cabin.
- Learned how to check for Energy, mass, and momentum balance.
- Learned how to Debugging errors in order to get the right results.
CONCLUSION:
The given model was simulated for the frontal crash using Radioss and the results obtained were validated. The graphical results were plotted for all the test cases. From the simulation, it can be observed that there was minimum deformation in the cabin, and also minimum intrusion was found in the driver’s seat area.