Writing MATLAB/Octave Program That Compares The First, Second & Fourth Order Approximations of The First Derivative Against The Analytical Or Exact Derivative.
Problem Description
1. The function that needs to be computed, if f(x) = sin(x)/x^3
2. You will compute the first derivative at x = pi/3 for dx = pi/30.
2a. You will compute the derivative both numerically and analytically. Make sure you compute 1st, 2nd, and 4th order approximations.
3. Define an error parameter as the absolute difference in numerical and exact derivative at x = pi/3
4. Plot a bar graph that shows the error
5. You need to have appropriate labels and legends on your plot
6. Make sure you upload your file
The formula for the fourth-order approximation of the first derivative
MATLAB/Octave Code:-
------------------------------------------------------------------------------------------------------------------------------------------------------------------------------
---------------

clear all
close all
clc

% [Analytical Function] = sin(x)/x^3

% [Analytical Derivative] = f'(x) = (x^3*(cos(x))-sin(x)*3*(x^2))/(x^6)

x = pi/3;
dx = pi/30;

analytical_derv = (x^3*(cos(x)) - sin(x)*3*(x^2))/(x^6);

% First order approximation, Forward Differencing

forward_diff = ((sin(x+dx)/(x+dx)^3) - (sin(x)/(x)^3))/dx

%Second order approximation, Central Differencing

central_diff = ((sin(x+dx)/(x+dx)^3) - (sin(x-dx)/(x-dx)^3))/(2*dx)

%Fourth order approximation

fourth_order_diff = ((sin(x-2*dx)/(x-2*dx)^3) - 8*(sin(x-dx)/(x-dx)^3) + 8*(sin(x+dx)/(x+dx)^3) - (sin(x+2*dx)/(x+2*dx)^3))/(12*dx)


%errors

error_first_order = abs(forward_diff - analytical_derv);
error_second_order = abs(central_diff - analytical_derv);
error_fourth_order = abs(fourth_order_diff - analytical_derv);


%bar graph plotting

error = [error_first_order, error_second_order, error_fourth_order];
bar (error, 0.3)
xlabel ('Order of Approximation')
ylabel ('Truncation Error')
legend ('Order of Derivative Approximation Errors')


------------------------------------------------------------------------------------------------------------------------------------------------------------------------------------------
Bar Graph Plot :-
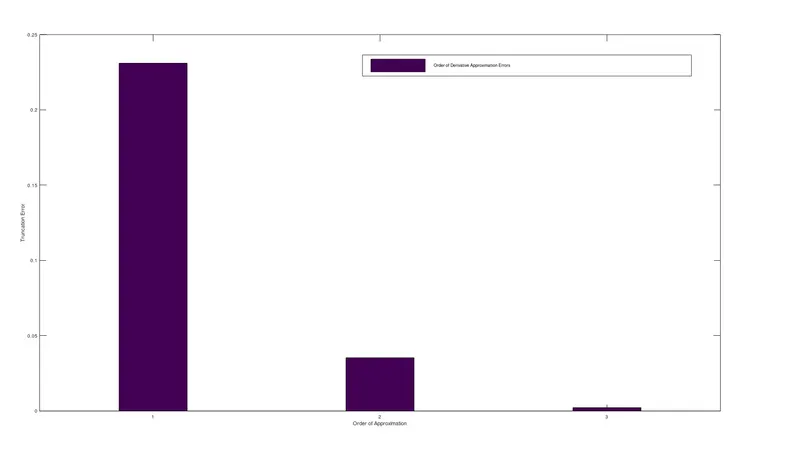
Conclusion:- The bar graph clearly shows that the truncation errors generated for the fourth-order approximation are the lowest which is then followed by the second-order approximation & then first-order approximations. This indicates that first-order approximations are the least accurate since containing large errors.