Wide-Open throttle of an electric vehicle and Using powertrain blocksets in the MATLAB
AIM :-
To find the Wide-Open throttle (WOT) of an electric vehicle(GM EV1 car) and Using powertrain bolcksets in the MATLAB to diffrerntiate the WOT conditions of the HEV and EV.
OBJECTIVE :-
- Analyse the WOT Condition of GM EV1 car with comparison with initial vehicle Parameters and 5% increase in the vehicle Parameter.
- Difference between mapped and dynamic model of engine, motor and generator using Powertrain blockset.
-
Calculating miles per gallon in HEV model and finding factors considered to model fuel flow.
-
Simulating HEV and EV WOT condition using Powertrain Blockset and Change the grade and wind velocity in the environment block. Commenting and Comparing the results.
WIDE OPEN THROTTLE :-
Wide open throttle (WOT) can be explained as maximum intake of air and fuel that occurs when the throttle plates inside the carburetor or throttle body are "wide open", providing the least resistance to the incoming air. In the case of an automobile, WOT is when the accelerator is depressed fully, sometimes referred to as "flooring it."
In the case of a diesel engine, which does not have a throttle valve, WOT is the point at which the maximum amount of fuel is being injected relative to the amount of air pumped by the engine, generally in order to bring the fuel-air mixture up to the stoichiometric point.
At wide open throttle, manifold vacuum decreases. The higher manifold pressure in turn allows more air to enter the combustion cylinders, and thus additional fuel is required to balance the combustion reaction. The additional air and fuel reacting together produce more power.
In Electric vehicle, WOT condition refer to the initial acceleration or time taken by the vehicle to reach maximum velocity. Maximum velocity in WOT condition can be obtained by electric motor characteristics of an electric vehicle.
WIDE OPEN THROTTLE OF GM EV1 CAR :-
We will calculate the WOT conditions of the GM EV1 car by comparing it with inital vehicle parameter with the 5% increase in the vehicle parameters.
Now,

Subsituting above equation of T we get,

For ω<ωc, In the initial acceleration phase, when T = Tmax, we get

Where,
- G : Gear Ratio
- r : Tire radius
- T : Torque
- mu : Rolling resistance
- m : Mass of Vehicle
- g : acceleration due to gravity
- A : Frontal Area
- Cd : Drag Coefficient
- v : Velocity of the vehicle
- I : Moment of Inertia
- etag : Gear Efficiency
- dv/dt : Acceleration of Vehicle
**Since MOI of the motor is not known, and considering the MOI of Vehicle, MOI of motor can be neglected or an 5% effect can be considered in above Equation !!!!!
CALCULATIONS:-
P=T*W
Power = Torque * Angular Velocity

T = P/W

also, V = W*r   Linear Velocity = Angular Velocity * radius

T = P/(V/r)

Considering Fixed Gear Ratio 'G' bw Wheel and Motor

T = P/(GV/r)
Now for region beyond Critical Speed,
Now we have 2 equations,
- T = Tmax = 140
- T = 2757/v
Substituting the 2 equations in to the Governing Equation,
0.95*37*140 = (0.0048*1500*9.81)+(0.625*0.19*1.8v^2)+(1575)dv/dt
4921 = 70.632 + 0.214v^2 + 1575 dv/dt
4850.37 = 0.214v^2 + 1575 dv/dt
dv/dt = 3.08 - 0.0001358v^2
0.95*37*2757/v = 70.632 + 0.214v^2 +(1575)dv/dt
96908/v = 70.632 + 0.214v^2 + 1575 dv/dt
dv/dt = 61.53/v - 0.045 - 0.0001358v^2Solving the above 2 differential Equations will gives us the Motor Characterstics & WOT Conditions.
Case 2 : With 5% increase in Vehicle Parameters:-
0.95*37*140 = (0.00504*1575*9.81)+(0.625*0.19*1.8v^2)+(1654)dv/dt
4921 = 77.87 + 0.214v^2 + 1654 dv/dt
4843.13 = 0.214v^2 + 1654 dv/dt
dv/dt = 2.93 - 0.000129v^2
0.95*37*2757/v = 77.87 + 0.214v^2 +(1654)dv/dt
96908/v = 77.87 + 0.214v^2 + 1654 dv/dt
dv/dt = 58.59/v - 0.047 - 0.000129v^2MATLAB program to evaluate WOT conditions :-
% WOT CONDITION OF GM EV1 CAR

% Time period(sec) in 01sec steps
t1 = linspace(0, 100, 1001);

% Velocity matrix(m/sec)
v1 = zeros(1, 1001);

% 0.1 second time step
dt = 0.1;

for i = 1:1000

    if v1(i) < 19.8  % Torque constant below this critical point
        v1(i+1) = v1(i) + dt*(3.08 - (0.0001358*(v1(i)^2)));

    elseif v1(i) > 36.1  % Top Speed of the vehicle
        v1(i+1) = v1(i);

    else
        v1(i+1) = v1(i)+dt*(-0.045+(61.53/v1(i))-(0.0001358*(v1(i)^2)));
    end
end

v1 = v1*3.6;  % mps to kph

% CASE-2, with 5% increase in the vehicle parameters

% Time period(sec) in 01sec steps
t2 = linspace(0, 100, 1001);

% Velocity matrix(m/sec)
v2 = zeros(1, 1001);

% 0.1 second time step
dt = 0.1;

for j = 1:1000

    if v2(j) < 19.8  % Torque constant below this critical point
        v2(j+1) = v2(j) + dt*(2.93 - (0.000129*(v2(j)^2)));

    elseif v2(j) > 36.1  % Top Speed of the vehicle
        v2(j+1) = v2(j);

    else
        v2(j+1) = v2(j)+dt*(-0.047+(58.59/v2(j))-(0.000129*(v2(j)^2)));
    end
end

v2 = v2*3.6;  % mps to kph

% Now Calculating acceleration time for both cases
for n = 1:1000
    if v1(n) == v1(n+1)
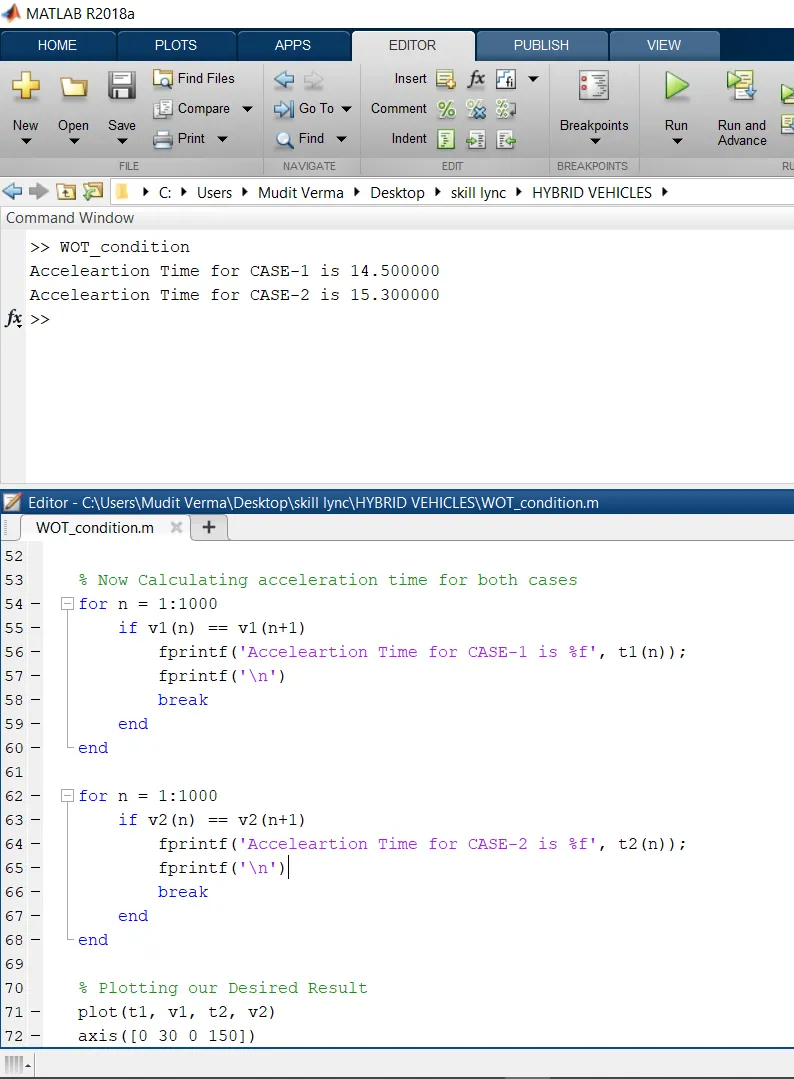
        fprintf('Acceleartion Time for CASE-1 is %f', t1(n));
        fprintf('n')
        break
    end
end

for n = 1:1000
    if v2(n) == v2(n+1)
        fprintf('Acceleartion Time for CASE-2 is %f', t2(n));
        fprintf('n')
        break
    end
end

% Plotting our Desired Result
plot(t1, v1, t2, v2)
axis([0 30 0 150])
xlabel('Time(sec)')
ylabel('velocity(kmph)')
grid on
legend('With Initial vehicle Parameters','With 5% Increase in vehicle Parameters')
title('WOT CONDITION OF THE GM EV1 CAR')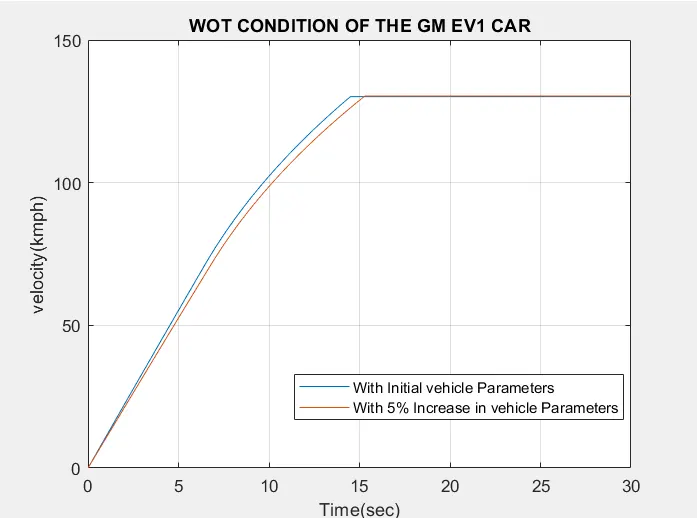
POWERTRAIN BLOCKSET :-
- The Powertrain Blockset consists of library of Automotive components as well as the pre -assembeled engine dynamometer.
- It can be used to construct a complete vehicle model and can be used for fast simulation and real time testing.
- The Powertrain library consists of componenets essential to model automobile systems and we can assemeble this library block to create complete engine subsystem.
- We can then connect the engine to other components to create a complete vehicle model which can be simulated under a variety of test conditions.
- It generates the initial calibrating maps before we get to test the real hardware.
- It includes complete vehicle reference applications to analyse the fuel economy and control developement.
- The models are open and can be customized ,we can parameterise components with own data and check the results for our data.
- The main advantages of using Powetrain blockset is it saves time and also before developing the real model we can check for the results for various input combination to get the best out of the simulation model.
Features of blockset:-
- library of building blocks
Figure.1 Powertrain library blocks
- Pre-built reference application
Figure.2 Pre-build reference application examples
The Powertrain Blockset are the set of fully assembled reference applications, including gasoline, diesel, and hybrid and electric vehicle systems, as a starting point for your powertrain model.
1. What is the difference between mapped and dynamic model of engine, motor and generator? How can you change model type?
- In powertrain blockset we can select the model of the Internal combustion engine,Electric motor and Generator as Mapped or Dyanamic type.
Mapped and Dynamic subsystem of Electric Motor/Generator
Mapped Model:
- The mapped model is one type where the data points are pre_assigned in lookup tables.
- The engine or motor torque required is sensed and the motor or engine block generates the requiered torque output just as required simply without considering the real time motor or engine, parameters
- The output values are stored for the corrresponding given input values of the engine motor and generator.
- The accuracy of this type is not that high but the simulation will be done in much less time as it does not run by real time parameters.
Dyanamic Model:
- The dyanamic model in other hand uses the combination of the outputs from various subsystems to generate the output.
- It runs by real time simulation where the required input from the drive cycle is taken and for that individiual real time simulation gets performed and summing all the results of the subsystem gives the output for the simulation.
- As per the drive cycle requirements the initial Bus voltage ,current is given along with the vehicle feedback so that it runs the actual simulation at that particuclar moment throught the drive cycle.
- The accuracy of this model is very high as it considers the real outputs from all the subsystem to generate the output.
- The simulation will take very long time to complete as it has so many individual simulations running by all the subsystem of the engine , motor/generator.
- The figure below shows the working phase of the dyanamic model.
Steps to Change the Model Type in the Simulink blocks :-
- In the powertrain blockset module we first need to select the vehicle type first wheather it is full electric , full engine or the type of hybrid vehicle.
- After that the Simulink model appears by showing the work flow blocks of the model.
- In that we need to go to Passenger Block → Electric plant → EV Motor/Generator block.
- After this just right click and go to Variance → Label mode Active choice → MotorGenEV Mapped or Dyanamic.
2. How does the HEV model calculate miles per gallon? Which factors are considered to model fuel flow?
Simulink model calculating miles per gallon as result output for pre-built hybrid models:-
- Miles per Gallon is a fuel economy rating determined by how far a car can travel on a gallon of petrol or Diesel for a Engine powered car.
- In case of an electric vehicle it tells us the energy which is equivalent that of a engine powered car to propel the car through a distance.
- The amount of Fuel Energy required to move a engine powered car through a distance is determined and then it is compared to the eqivalent amount of electric energy required to move the car throgh the same distance and is expressed as the miles per gallon.
- The powertrain blockset has a model that calculates the miles per gallon for all kinds of vehicle.
For the model for calculating fuel economy is shown below in the figure in liters per 100 km (miles per gallon ) . It takes fuel flow rate, vehicle speed and battery power(for electric system) as input for visualization of the fuel economy.
It takes the speed from the drive cycle, battery power from soc of battery and fuel flow from engine output to calculate the fuel efficiency.
if we see inside the mask the simulink calculator model look like (see below)
Vehicle speed(1) & Fuel flow(2) :-
- The Vehicle speed is a important factor while considering the fuel consumption at that particular time,so to determine the fuel consumption throughout the drive cycle.
- To convert speed to Distance we can Integrate with time and we are doing the same of converting the velocity to get distance covered by integrating.
- Then the Fuel flow is expressed as the mass flow rate (i.e) the amount of fuel at each moment in Kg/Sec. Now integrating this will result in the mass of the fuel and by using this 1/(1000*0.739) we convert it to the volume and by multiply by 1000 to get it in Litres.
- By comparing the two results we can get the amount of litre consumed to Run for 100km.
Battery Power(3) :-
- The amount of Energy from battery power required to propel the vehicle Equivalent to that of the Engine is calculated here.
- The battery power is given in watts and it is converted to Kw by dividing with 1000.
- Then we convert the power into energy by multiplying with the time into Kwh.
- Then we convert the Energy from kwh to equivalent energy in US gallon of automotive gasoline by dividing with 33.7. since we get the energy in US Gallons equal in KWh we are trying to get the energy of equivalent US Gallons per seconds and we do this by dividing with 3600 and we convert the hour to seconds.
- Then multiplying with 0.00378541 we convert the US Gallons per sec to the volume of the fuel flow in (m^3/ s) and then we multiply with 739 (California Phase II Gasoline density) (i.e) m^3/s * kg/m^3 which gives the result as mass flow rate kg/s.
- Then finally the Battery energy equivalent in kg/s is given as a input for the fuel flow parameter in order to find the equivalent US Gallons enegy and estimate the Miles per Gallons.
Calculating Miles per Gallon(4) :-
- Then the inputs from the vehicle speed (i.e) the Distance we found (in meters) is taken into the calculation and it is converted to the miles by multiplying with 0.000621371.
- Then the inputs from fuel flow (Battery energy + Fuel energy) taken in m^3 and is converted into equivalent US Gallons by multiplying with 264.172.
- Then the two inputs Miles covered and equivalent US Gallon is further divided and the result is got in Miles / Gallon.
Simulate HEV and EV WOT condition using Powertrain Blockset and Change the grade and wind velocity in the environment block. Comment and Compare the results
HYBRID ELECTRIC VEHICLE :-
A hybrid electric vehicle (HEV) is a type of hybrid vehicle that combines a conventional internal combustion engine (ICE) system with an electric propulsion system (hybrid vehicle drivetrain). The presence of the electric powertrain is intended to achieve either better fuel economy than a conventional vehicle or better performance. There is a variety of HEV types and the degree to which each function as an electric vehicle (EV) also varies.
Modern HEVs make use of efficiency-improving technologies such as regenerative brakes which convert the vehicle's kinetic energy to electric energy, which is stored in a battery or supercapacitor. Some varieties of HEV use an internal combustion engine to turn an electrical generator, which either recharges the vehicle's batteries or directly powers its electric drive motors; this combination is known as a motor–generator. Many HEVs reduce idle emissions by shutting down the engine at idle and restarting it when needed; this is known as a start-stop system. A hybrid-electric produces fewer tailpipe emissions than a comparably sized gasoline car since the hybrid's gasoline engine is usually smaller than that of a gasoline-powered vehicle. If the engine is not used to drive the car directly, it can be geared to run at maximum efficiency, further improving fuel economy.
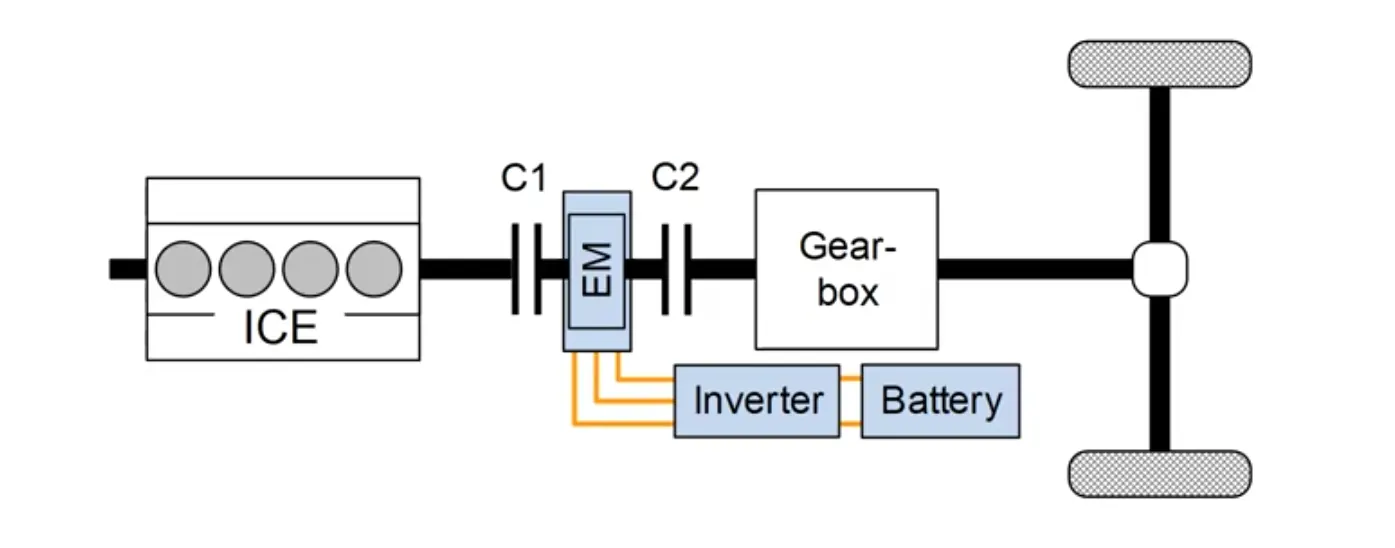
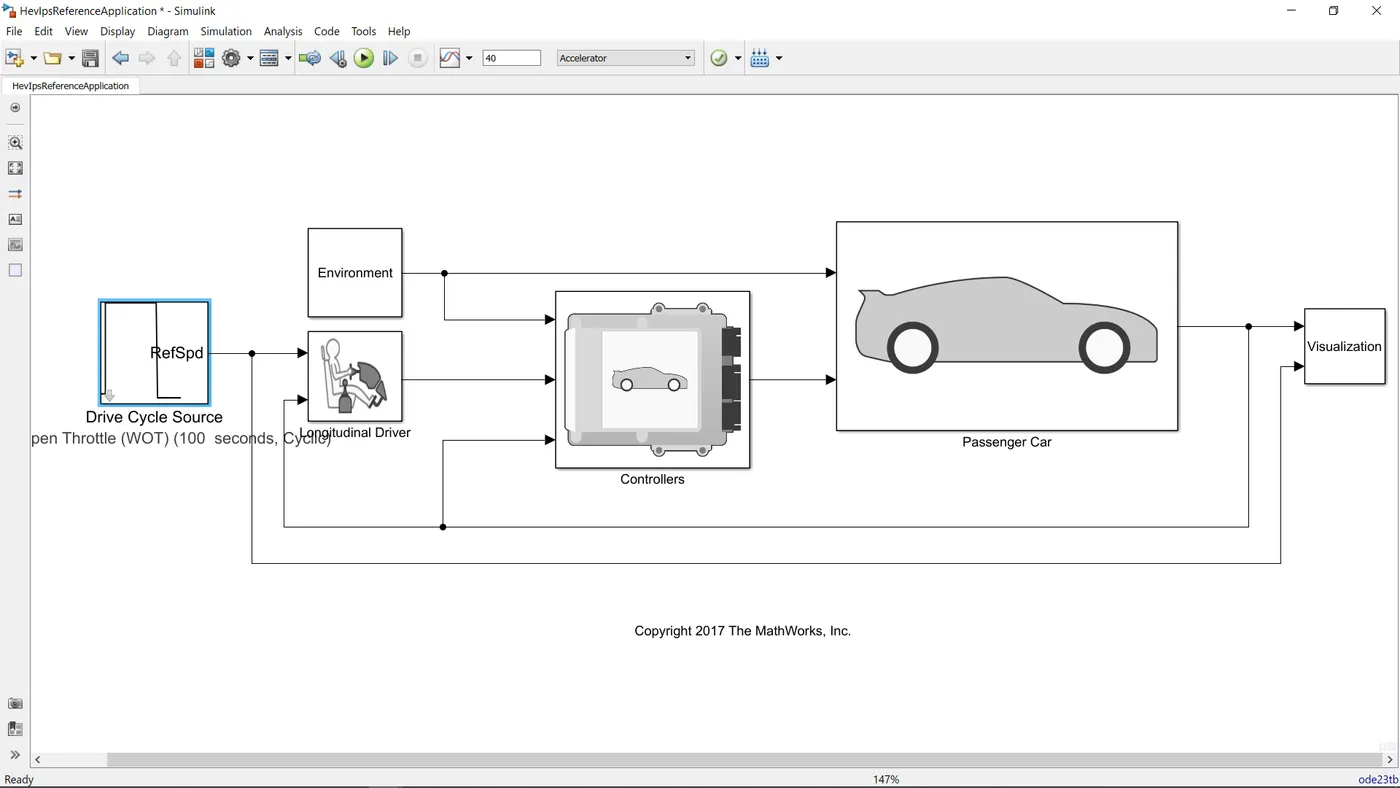
In the powertrain blockset we will select the hybrid electric vehicle and this is the simulink model and Input the desired Parameters as our wish and Simulate the HEV.
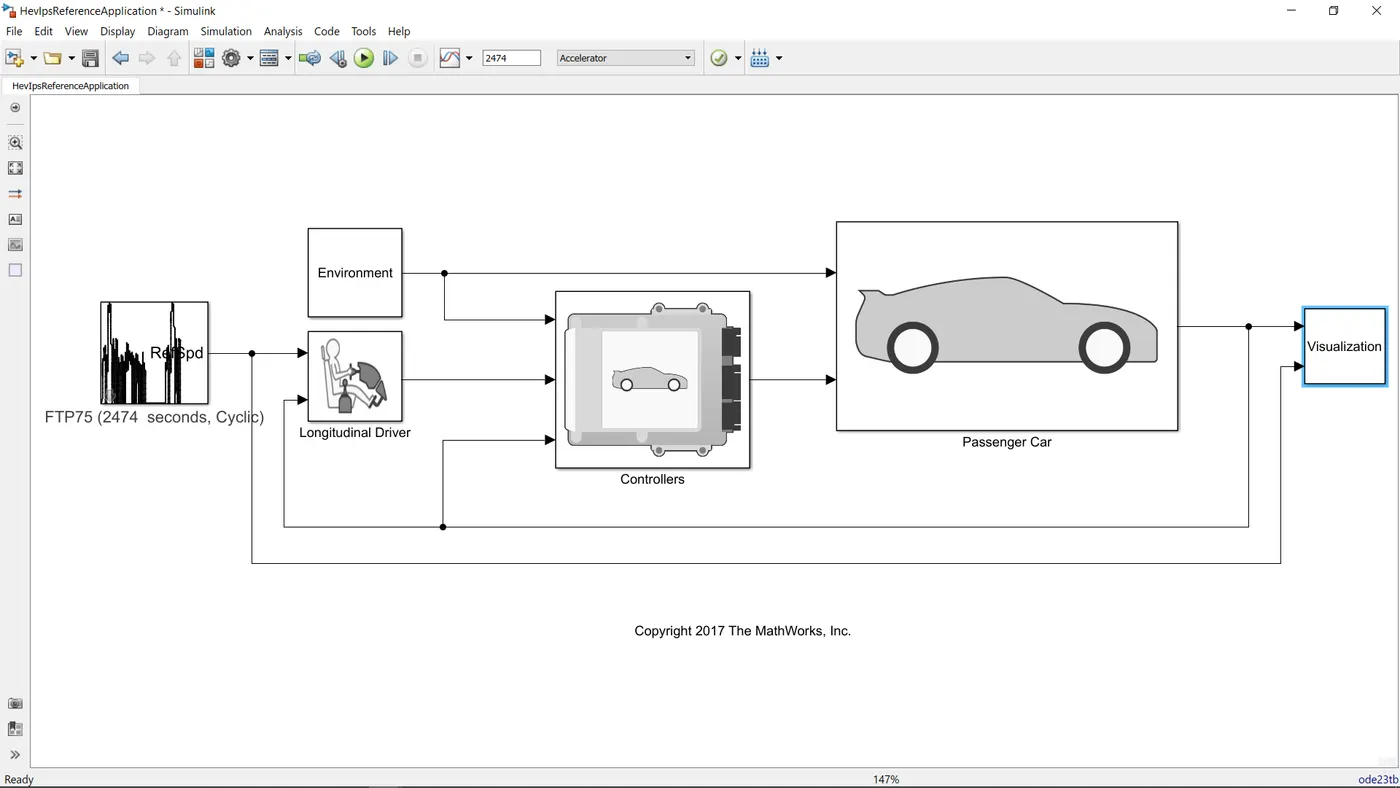
HEV Simulation 1 :-
Now, we will select the WOT drive cycle for WOT condition using drive cycle source
We will change the WOT Parameters for our desired output as shown below.
The Total cycle time = 100 seconds
The Top speed of this cycle = 80 mph
Time to start deceleration = 50seconds
The Grade angle = 0 degrees
The wind velocity = 0 m/s
Result :-
Plot 1 (Velocity of the vehicle with respect to the Drive cycle data with the Time scale on the x axis) :-
The acceleration time to reach 80 mph = 16.7 seconds (WOT Condition)
The deceleration time from 80 to minimum = 6.2 seconds
Plot 2 (The changes in speed of the Engine,motor and Generator in Rpm) :-
Peak Engine speed = 4780 Rpm
Peak Motor speed = 9497 Rpm
Peak Generator speed = 13690 Rpm
Plot 3 (Torque characteristics and its changes of engine,motor and generator in (Nm)) :-
Peak Engine torque = 138.7 Nm
Peak Motor torque = 206.7 Nm
Peak Generator torque = 42.2 Nm
Plot 4 (Battery Current values (A) and its changes for various acceleration inputs) :-
The peak current discharge from the battery = 163.5 A
The peak current charging to the battery = - 150.86 A
Plot 5 (Battery state of charge SOC (%) ) :-
The state of charge decreased from 60% to 39.8% of charge in a time period of 49.3 seconds in WOT condition.
Plot 6 (Fuel Economy as Mile per Gallons) :-
The maximum miles that the car can run per gallon of fuel equivalent = 46 Miles.
HEV Simulation 2 :-
The simulation is done for Hybrid electric vehicle with Wide open Throttle Drive cycle.
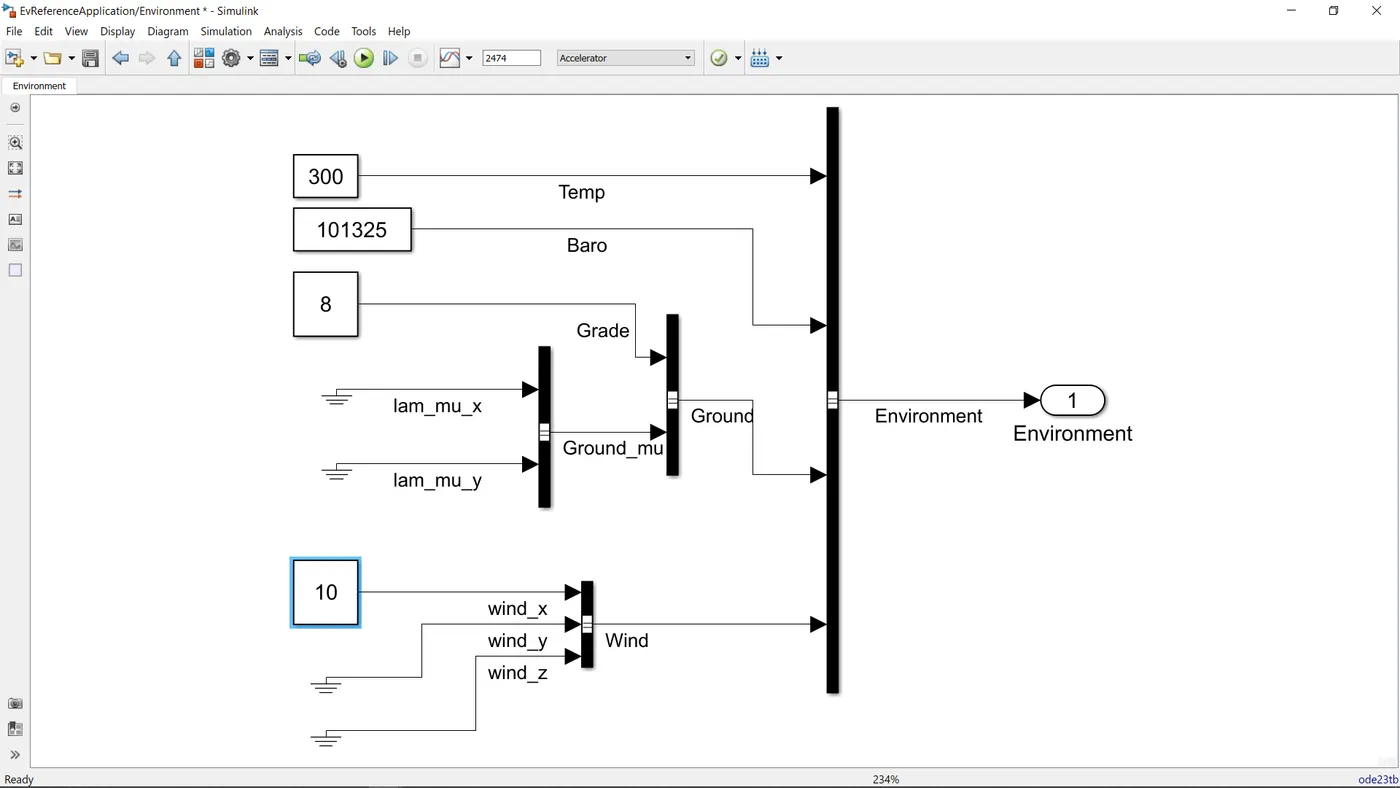
The Total cycle time = 100 seconds
The Top speed of this cycle = 80 mph
Time to start deceleration = 50 seconds
The Grade angle = 8 Degrees
The wind velocity = 10 m/s
Results:-
Plot 1 (Velocity of the vehicle with respect to the Drive cycle data with the Time scale on the x axis) :-
The acceleration time to reach 67.2 mph = 44.5 seconds (WOT Condition)
The deceleration time from 80 to minimum = 5.06 seconds
Plot 2 (The changes in speed of the Engine,motor and Generator in Rpm) :-
Peak Engine speed = 4676 Rpm
Peak Motor speed = 8103.5 Rpm
Peak Generator speed = 12858.5 Rpm
Plot 3 (Torque characteristics and its changes of engine,motor and generator in (Nm)) :-
Peak Engine torque = 139.6 Nm
Peak Motor torque = 206.4 Nm
Peak Generator torque = 48.2 Nm
Plot 4 (Battery Current values (A) and its changes for various acceleration inputs) :-
The peak current discharge from the battery = 167.6 A
The peak current charging to the battery = - 152.46 A
Plot 5 (Battery state of charge SOC (%) ) :-
The state of charge decreased from 60% to 25.98% of charge in a time period of 49.3 seconds in WOT condition.
Plot 6 (Fuel Economy as Mile per Gallons) :-
The maximum miles that the car can run per gallon of fuel equivalent = 17.93 Miles.
PURE ELECTRIC VEHICLE :-
A battery electric vehicle (BEV), pure electric vehicle, only-electric vehicle or all-electric vehicle is a type of electric vehicle (EV) that exclusively uses chemical energy stored in rechargeable battery packs, with no secondary source of propulsion (e.g. hydrogen fuel cell, internal combustion engine, etc.). BEVs use electric motors and motor controllers instead of internal combustion engines (ICEs) for propulsion. They derive all power from battery packs and thus have no internal combustion engine, fuel cell, or fuel tank. BEVs include – but are not limited to – motorcycles, bicycles, scooters, skateboards, railcars, watercraft, forklifts, buses, trucks, and cars.
The concept of battery electric vehicles is to use charged batteries on board vehicles for propulsion. Battery electric cars are becoming more and more attractive with the higher oil prices and the advancement of new battery technology (Lithium Ion) that have higher power and energy density (i.e., greater possible acceleration and more range with fewer batteries).[10] compared to older battery types such as lead-acid batteries. Lithium-ion batteries for example now have an energy density of 0.9–2.63 MJ/L whereas lead-acid batteries had an energy density of 0.36 MJ/L (so 2.5 to 7.3x higher). There is still a long way to go if comparing it to petroleum-based fuels and biofuels however (gasoline having an energy density of 34.2 MJ/L -38x to 12.92x higher- and ethanol having an energy of 24 MJ/L -26x to 9.12x higher-).
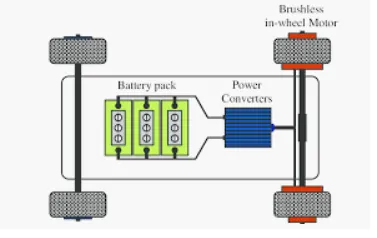
In the powertrain blockset we will select the Electric vehicle and this is the simulink model and Input the desired Parameters as our wish and Simulate the HEV and we change the drive cycle to WOT Drive cycle to have WOT conditions.
Now we will comparing both the Pure electric and Hybric electric vehicle with the given conditions in a simulation to observe the behaviour of both the type.
Simulation :-
The simulation is done for Electric vehicle with Wide open Throttle Drive cycle.
The Total cycle time = 100 seconds
The Top speed of this cycle = 80 mph
Time to start deceleration = 50 seconds
The Grade angle = 8 Degrees
The wind velocity = 10 m/s.
Results:-
Plot 1 (Velocity of the vehicle with respect to the Drive cycle data with the Time scale on the x axis) :-
The acceleration time to reach 58.9 mph = 48.8 seconds (WOT Condition)
The deceleration time from 80 to minimum = 4.63 seconds
Plot 2 (The changes in speed of the motor in Rpm) :-
Peak Motor speed = 6254 Rpm
Plot 3 (Torque characteristics and its changes motor in (Nm)) :-
Peak Motor torque = 280 Nm
Plot 4 (Battery Current values (A) and its changes for various acceleration inputs) :-
The peak current discharge from the battery = 225.8 A
The peak current charging to the battery = - 163.7 A
Plot 5 (Battery state of charge SOC (%) ) :-
The state of charge decreased from 80% to 75.5% of charge in a time period of 49 seconds in WOT condition.
Plot 6 (Fuel Economy as Mile per Gallons) :-
Here there is no fuel in pure electric vehicle however this gives equivalent battery enegy required that of the fuel energy,and calculates the Fuel efficiency.
The maximum miles that the car can run per gallon of fuel equivalent = 21.45 Miles.
OBSERVATIONS ( Comparison of Pure electric vs Hybrid vehicle with same load conditions) :-
- The electric vehicle when compared with hybrid electric vehicle with the same environmental in WOT conditions results in less top speed achievement .
- The electric vehicle produces more values of Motor speed and motor torque compared to the hybrid vehicle's motor alone, but hybrid vehicle when it combines the torque of both motor and it's engine it is higher than the electric vehicle's torque.
- This is responsible to pull the Hybrid car at higher top speed compared to the pure electric.
- As the pure electric car here uses Lithium-ion battery compared to the Nickel metal hydride battery the discharging capacity and the rate of charging is higher in the pure electric car.
- As it is able to discharge in a fast rate the motor can produce high amount of torque instantly compared to the hybrid vehicle.
- The state of charge shows the battery efficiency of the pure electric to be higher than the hybrid vehicle and this is also due to the battery type used in these cars.
- The efficiency of the Electric car is higher than the hybrid car which is evident.
- Electric vehicle produces zero emissions whereas the hybrid one's produce waste gas emissions.