Week 8 - Simulating Cyclone separator with Discrete Phase Modelling
Aim: To perform analysis on cyclone separator and calculate the separation efficiency and pressure drop.
Objective:
- To write a few words about any four empirical models used to calculate the cyclone separator efficiency.
- To perform an analysis on a given cyclone separator model by varying the particle diameter from 1 μm to 5 μm and calculate the separation efficiency in each case. Discuss the results. [Use both the velocity's as 3m/sec.]
- To perform an analysis on a given cyclone separator model by varying the particle velocity from 1 m/sec to 5 m/sec and calculate the separation efficiency and pressure drop in each case. Discuss the results. [Use particle diameter size as 5 μm for all cases & keep flow velocity same as particle velocity]
Introduction:
Cylclone seperator:
- Cyclones are devices that employ a centrifugal force generated by spinning gas stream to seperate particles from the carrier gas.
- The simple design and low cost of operation an maintanance make them ideal for use as pre-cleaner for expensive final control devices.
- Cyclones are well suited for high temperature and pressure conditions because of their rugged design and flexible component materials.
- Cyclone collection effiencies can reach upto 99% for particles 5micro meter and above.
- Cyclones are used to remove large particles from air for pollution control.
How it works:
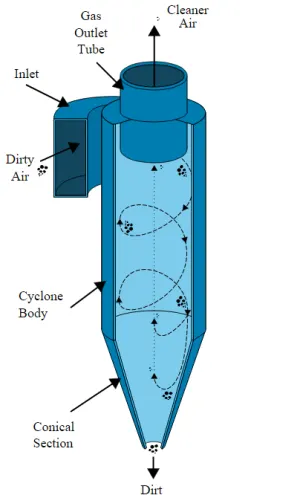
- Cyclone separators work much like a centrifuge, but with a continuous feed of dirty air.
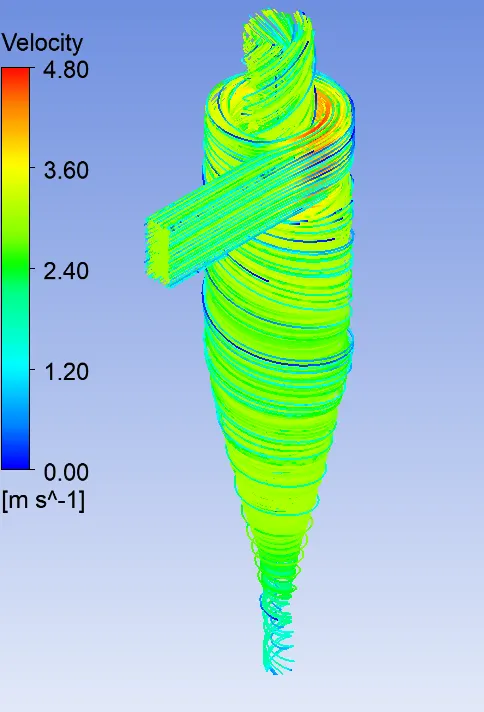
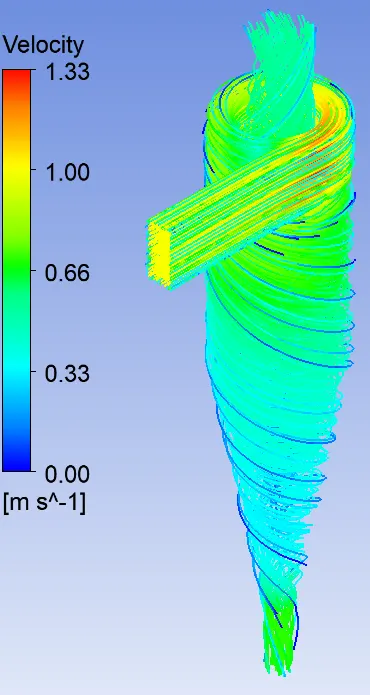
- In a cyclone separator, dirty flue gas is fed into a chamber. The inside of the chamber creates a spiral vortex, similar to a tornado.
- This spiral formation and the separation is shown in Figure below.
- The lighter components of this gas have less inertia, so it is easier for them to be influenced by the vortex and travel up it.
- Contrarily, larger components of particulate matter have more inertia and are not as easily influenced by the vortex.
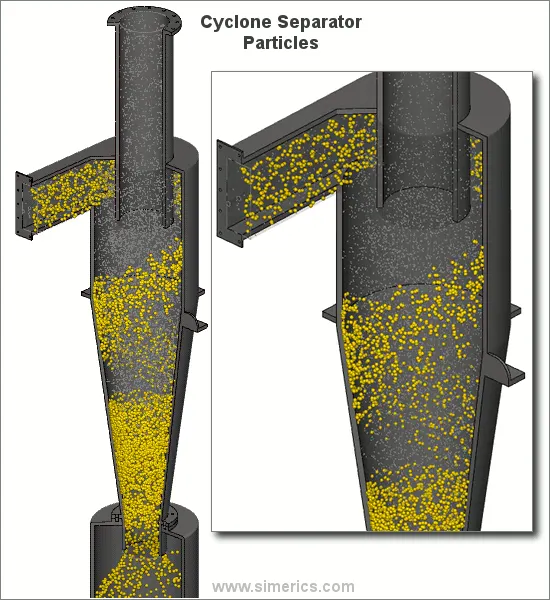
- Since these larger particles have difficulty following the high-speed spiral motion of the gas and the vortex, the particles hit the inside walls of the container and drop down into a collection hopper.
- These chambers are shaped like an upside-down cone to promote the collection of these particles at the bottom of the container. The cleaned flue gas escapes out the top of the chamber.
Cyclone efficiency empirical models:
1.Lozia and Leith Model:
- It is a modified version of Barth Model, which is based on force balance.
- The model assumes that a particle carried by the vortex endueres the influence of two forces: a centrifugal force and flow resistance.
2.Koch and Licht Model:
-
Koch and Licht collection theory recognized the inherently turbulent nature of cyclones and the distribution of gas residence times within the cyclone.
-
Koch and Licht described particle motion in the entry and collection regions with the additional following assumptions:1.The tangential velocity of a particle is equal to the tangential velocity of the gas flow, i.e. there is no slip in the tangential direction between the particle and the gas.2.The tangential velocity is related to the radius of cyclone by: `uR^n =`constant
3.Li and Wang Model:
- The Li and Wang model includes particle bounce or reentrainment and turbulent diffusion at the cyclone wall.
- A twodimensional analytical expression of particle distribution in the cyclone is obtained. Li and Wang model was developed basedon the following assumptions:
- Radial particle velocity and radial concentration profiles are not constant for uncollected particles within the cycle.
4. Lapple Model :
-
Lapple model was developed based on force balance without considering the flow resistance.
-
Lapple assumed that a particle entering the cyclone is evenly distributed across the inlet opening.
-
The particle that travels from inlet half width to the wall in the cyclone is collected with 50% efficiency
Methodology used:
Descrete phase modeling:
- Discrete Phase Model is a subsection to Multiphase flows.
- A discrete phase model (DPM) is used when the aim is to investigate the behavior of the particles from a Lagrangian view and a discrete perspective.
- The difference between the Lagrangian and the Eulerian view is that fluid behavior in the Lagrangian view is examined based on particle tracking of a particulate flow; Whereas fluid behavior is considered in the Eulerian view based on the assumption of a finite volume element in the fluid flow path.
- In Discrete Phase Model, the continuous phase is solved using Navier-Stokes equations.
- At the same time, the discrete phase is simulated by tracking a large number of particles, bubbles, or droplets passing through the calculated continuous flow field.
- It should be noted that the discrete phase can exchange momentum, mass, and energy with the continuous phase.
- This method can be made much simpler by ignoring the interaction of particles (as well as droplets and bubbles) with each other. Of course, this can happen when the discrete phase, even with a large mass, has a much smaller volume (less than 10%) than the continuous phase.
- After each iteration of the continuous phase calculations, the particle paths (as well as bubbles or droplets) are calculated and determined separately.
There are tow types of coupling between continous medium and descrete phase:
- One way coupling:
- The fluid phase influences the discrete phase via drag and turbulance
- The discrete phase has no influence on the contunous phase
2.Two way coupling:
- The continous phase influences the discrete phase via drag and turbulance
- The discrete phase influeces the continuous phase vis source terms of mass,moentum and energy
Boundary layers of DPM used in our simulation:
- Reflect: The particles rebounds off the boundary.
- Trap: The trajectory calculations are trminated and the particles is considered trap
- Escape: The particles is reported as escaped when it interacts with this boundary
CFD (Comutational fluid Dynamics) setup:
1.Geometry:
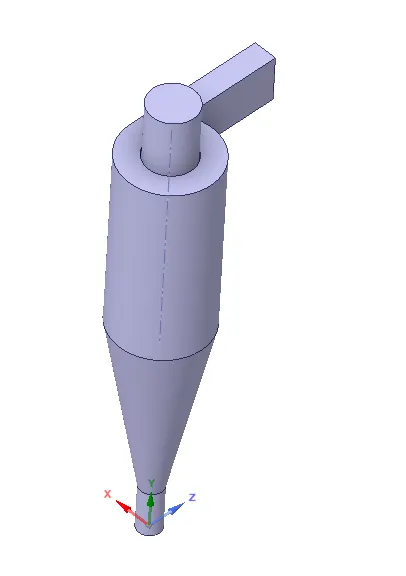
- Import the cyclone seperator step file into space claim.
- Extract fluid volume by selecting the edges
- Prepare > volume extract > Select edge
- Supress the solid part for physics, which we dont need in the simulation
2.Meshing:
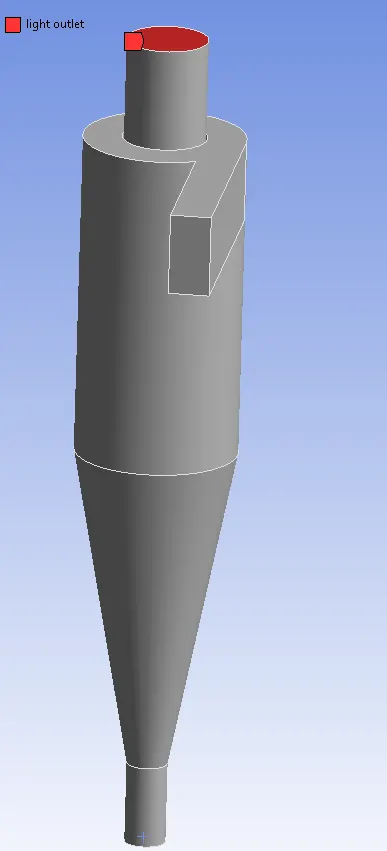
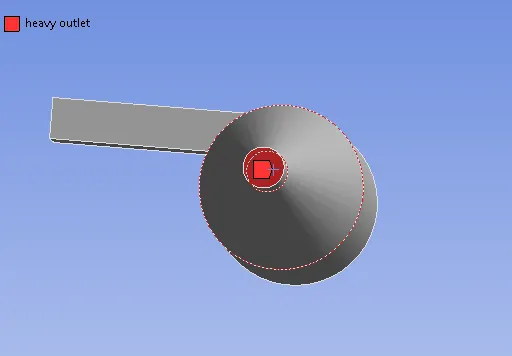
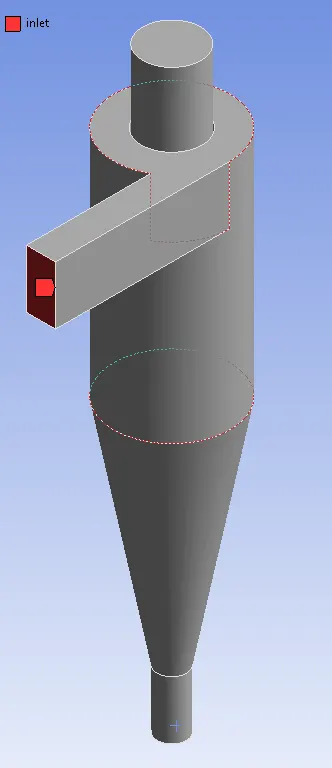
- Name the inlets,two outlets as heavy outlet at bottom to collect heavy particls and light outlet for the cleaned gas to escape.
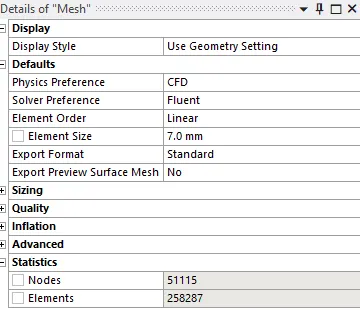
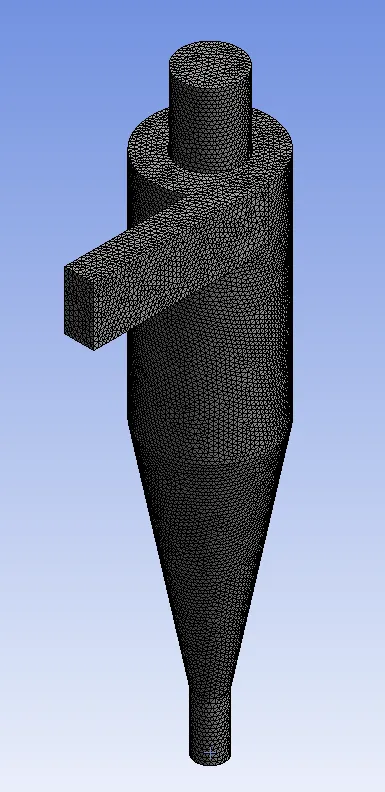
- Mesh with taking global element size as 7mm
Naming:
Mesh detail:
Mesh:
Setup:
Solver:
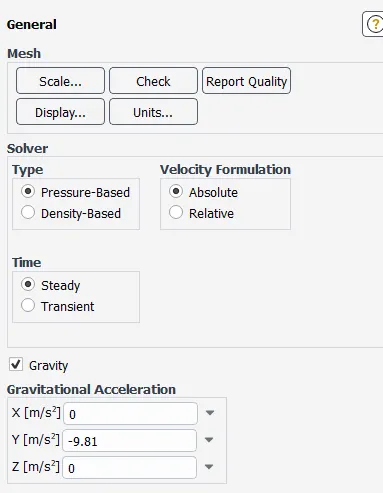
- Pressure based
- Steady
- Gravity enabled in -ve y direction
Discrete phase model (DPM):
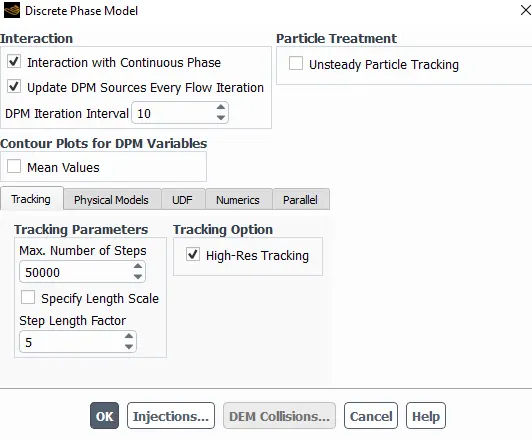
- Turn on DPM and select "Interaction with continous phase" and "Update DPM Sources Every Flow Iteration"
- In trackin parameter set max. number of steps as 50,000 which is by default.
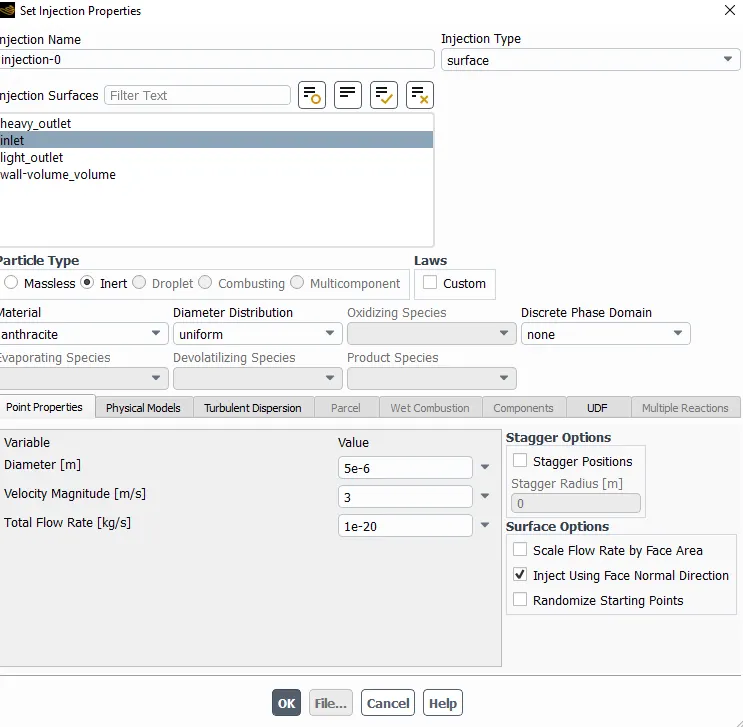
- Select injection and create
- Create injection at inlet surface with: anthracite particle and inlet velocity normal to inlet as 3 m/s.
- Particle size : 5 micro meters.
Viscous model:
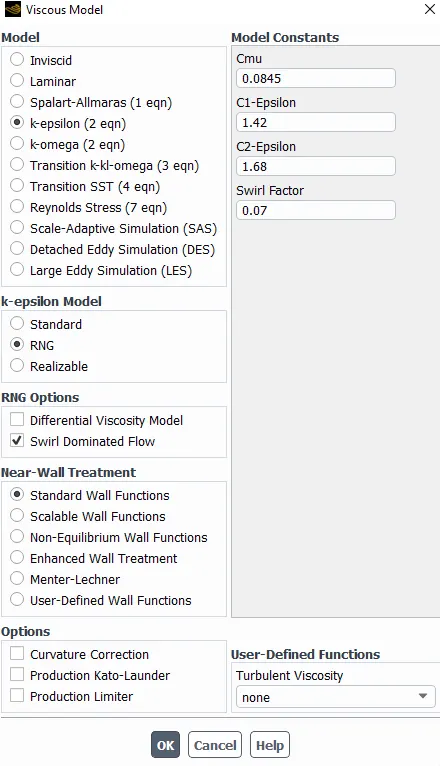
- k-epsilon
- RNG
- Swirl dominated flow
- Standard wall functions
Boundary conditions:
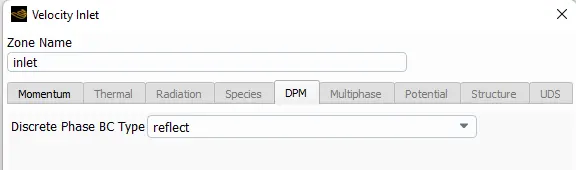
Inlet:
- Velocity-inlet
- DPM : Reflect
- Inlet velocity : 3m/s
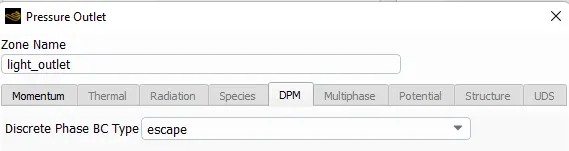
Light outlet:
- Pressure-outlet
- DPM : Escape
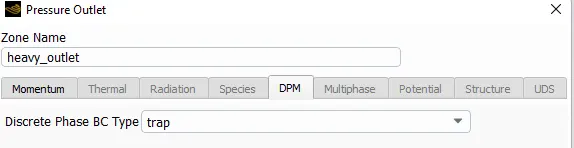
Heavy outlet:
- Pressure-outlet
- DPM : Trap
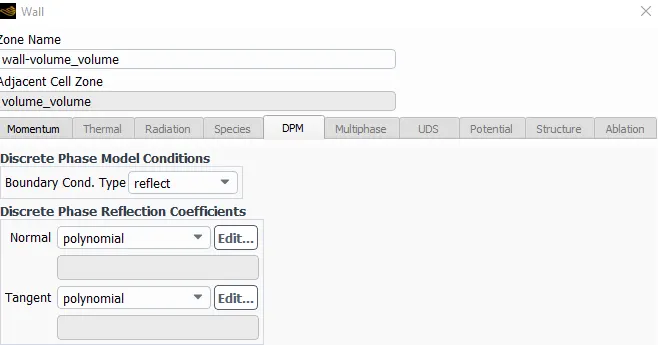
Wall:
- Wall
- DPM : Refelct
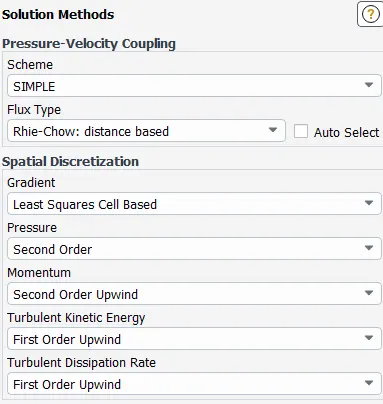
Solution method:
Initialization:
- Standard initialization
- Compute from inlet
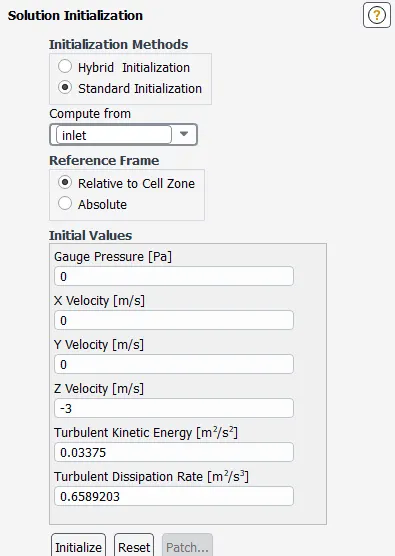
- Run the simulation for 650 Iterations.
Results:
Part 1:
- Run the simulation with 3m/s velocity for both inlet and DPM.
- Vary the particle size from 1`mu`meter to 5`mu`meter
Case 1:
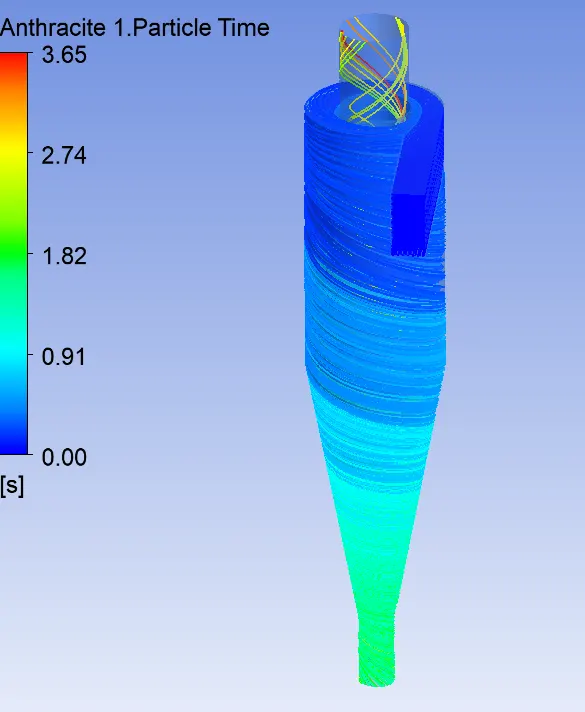
particle size = 1`mu`meter
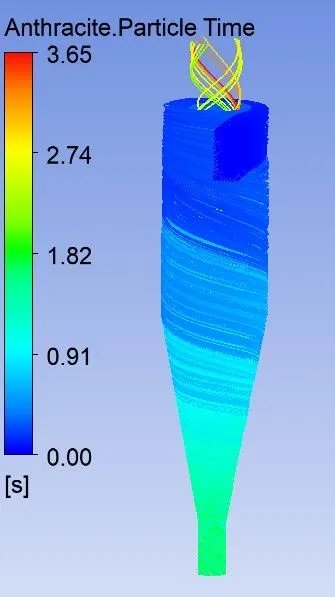
Particle time plot:
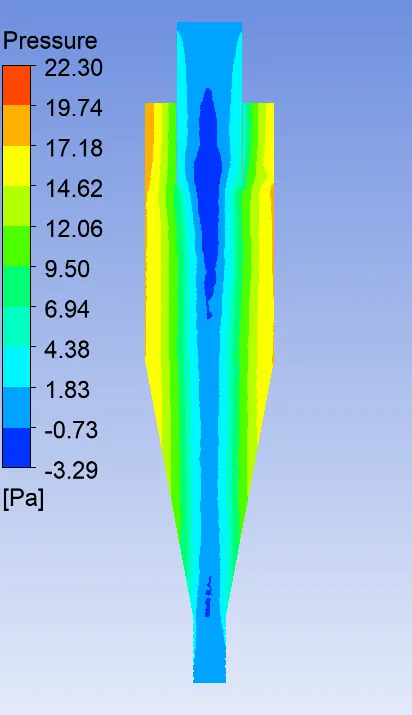
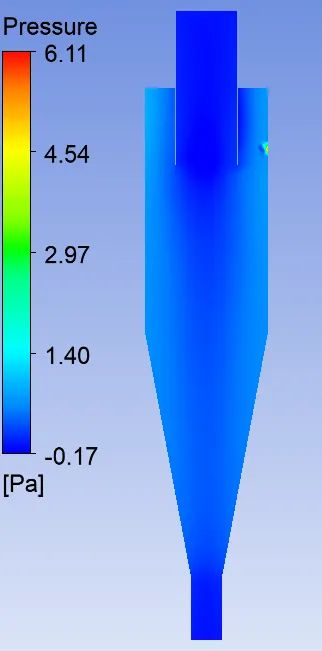
Pressure plot:
Streamline plot:
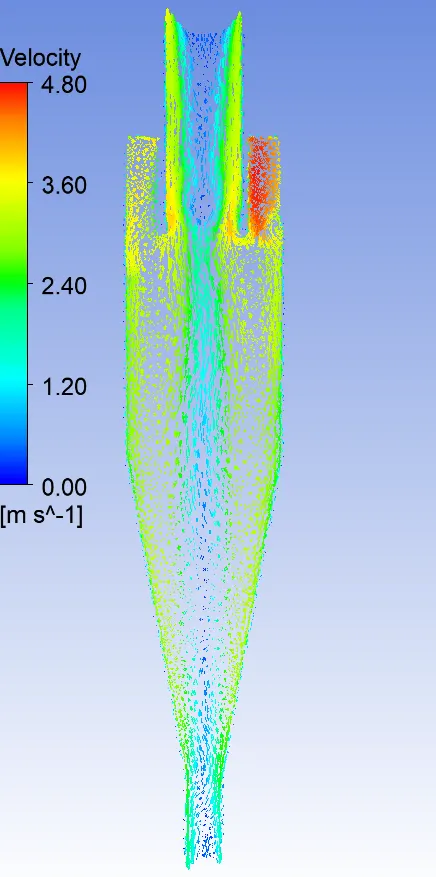
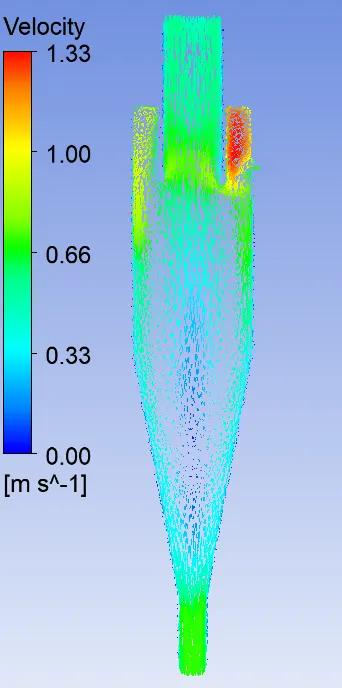
Vector plot:
Particles trapped:

efficiency:
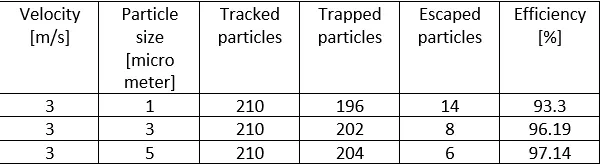
Cyclone efficiency = Trapped particles/Tracked particles
=`(196/210)*100`
= 93.3 %
Case 2:
particle size = 3`mu`meter
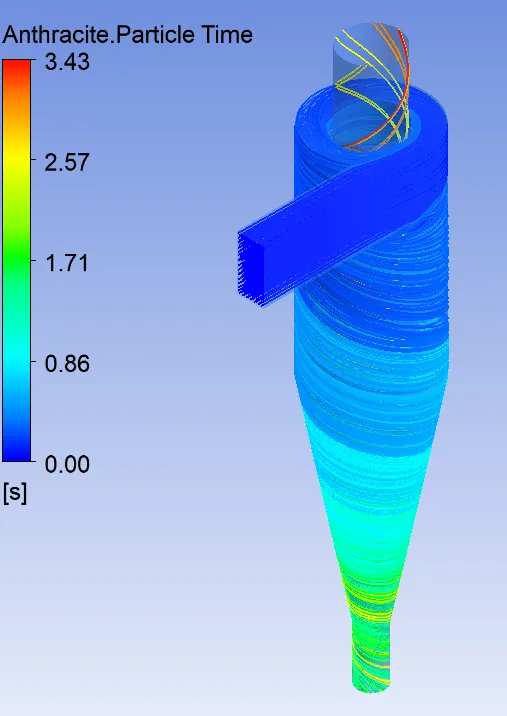
Particle time plot:
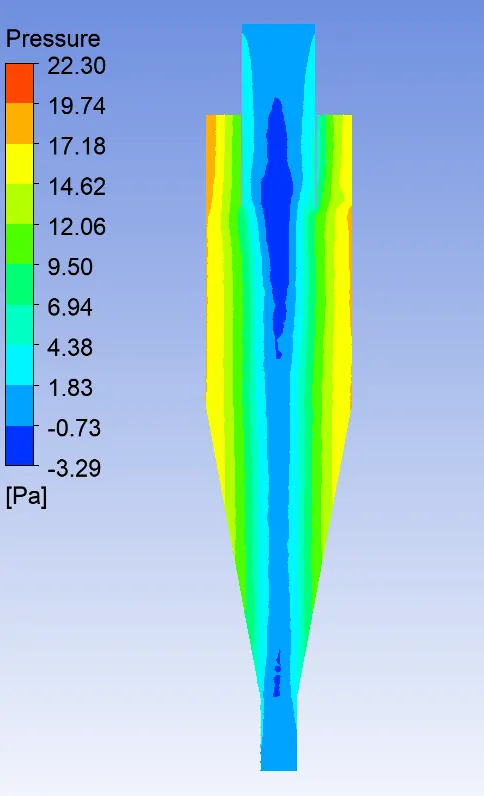
Pressure plot:
Streamline plot:
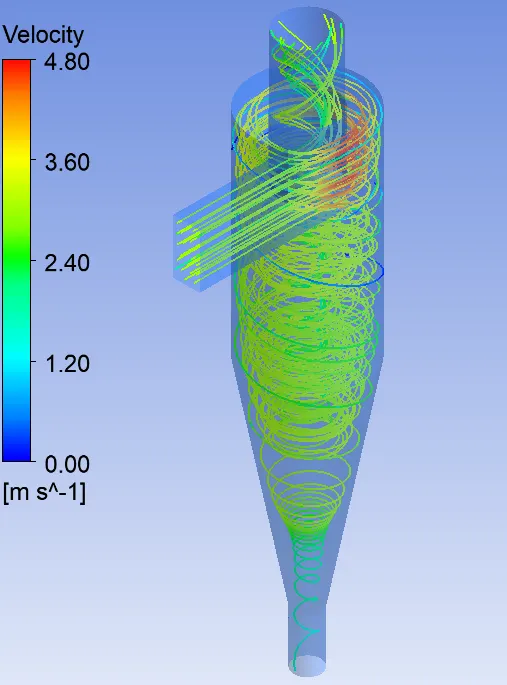
Vector plot:
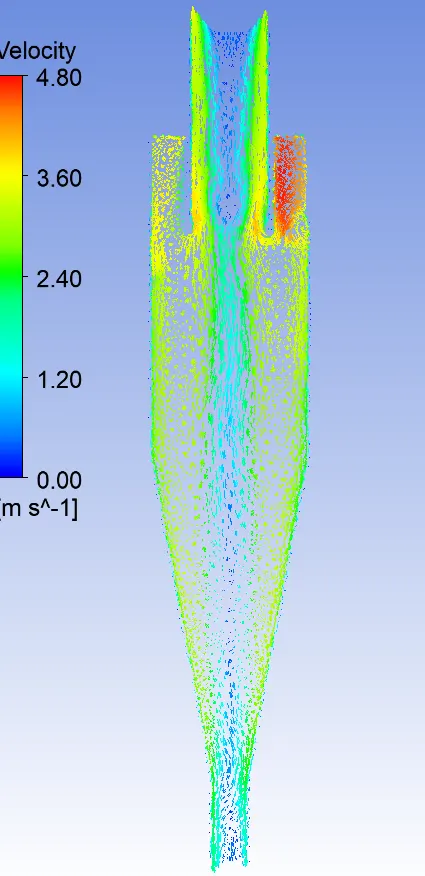
Particles trapped:

efficiency:
Cyclone efficiency = Trapped particles/Tracked particles
=`(202/210)*100`
= 96.19 %
Case 3:
particle size = 5`mu`meter
Particle time plot:
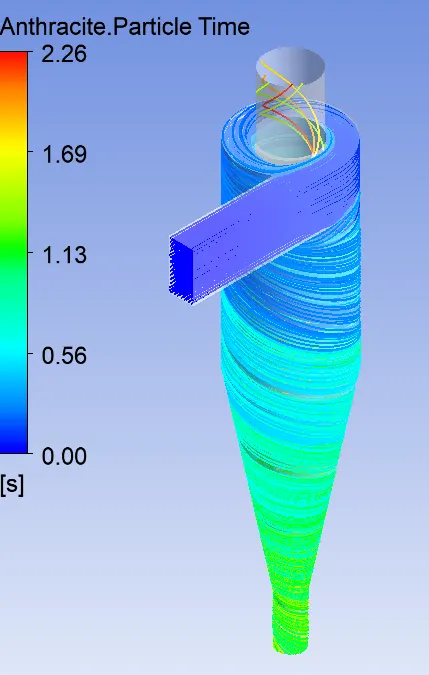
Pressure plot:
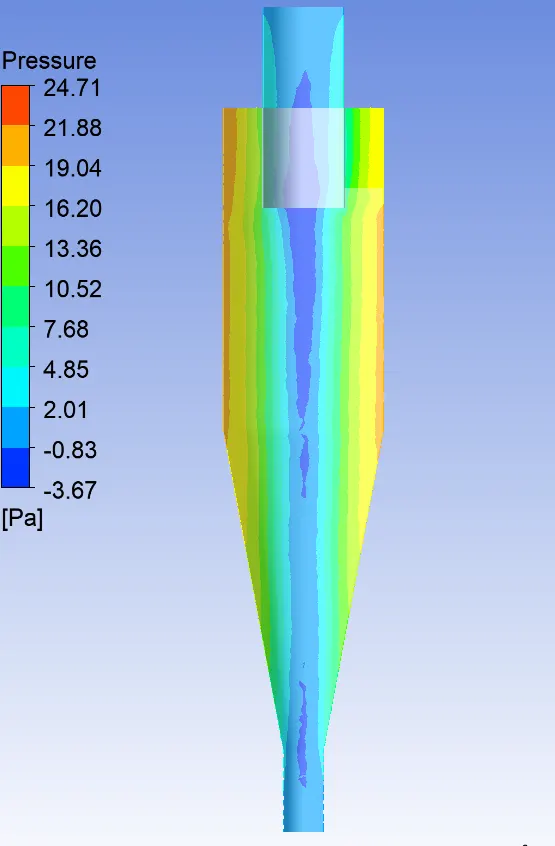
Streamline plot:
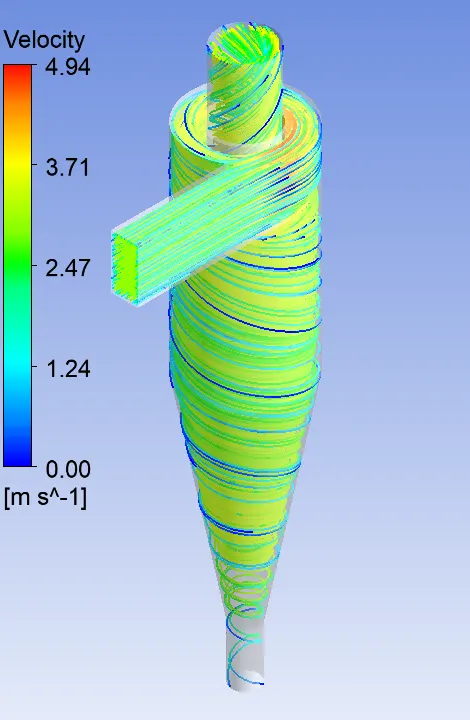
Vector plot:
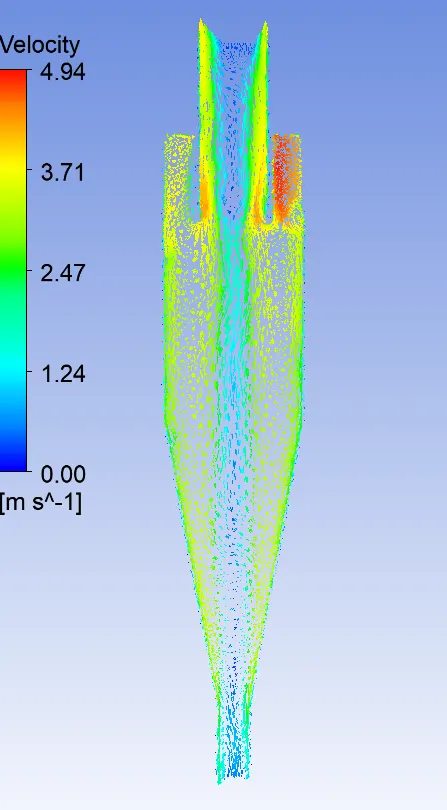
Particles trapped:

efficiency:
Cyclone efficiency = Trapped particles/Tracked particles
=`(206/210)*100`
=98.09 %
Table comparing efficiency of cyclone seperator for different particle sizes.
Part 2:
- Keep particle diameter as 5`mu`meter
- Vary velocity from 1m/s to 5m/s
Case 1:
Velocity : 1m/s
Particle time plot:
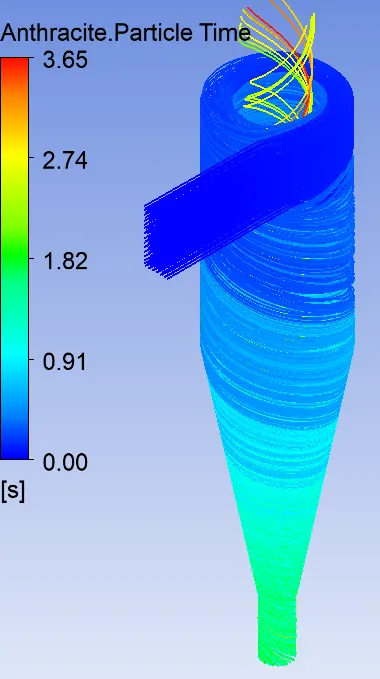
Pressure plot:
Streamline plot:
Vector plot:
Particles trapped:

efficiency:
Cyclone efficiency = Trapped particles/Tracked particles
=`(168/210)*100`
=80 %
Case 2:
Velocity : 2m/s
Particle time plot:
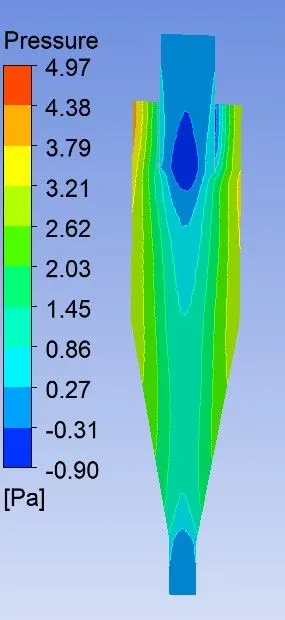
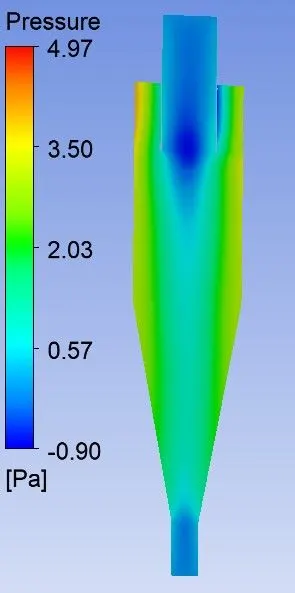
Pressure plot:
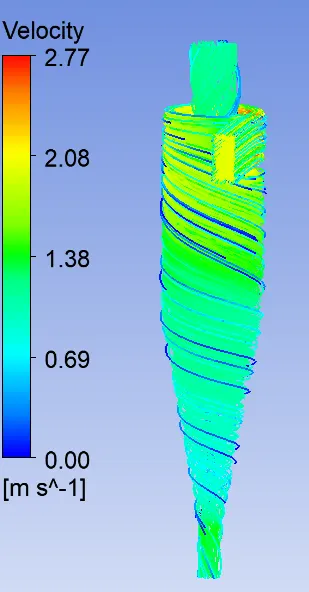
Streamline plot:
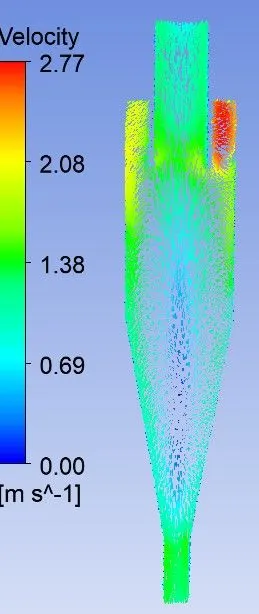
Vector plot:
Particles trapped:

efficiency:
Cyclone efficiency = Trapped particles/Tracked particles
=`(194/210)*100`
=92.38 %
Case 3:
Velocity : 3m/s
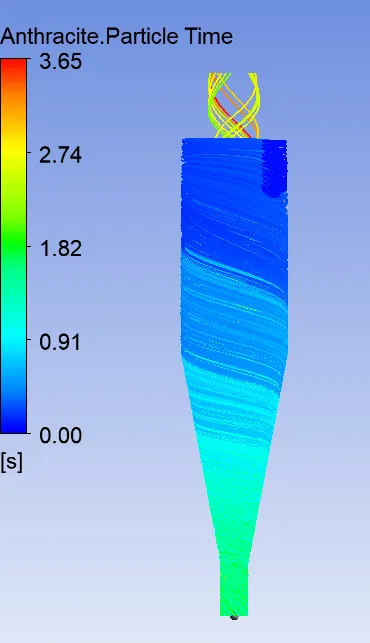
Particle time plot:
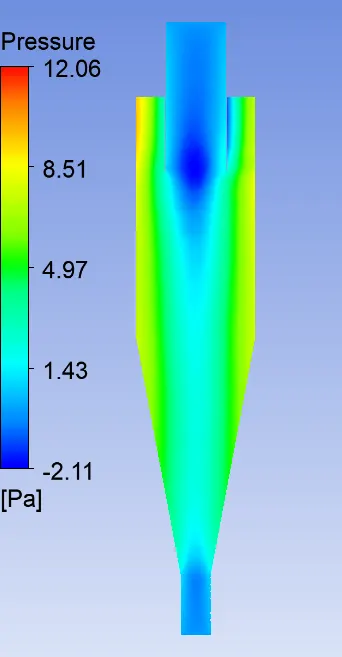
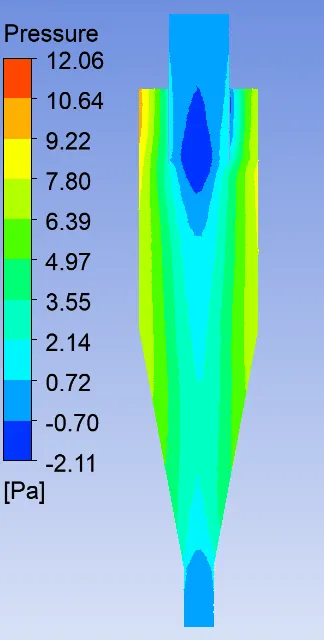
Pressure plot:
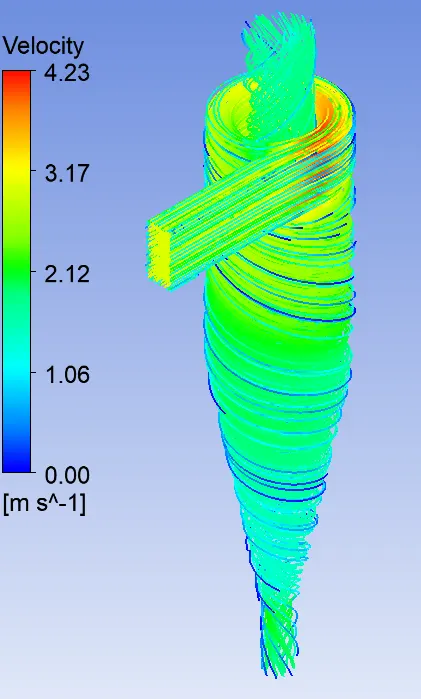
Streamline plot:
Vector plot:
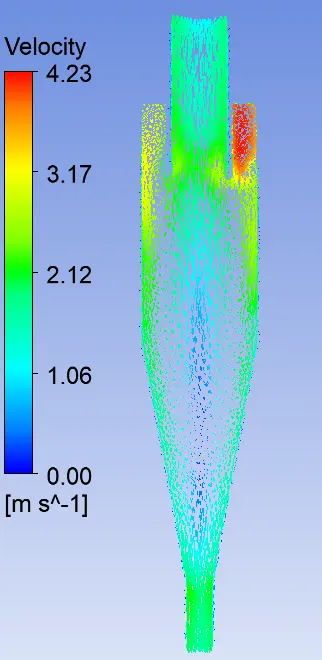
Particles trapped:
efficiency:
Cyclone efficiency = Trapped particles/Tracked particles
=`(206/210)*100`
=98.09 %
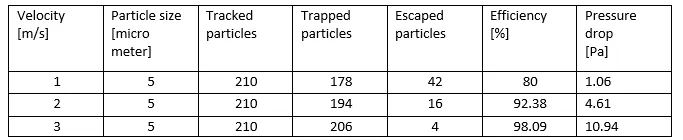
Table comparing efficiency and pressure drop of cyclone seperator for different inlet velocity with particle size as 5 `mu`meter.
Results and explanation:
Pressure:
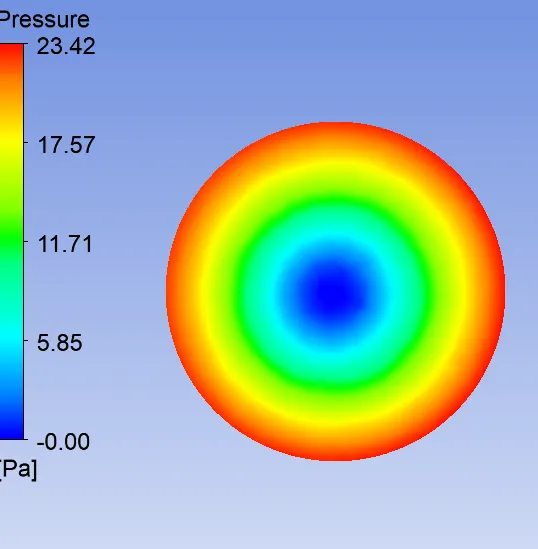
- Pressure is highest at the walls and it decreases at the center of vortex where velocities are high.
- We can see that vaccum is created at the center
- This vaccum increases with increase in velcoity, with increase in velocity vortex strength increases.
Secondary circulations:
-
Secondary circulation can deteriorate the performance of cyclone.
-
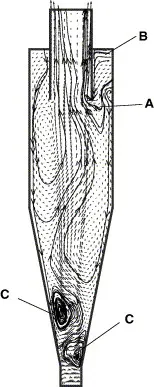
There are three regions where the secondary circulation formed by axial velocity and radial velocity occurs, as shown at points A, B and C in figure below.
-
Firstly, at point A, because of the collision among gas, part of gas flows inward and exhausts out quickly from the region right under the vortex finder, which forms a short-circuiting flow.
-
Secondly, at point B, there is a slow laminar flow layer below the roof of the cyclone where the gas flows to and hits the roof, and flows reversely toward the vortex finder since the pressure reaches a lower value than in the strong rotational flow.
-
This phenomenon is called the eddy flow. It can result in particles accumulating on the wall escaped from the vortex finder to the top, forming swilling dust ceiling, and decreasing the efficiency of separation.
-
Thirdly, at point C, because of the enlarging dust box and the friction from particles accumulating walls, the rotational velocity of gas entering the dust box will decrease.
-
Then the gas will turn back on the central line from dust box to cyclone body and mix with the following-up downward rotational flow, which causes intensive momentum transfer and energy loss. It is called eccentric circumfluence.
-
The damage of short-circuiting flow (A) and eddy flow (B) can be reduced by increasing the length of vortex finder in cyclone body. However, a longer vortex finder will result in a higher pressure drop in cyclone.
Conclusion:
Effect of inlet velocity on cyclone seperator :
- As the velocity of inlet increases the efficiency of cyclone seperator increases.
- As the velocity of inlet increases the pressure drop increases
Effect of particle size on cyclone seperator:
- As the size of the particle increases, more number of particles are trapped and this increaes the efficiency of the cyclone seperator