Week 4: Project - Transient simulation of flow over a throttle body
Objective
- Setup and run transient state simulation for flow over a throttle body.
- Post processes the results and show pressure and velocity contours.
- Show the plots for pressure, velocity, mass flow rate and total cell count.
- Calculations on how you calculate the end time for the simulation.
- Create an animation in which it throttle movement should be visible
Step Up
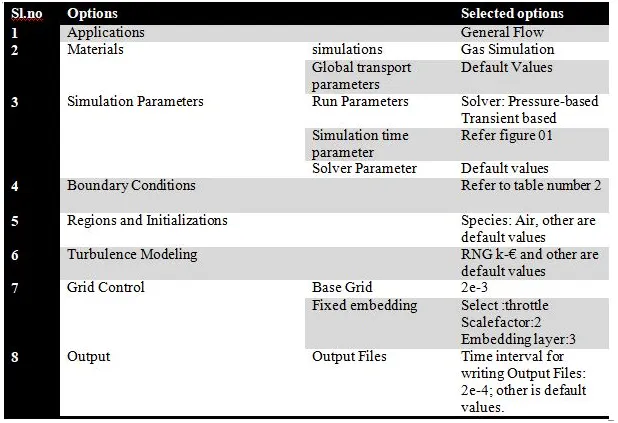
Table1
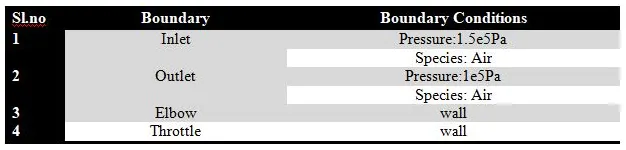
Table2
Simulation Parameters
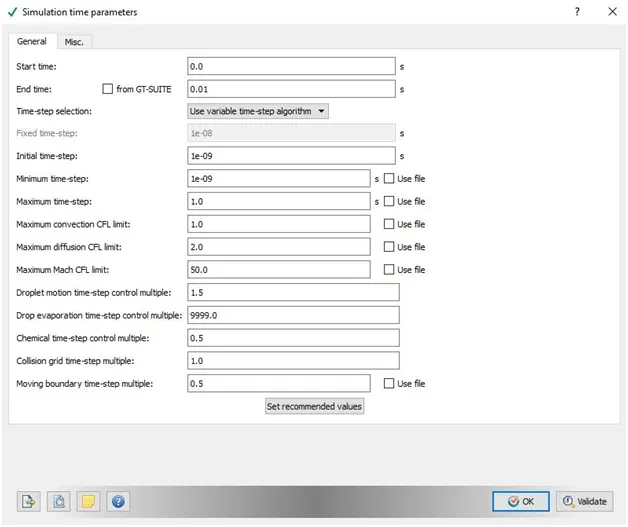
Simulation time parameter
Boundary Conditions
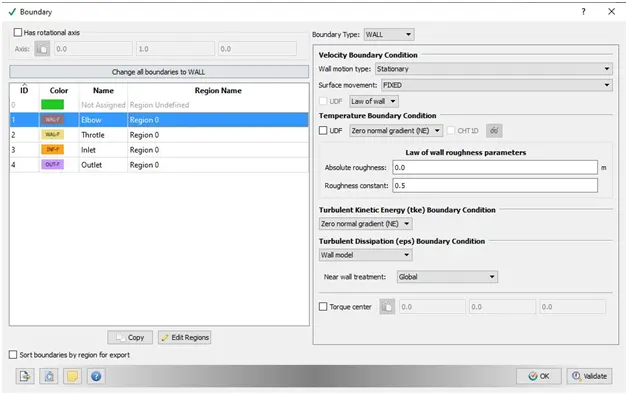
Elbow Conditions
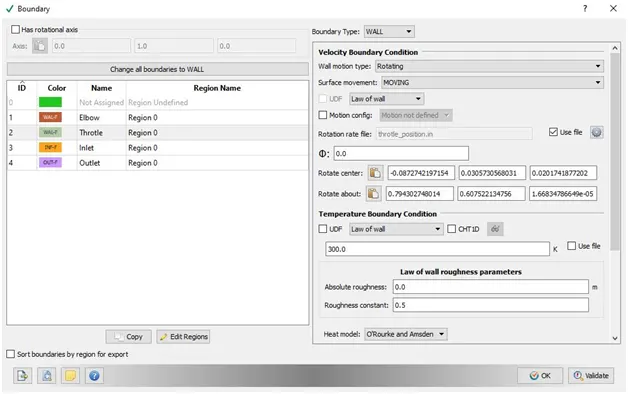
Throtle Condition
Rotate center and Rotate about center of the throtle shaft
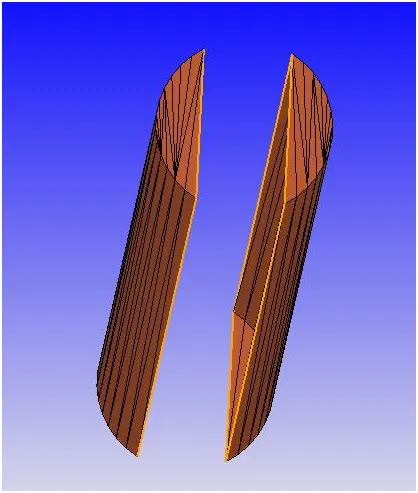
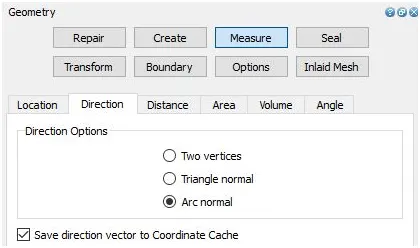
In geometry Dock- Measure-Driection-select Arc normal (select any three edges of the top face of the pin) to know the arc radius and arc normal which is pasted Throtle boundary conditions
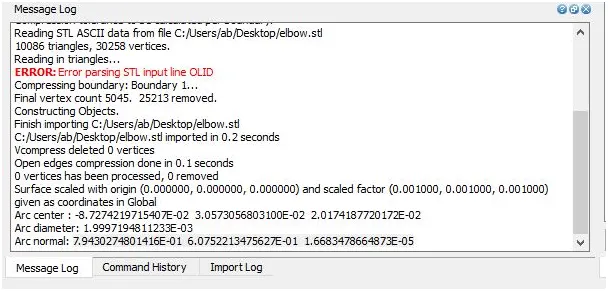
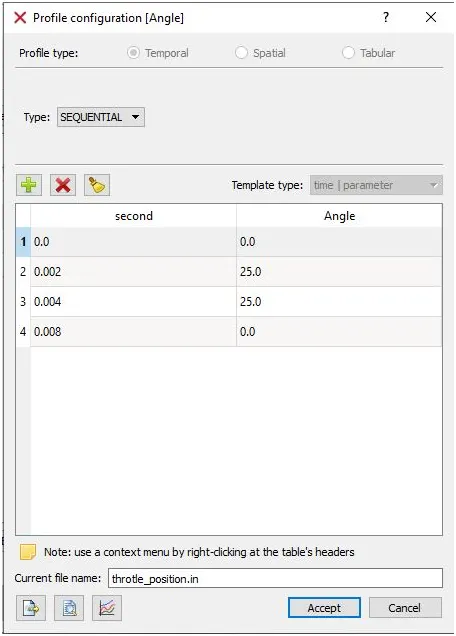
Then the moment of the throtle is mentioned
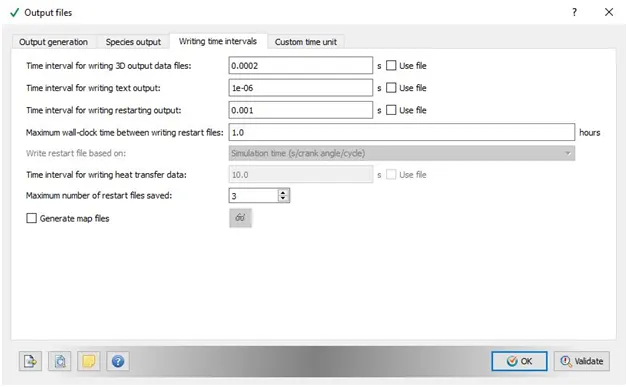
Output files
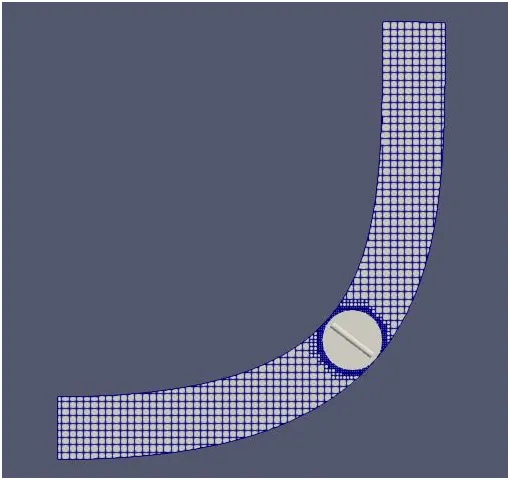
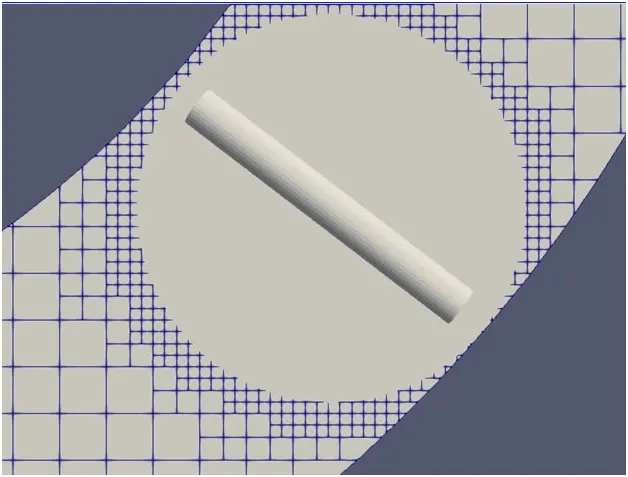
Meshing
End time Calculation
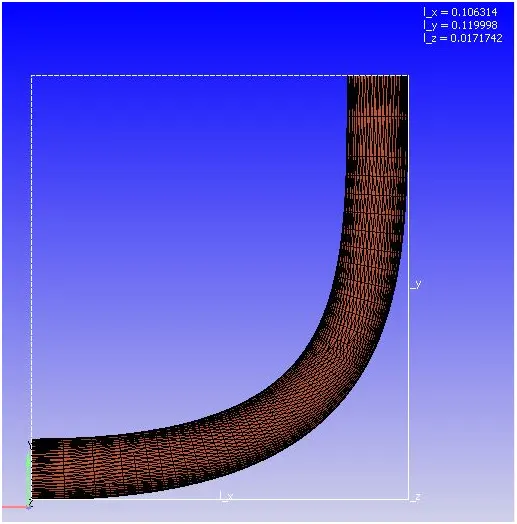
Distance/lenght of the pipe =0.2 approx(adding x,y axis)
steady state velocity =222m/s
now velocity=distance/time
therefore t(time)=distance/velocity
t=0.2/222=9.009*e-4 approx-1e-3
i.e it takes 1e-3 sec complete the fluid flow inside the elbow
Pressure contours
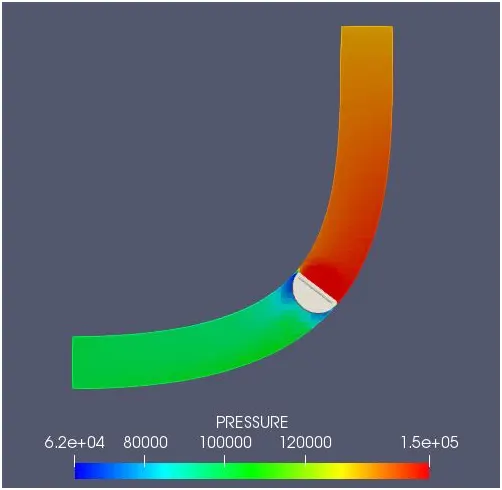
2ms
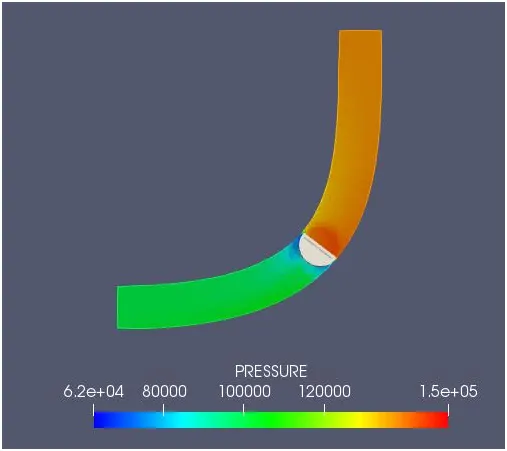
4ms
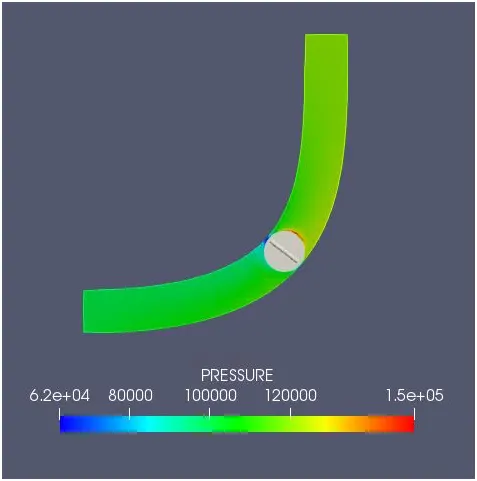
8ms
From both the cases the inlet pressure is much higher than the outlet pressure Their is the restriction of the throtle at 25deg at 2ms and 50 deg at 4ms,so pressure at the throtle region increases
Velocity Contour
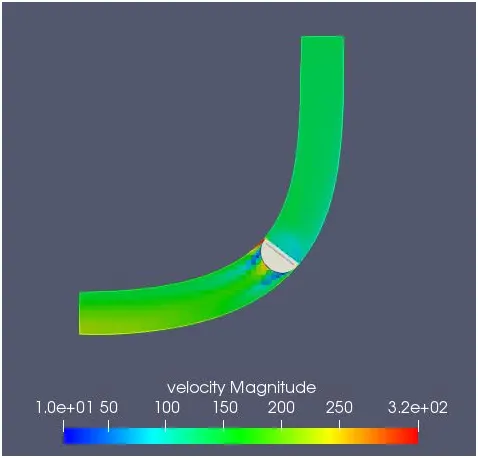
2ms
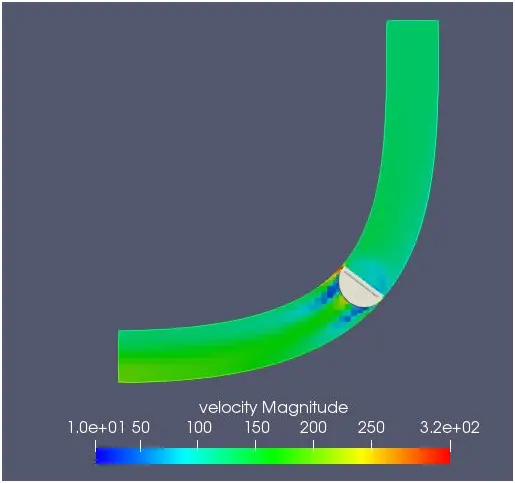
4ms
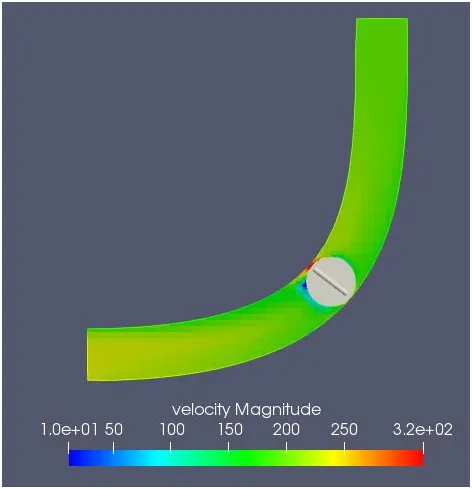
8ms
Their is sudden restriction of the throtle at 2ms and 4ms flow velocity decresease but as time proceeds (after 8ms) the fluid flows over the the throtle and the flow attains a higer velocity
Plots
Mass_flow_rate
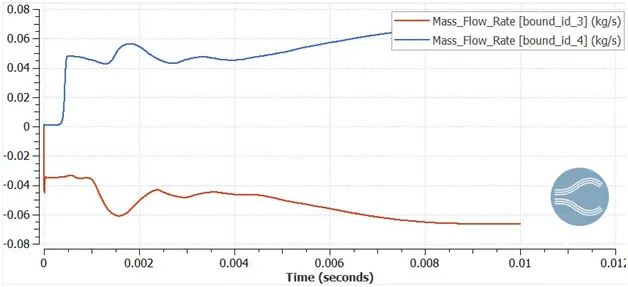
Average velocity
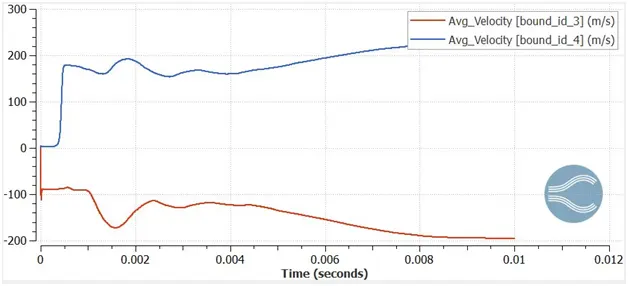
Both the mass_flow_rate and the velocity oscilates from 0 to 8ms due to the movement of the throtle after 8ms steady output is reached that is mass_flow_rate is 0.066kg/s and velocity is 224m/s
Total_Cells
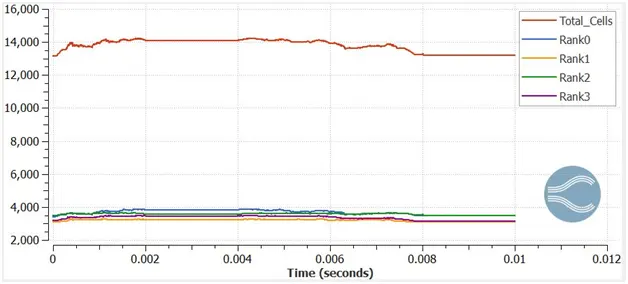
The cell count from zero to 8ms is not steady because of the varition of the meshing at the throtle (due to its movement from 0 to 8ms) after 8ms it comes to the original position therefore mesh would remain same all over the domain of the geometry ,so cells converges after 8ms
Static_Pressure
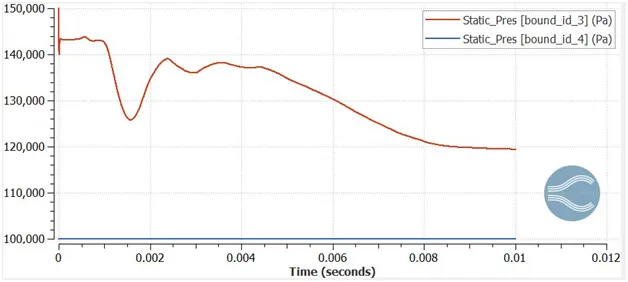
The pressure fluctuates from 0 to 8ms after that the inlet pressure converges
Animations
Moment of the throttle
Moment of the mesh with throttle
Velocity
Pressure
Conculsion
From the above observation we can conclude that there is fluctuation(0to8ms) in mass_flow_rate,avg_velocity,static pressure and total_cell_count due movement in the throtle,after 8ms sloution converges as the the throtle comes to the original position