Week 3 - External flow simulation over an Ahmed body.
Objectives
Q1. Describe Ahmed's body and its importance.
Q2. Explain the reason for the negative pressure in the wake region.
Q3. Explain the significance of the point of separation.
Expected Results:
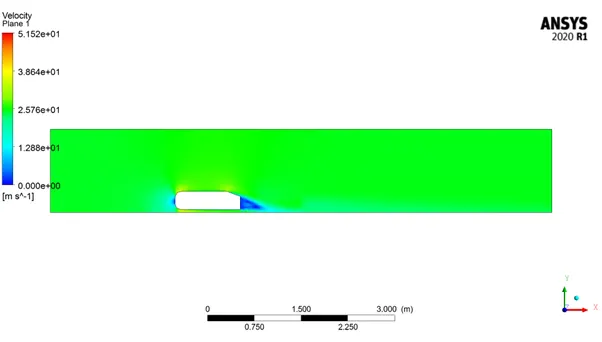
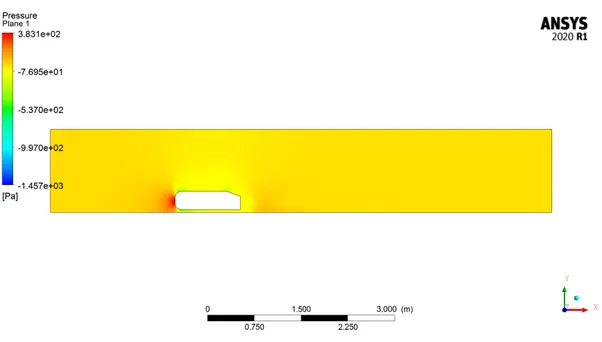
1. Velocity and pressure contours.
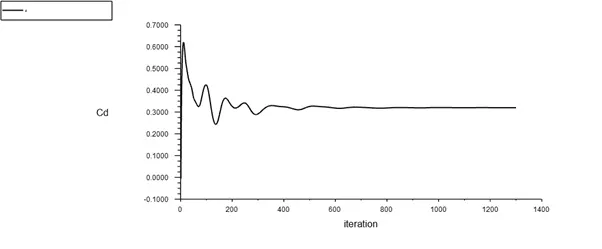
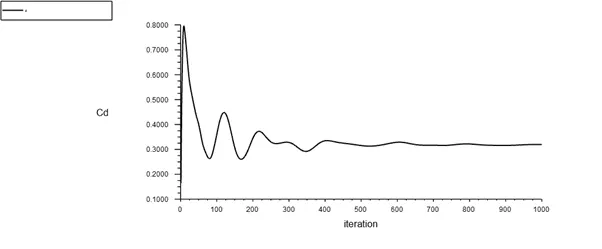
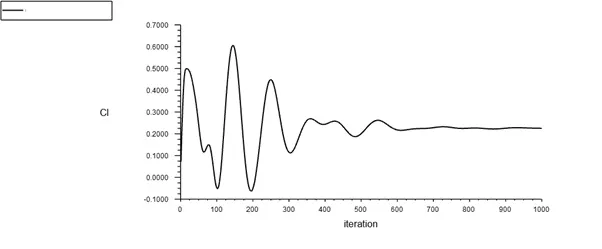
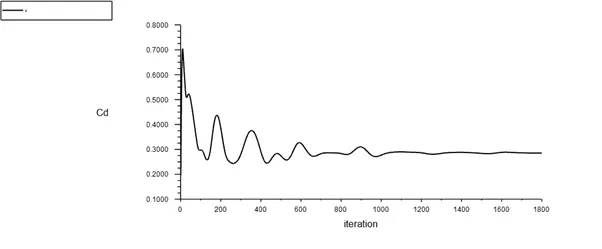
2. The drag coefficient plot for a refined case. (For velocity of 25m/sec, the drag coefficient should be around 0.33).
3. The vector plot clearly showing the wake region.
4. Perform the grid independency test and provide the values of drag and lift with each case.
Introduction
The Ahmed body is a generic car body (a simplified vehicle model). The airflow around the Ahmed body captures the essential flow features around an automobile and was first defined and characterized in the experimental work of Ahmed [1]. Although it has a very simple shape, Ahmed body allows us to capture characteristic features that are relevant to bodies in the automobile industry.
This model is also used to describe the turbulent flow field around a car-like geometry. Once the numerical model in validated, it is used to design new models of the car
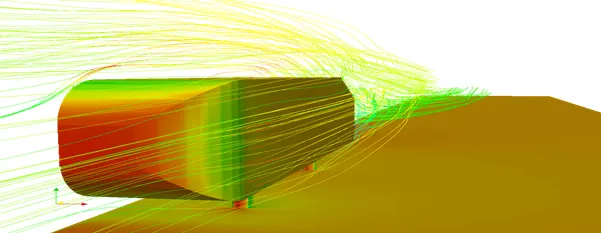
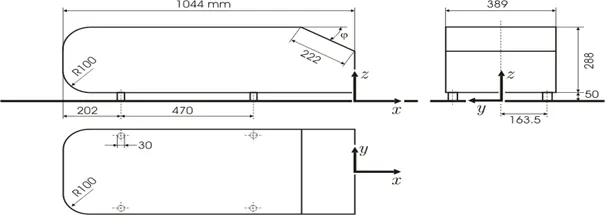
The Ahmed body was described originally by S. R. Ahmed in 1984. Three main features were seen in the wake:
- The A recirculation region that is formed as the flow separates at the top of the vertical back surface of the model
- The B recirculation region that is formed due to the separation at the base of the model.
- The c-pillar vortices that form as the vorticity in the side boundary layers roll up over the slant edges
Analyses done on Ahmed body in ansys
Setting up geometry
- Setting up the above geometry(fig 1)in the space-claim with Φ=20deg
- Creating an outer boundary around the ahmed body and an inner boundary to capture the wake near the wall of ahmed body
- Then split the ahmed body into two ,then to use of the one components
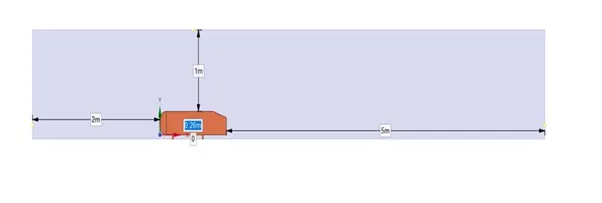
The front plane maintaining the outer boundary left-2m, right-5m and top-1m
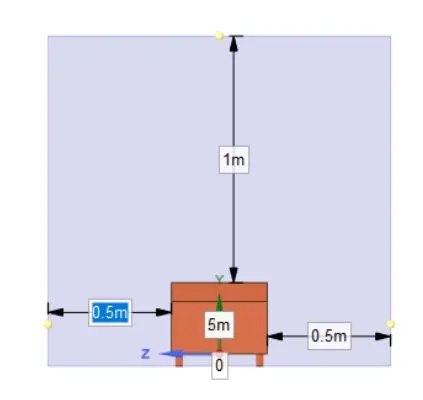
Side view left-0.5m, rght-0.5m
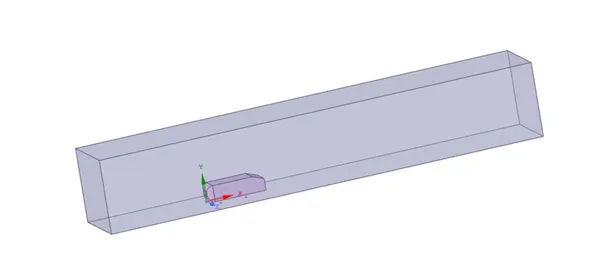
3-dimension view of the outer boundary
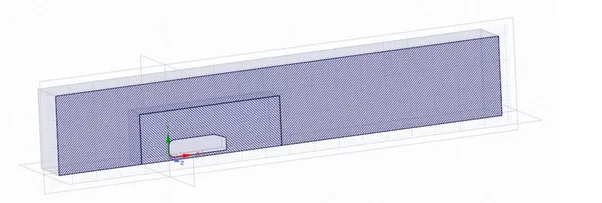
Splitting up the geometry normal to yx plane
Meshing
|
Parameters |
Case1 |
Case2 |
Case3 |
Case4 |
|
Outer enclosure |
100mm |
90mm |
80mm |
70mm |
|
Inner enclosure |
50mm |
40mm |
30mm |
25mm |
|
Face sizing for ahmed body |
5mm |
5mm |
5mm |
5mm |
|
Inflation for ahmed body -6 layers total |
14.374mm |
14.374mm |
14.374 |
14.374 |
To calculate inflation thickness ∆x
We consider that y+ region lies in the log region that is it should be greater than 30 (because have taken standard wall function while setting the physics near the Ahmed body) y+ taken less than 30 would lead wrong computation in the flow domain
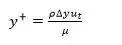
I consider y+=100
ρ=1.225kg/m3, µ=1.78948*e^-4kg/ms of air
ut=1.01m/s; sub this in the above equation ∆y=1.44756mm;
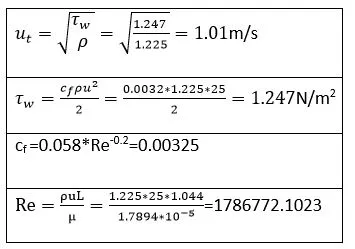
Where and are the fluid density and viscosity respectively, u is the freestream velocity-25m/s, and is the characteristic length, skin friction coefficient Cf, wall shear stress , friction velocity
Therefore ∆y=1.44756mm, considering 6 layers with each layer increment of 20%, Total thickness= 14.374 which obtained from gp formula
Sn=first element*(1-growth_rate^n)/ (1-growth_rate),
Where
First element=delta_y;
Growth_rate-20%-1.2;
Fluent set up procedure
- We take k-epsilon model with standard wall function
- Inlet velocity 25m/s
- Consider the pressure density solver
- Then giving the reference value to evaluate drag and lift co-efficient
From fig 1 we consider the rear end of the Ahmed body, whose area=0.065741m2 and length=1.044m
Results
Case-1
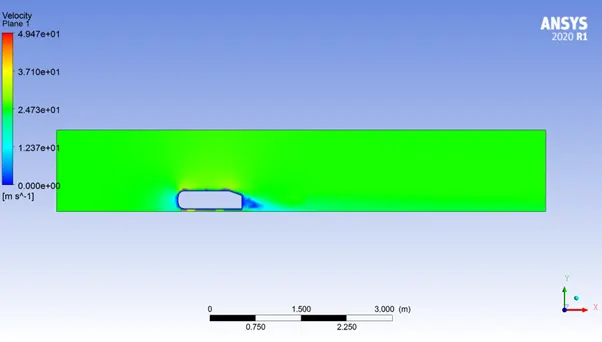
Velocity contour
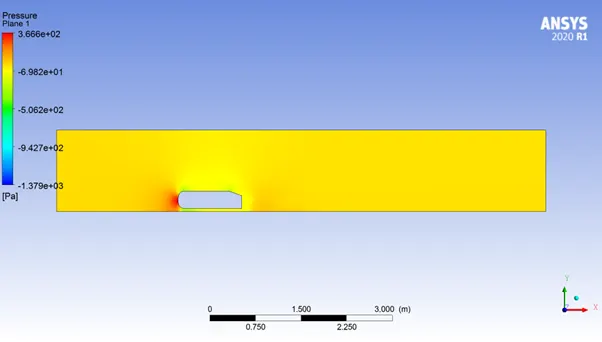
Pressure contour
Drag co-efficient
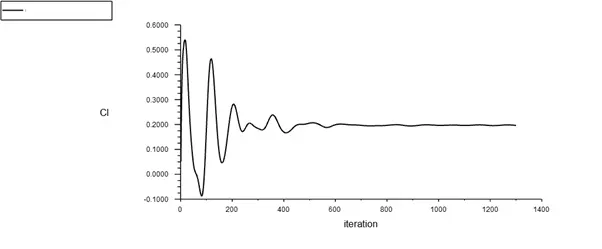
Lift co-efficient
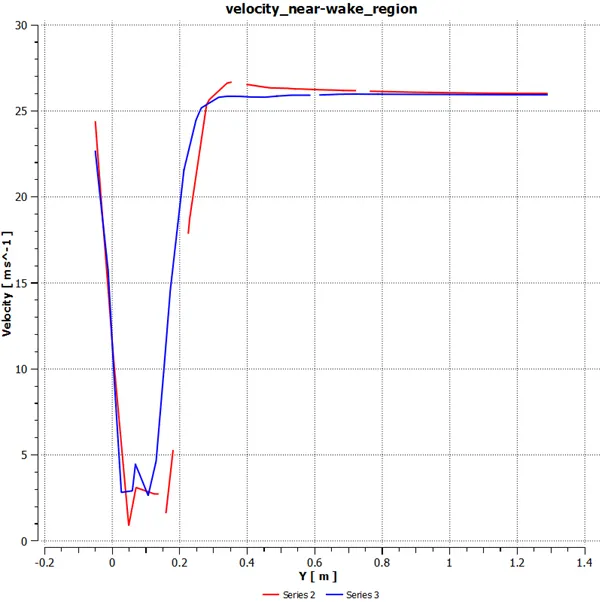
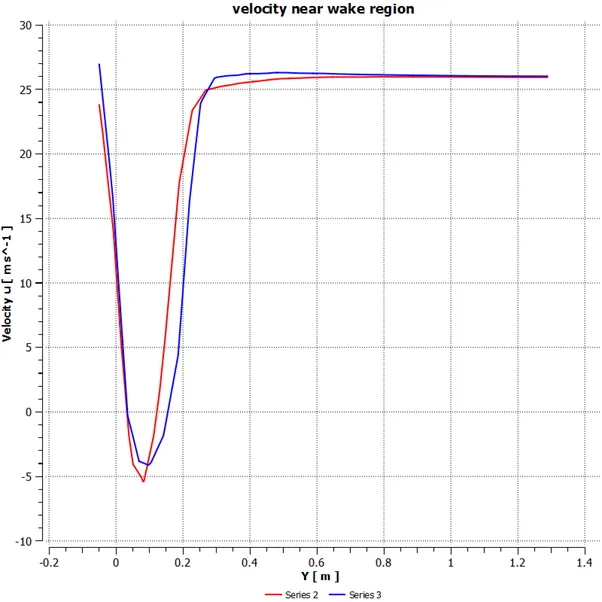
Velocity near wake region
Case-2
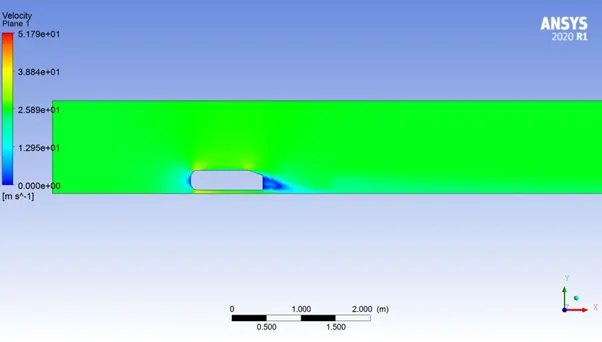
Velocity contour
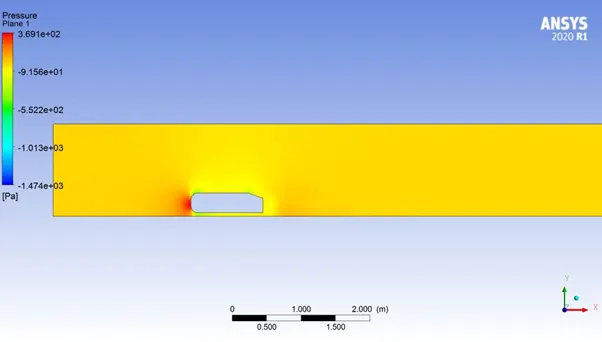
Pressure contour
Drag co-efficient
Lift co-efficient
Velocity near wake region
Case-3
Velocity contour
Pressure contour
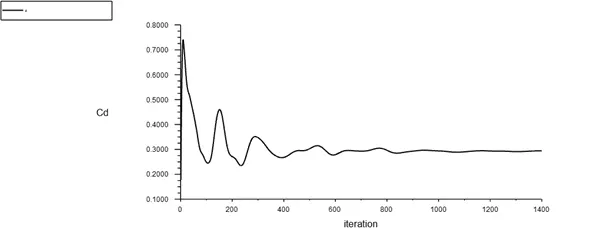
Drag co-efficient
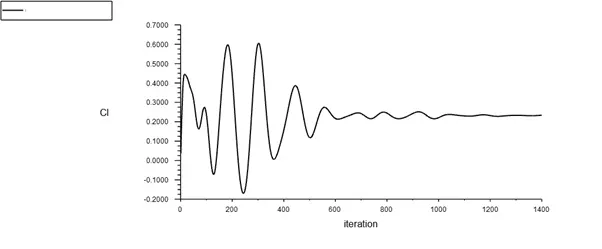
Lift co-efficient
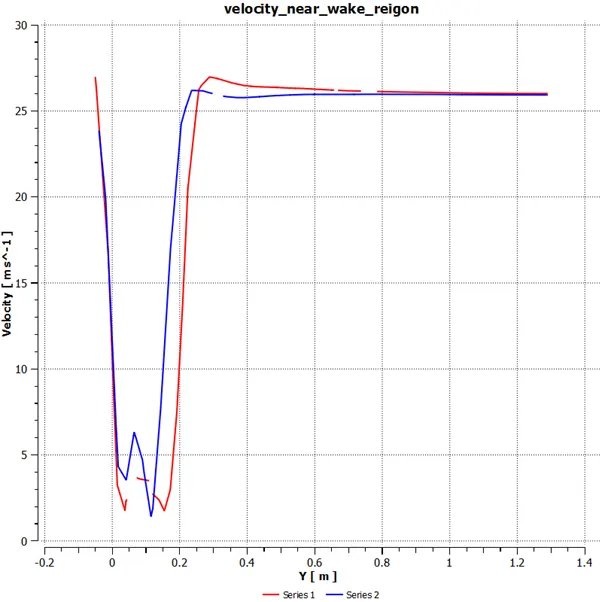
Velocity near wake region
Case 4
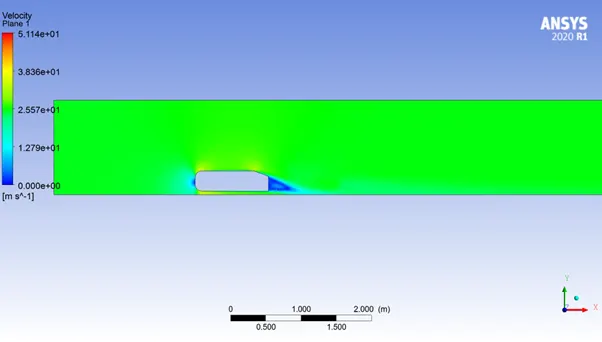
Velocity contour
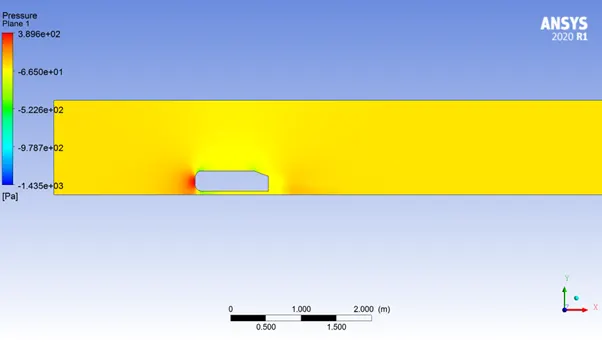
Pressure contour
Drag co-efficient
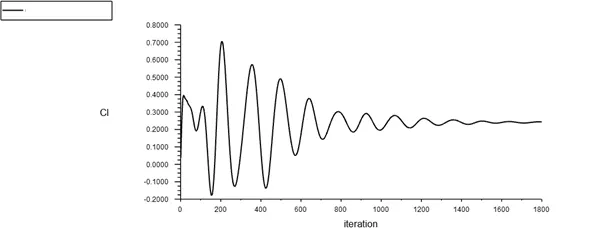
Lift co-efficient
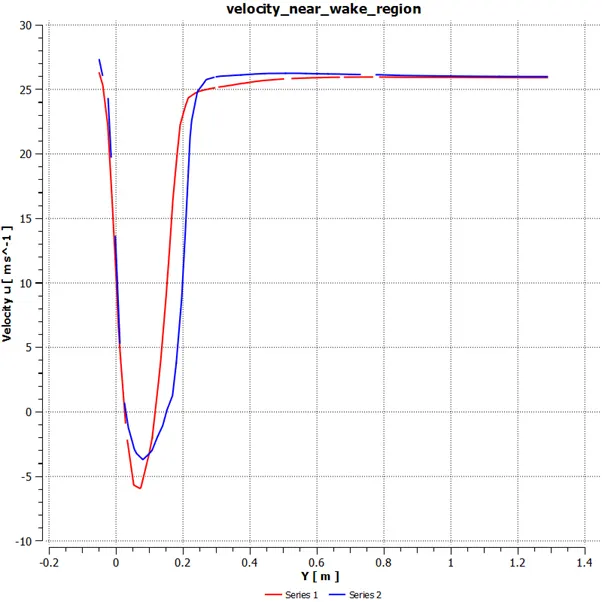
Velocity near wake region
Observations
- In Velocity contour plots as the mesh element increases we can see a clear wake region the contour plots of velocity
- Velocity near the wake region is captured where we observe that as the mesh elements increases we can find velocity at each mesh element and a clear velocity curve
|
Parameters |
Case 1 |
Case 2 |
Case 3 |
Case 4 |
|
Co-efficient of drag |
0.367582466 |
0.335076 |
0.306930519 |
0.300211521 |
|
Co-efficient of lift |
0.196653544 |
0.234653 |
0.231369666 |
0.238579628 |
|
Number of elements |
86464 |
145813 |
296338 |
493269 |
Negative pressure in the wake region
The fluid as it flows Ahmed body there would be stagnation of air particles at the front of the Ahmed body and pressure would be more which can be seen from the pressure contour, then there would be gradual increase in the acceleration of the air particles till the start of the slant angle
There would be declaration air particles as it flows through the slant angle from the start till the end of slant angle these air particle would follow the same stream path of the slant angle which shown in below figure
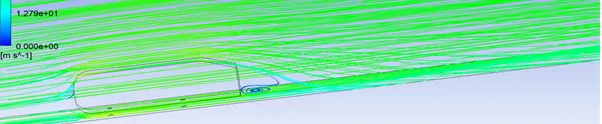
Due to which in the rear part of air wouldn’t stagnate there would be very less pressure consider to front of the region and there will be no interference of atmospheric pressure at the rear region so the pressure drops
These pressure drop at the rear end would create a suction like vacuum, due high pressure at front and low pressure at rear due to which body gets pulled inside the vacuum region thus creating drag
Explain the significance of the point of separation
As an engineer we would like to minimise the co-efficient drag acting near the wall of the body so we design the body in such a way that it would flow the path of the wall (slant length) In above case the slant angle Φ=20 deg Due which there would be flow separation at the top part of rear end and bottom part of the rear end
If slant angle Φ>30 deg then there would be flow separation at the slant edge itself without completely following the slant length due to which there would be large drag to the body. Standard wall function (k-epsilon model) used in ansys would fail to capture the physics behind because velocity on wall shear stress ut would be zero hence y+ tends towards zero
As an engineer we would like to minimise the co-efficient drag acting near the wall of the body so we design the body in such a way that it would flow the path of the wall (slant length) In above case the slant angle Φ=20 deg Due which there would be flow separation at the top part of rear end and bottom part of the rear end
If slant angle Φ>30 deg then there would be flow separation at the slant edge itself without completely following the slant length due to which there would be large drag to the body. Standard wall function (k-epsilon model) used in ansys would fail to capture the physics behind because velocity on wall shear stress ut would be zero hence y+ tends towards zero
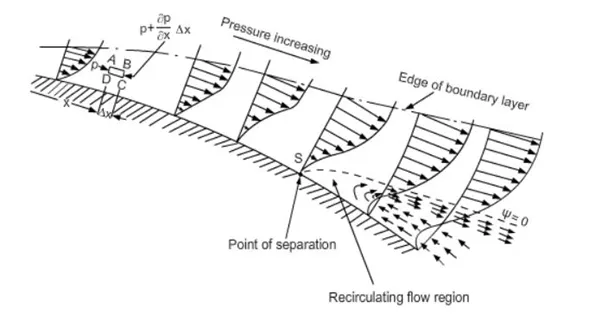
When air molecules move in stream at 30 deg slant length at the rear part of Ahmed body due to decrease of acceleration of stream particles of air their would increase in pressure gradient due to velocity near the viscous layer gradually decreases to zero and flows opposite to normal flow direction
In our case when angle Φ=20 there increase in pressure gradient this in change pressure is less compared to angle Φ=30 so there would be no flow separation in the slant at rear end
Conclusion
- High pressure is formed due to stagnation air particles at the frontal area of the body
- The adverse pressure gradient is created near the wake regions because of the flow separation due to drag and lift co-efficient are present in the body
- As the mesh increase results comes closer to experimental results