Week - 4 - crash box simulation
Aim:
Conduct a simulation of crash box onto a stationary rigid wall with elastic and nonlinear material cards.
Objective:
- Prepare the deck for crash simulation of a box onto a rigid wall with initial velocity of 50kmph given to the crash box.
- Assign elastic and nonlinear material cards with different thickness values to the crash box.
- Validate and compare the results obtained from the above simulations.
Modeling:
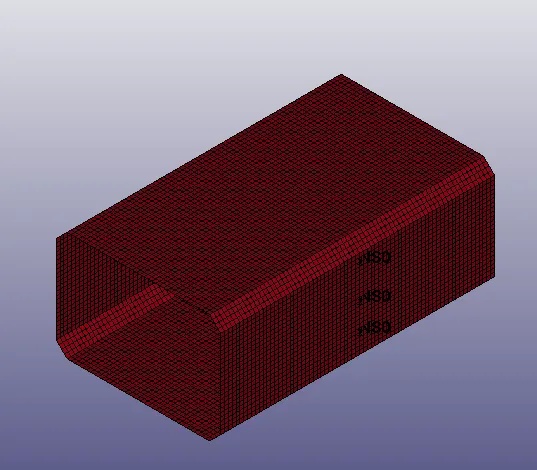
- The mesh model of the crash box is loaded into the LS PrePost workspace.
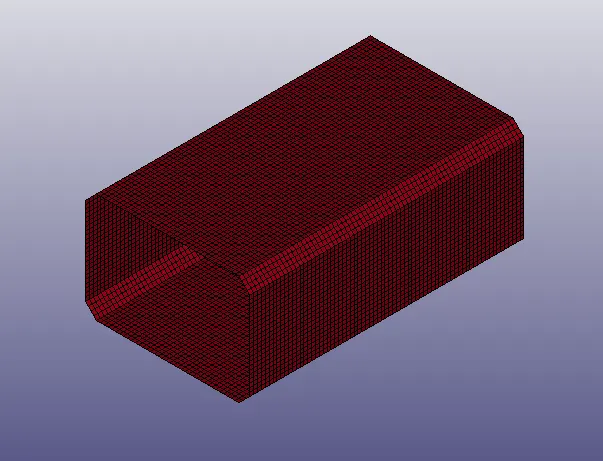
- The shell section card with thickness of 1.2mm and reduced element formation (ELEFORM = 6) is assigned to the crash box.
- Steel material with elastic material card i.e. MAT 001 is assigned to the crash box. Hourglass with viscous control formulation is considered.
- A rigid wall of 300mm*300mm with RIGIDWALL_GEOMETRIC_FLAT_DISPLAY keyword at a distance of 15mm away from one end of the crash box is defined.
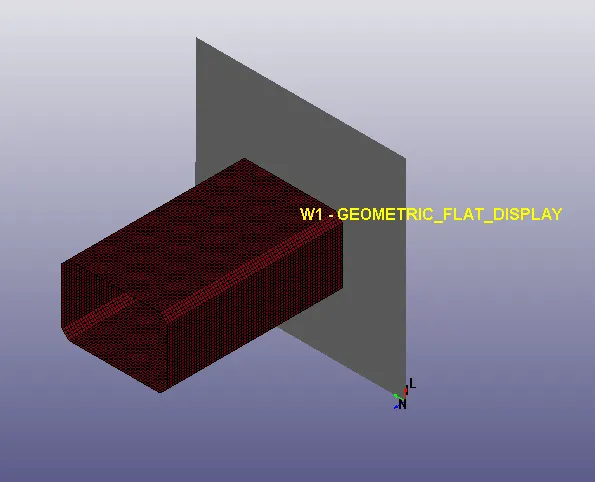
- Initial velocity of 13.89m/s (50kmph) towards the rigid wall is applied to all nodes of the cash box.
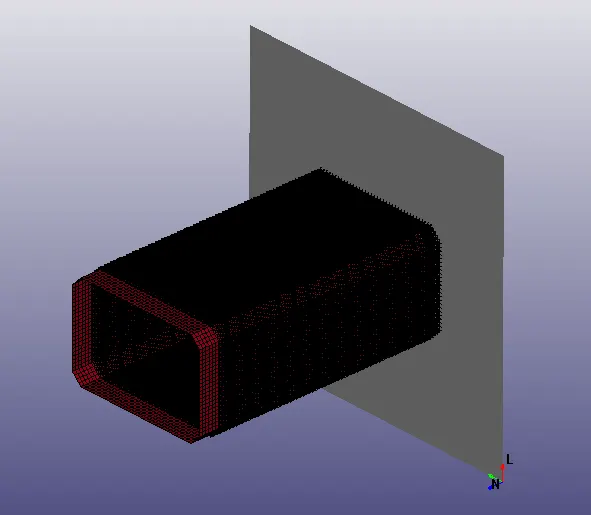
- Automatic single surface contact is assigned to the crash box. This contact definition accounts for self contact of the crash box.
- 5ms is assigned as the termination time in the control cards. Energy and hourglass control cards are defined.
- Cross section plane in the middle of the box is defined for force output requests. Nodes in the centre along the length of the crash box are selected for database history requests.
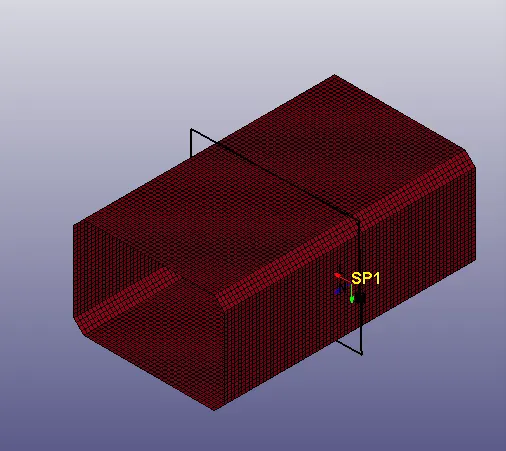
- Output requests like d3plot, glstat, matsum, sleout, rcforc, secforc and nodout with 0.2ms time interval are defined.
- The simulation is carried again by the changing the material from elastic to piecewise linear plastic i.e. MAT024 with appropriate yield stress and the tangent modulus.
- The thickness is changed to 1.5mm and the above cases are compared accordingly.
Case 1: Elastic material with shell thickness of 1.2mm
Case 2: Elastic material with shell thickness of 1.5mm
Case 3: Piecewise linear plastic material with shell thickness of 1.2mm
Case 4: Piecewise linear plastic material with shell thickness of 1.5mm
Results:
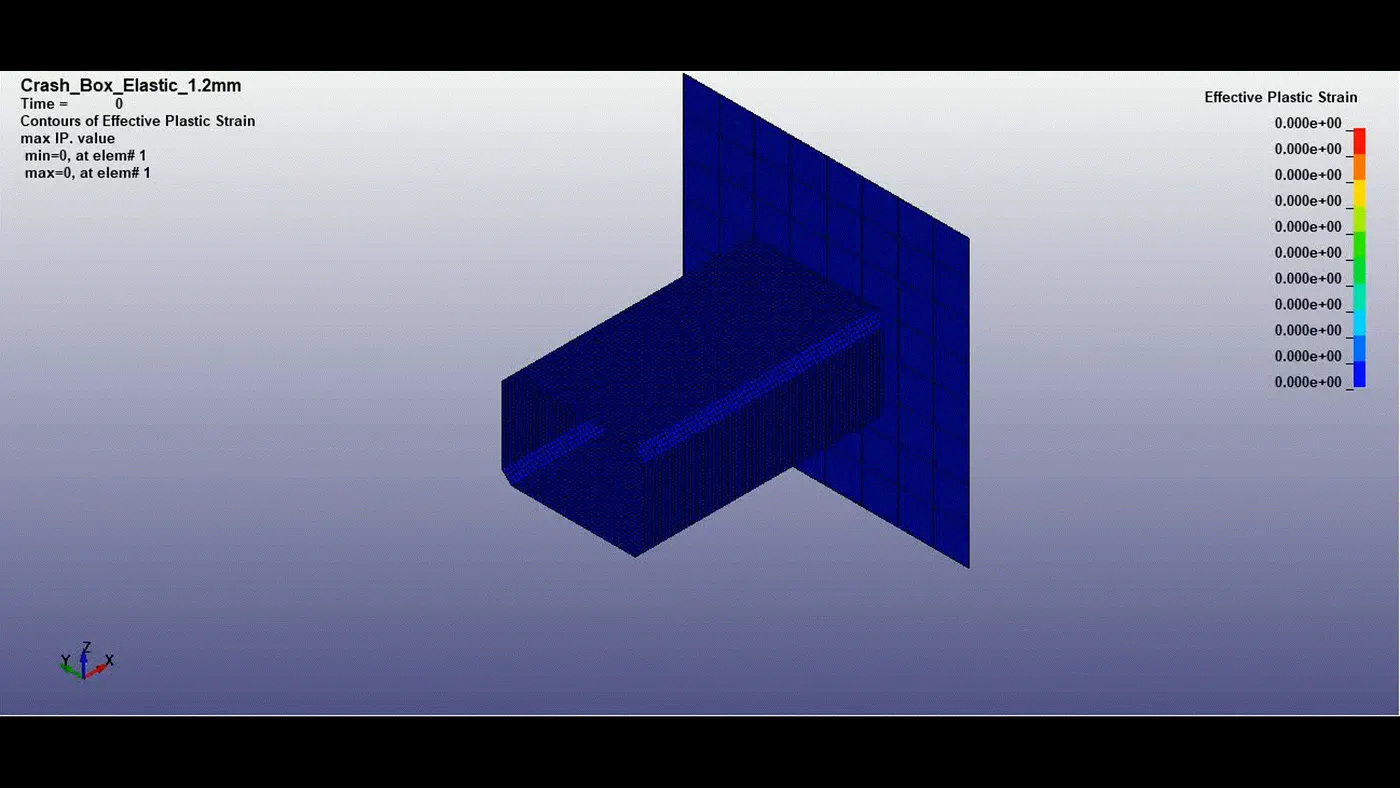
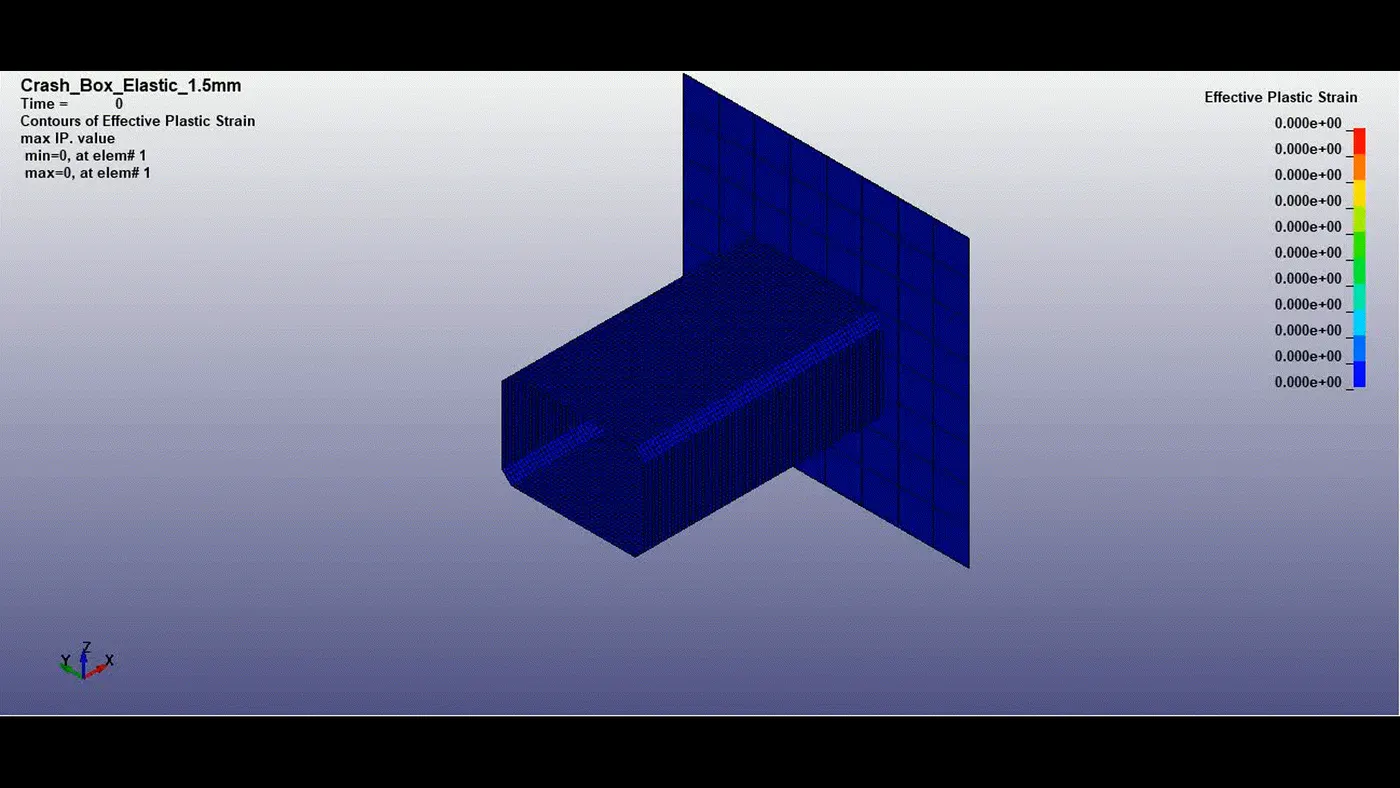
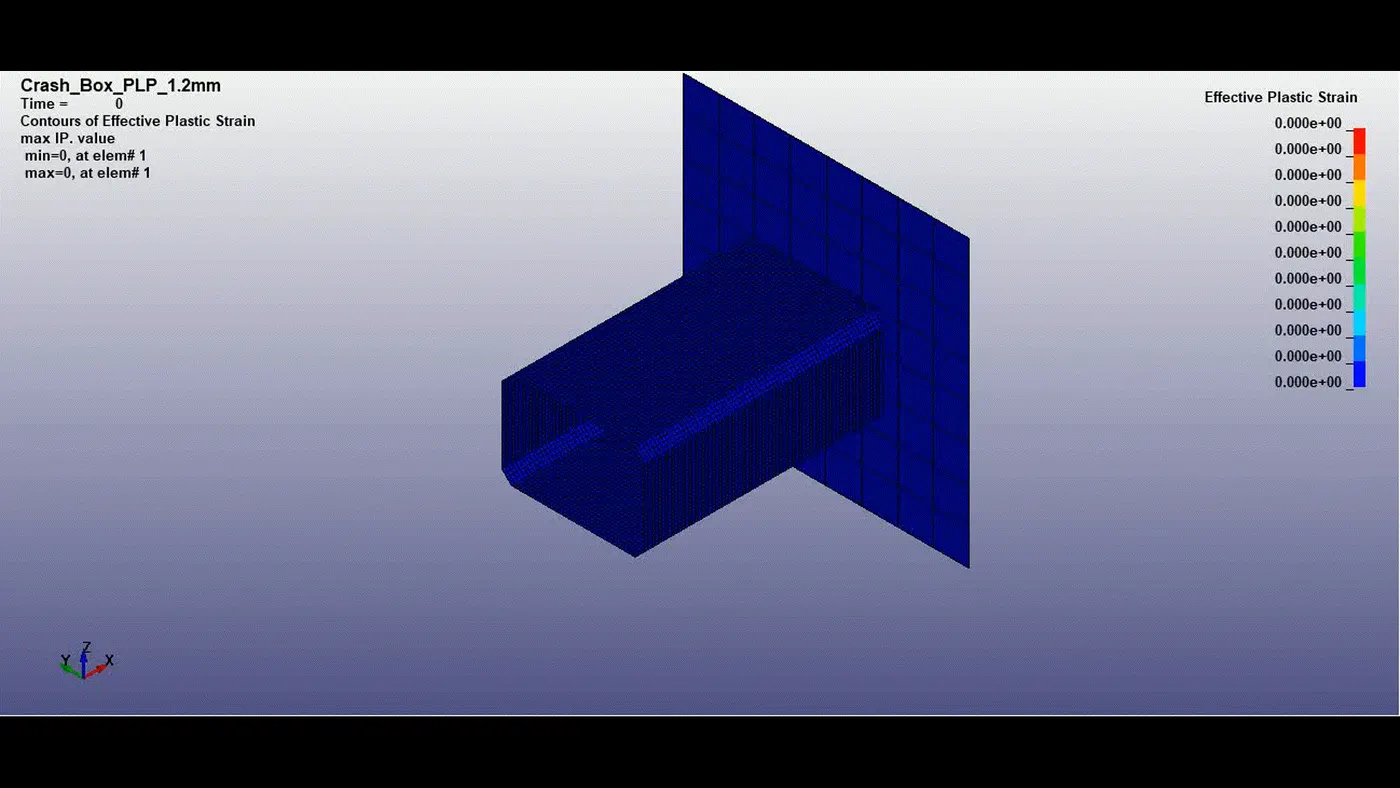
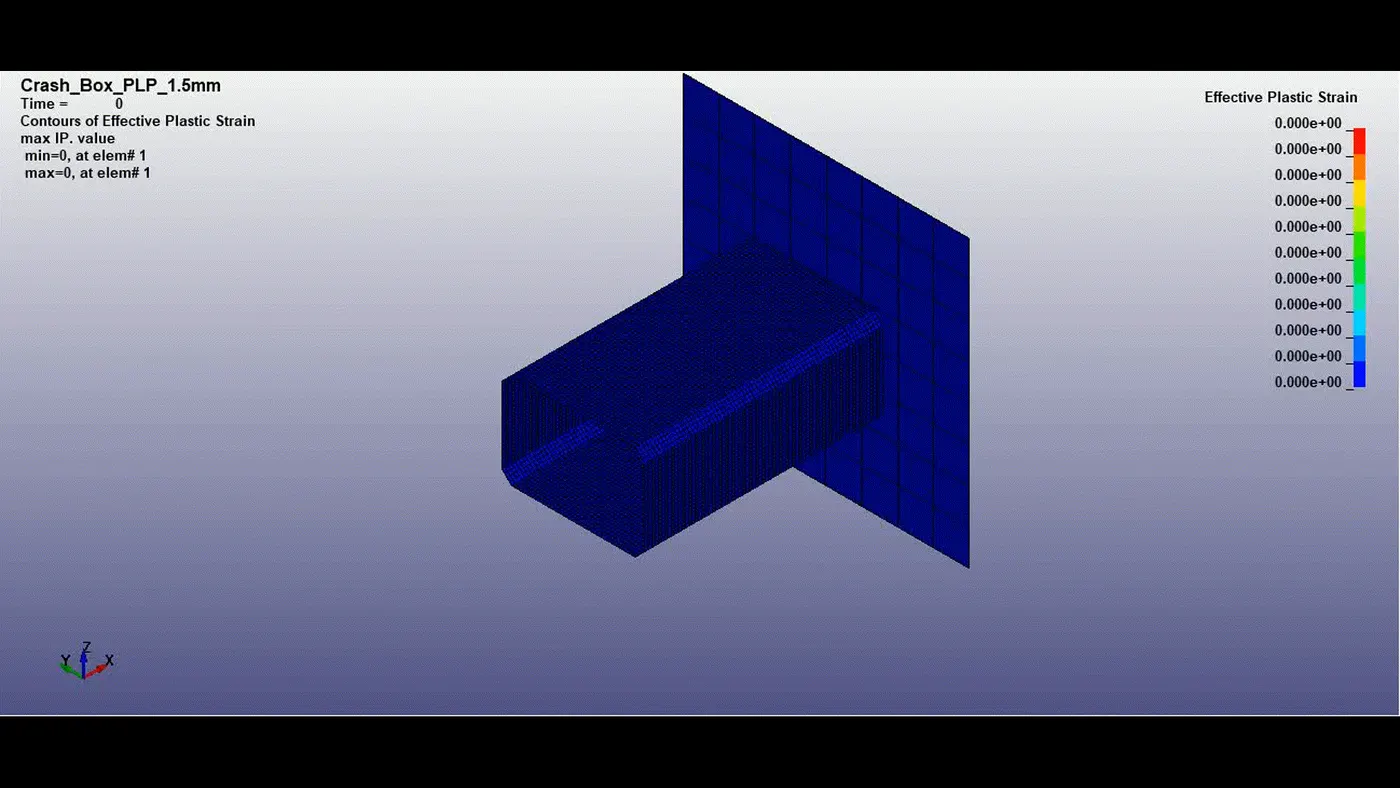
The crash boxes deflect back after hitting the rigid wall, but from the above simulations it is clear that model with plastic materials bounce back with less speed compared to elastic material model. Most of the impact energy from the stationary rigid wall is absorbed by the plastic model by experiencing plastic deformation, while in elastic material it is taken bounce back the model. Since, plastic material absorbs crash energy, rebounded velocity is observed to be low.
From the plastic strain values, it can be depicted that the thick materials take most deformation and therefore more crash energy will be observed by thick shell components compared to thin shell components.
Cross sectional force:
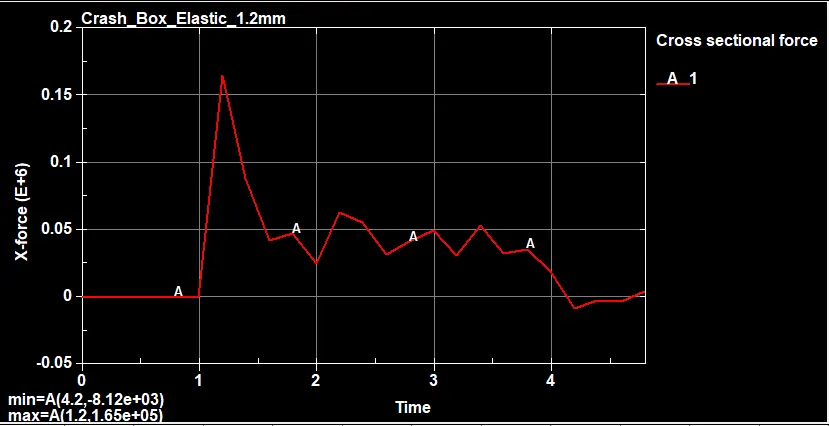
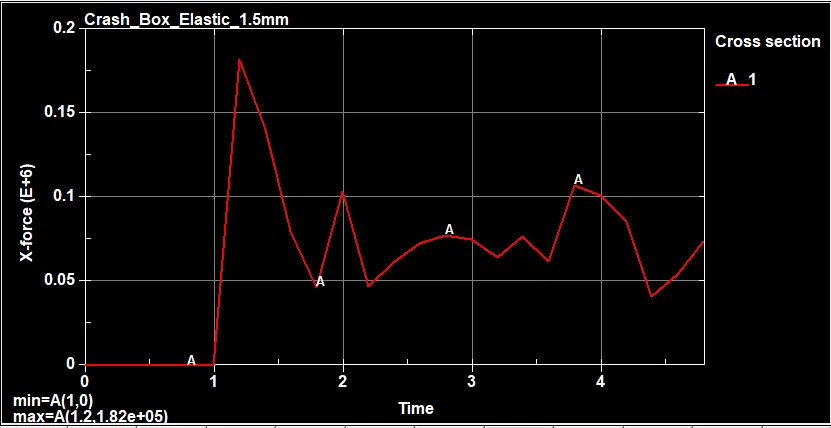
Sectional force plots along the x-axis for elastic material models.
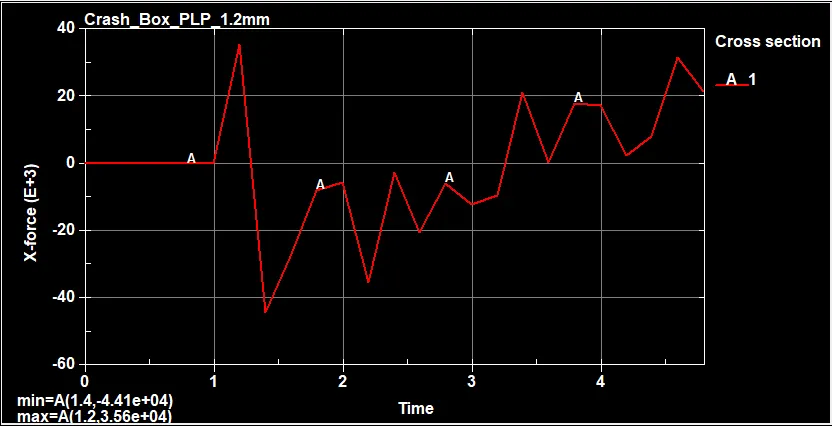
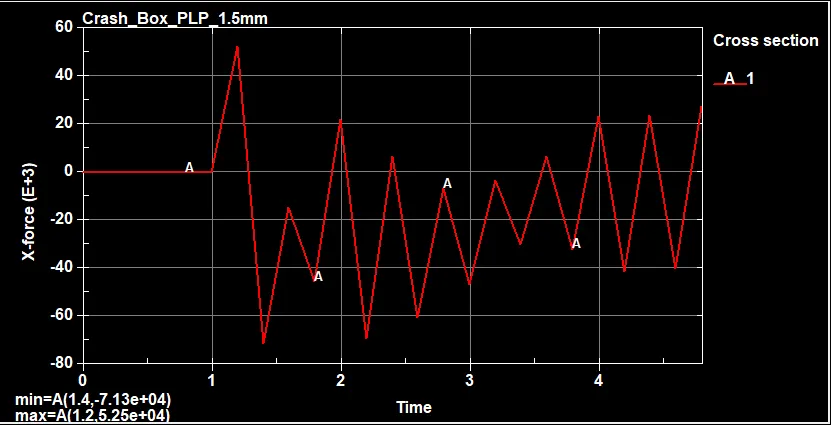
Sectional force plots along the x-axis for nonlinear material models. The maximum force is experienced at time 1.2ms i.e. just after the crash in all cases.
From the above plots it can be depicted that plastic material undergoes mostly compressive load. The magnitude of the maximum force at the section plane is high in case 1 and minimum in case 4.
Comparatively thick shell models experience less force than the thin shell models.
Acceleration: Acceleration along x - axis (Exact value) is considered rather than resultant acceleration because (Absolute value). Three nodes are considered for output in each case.
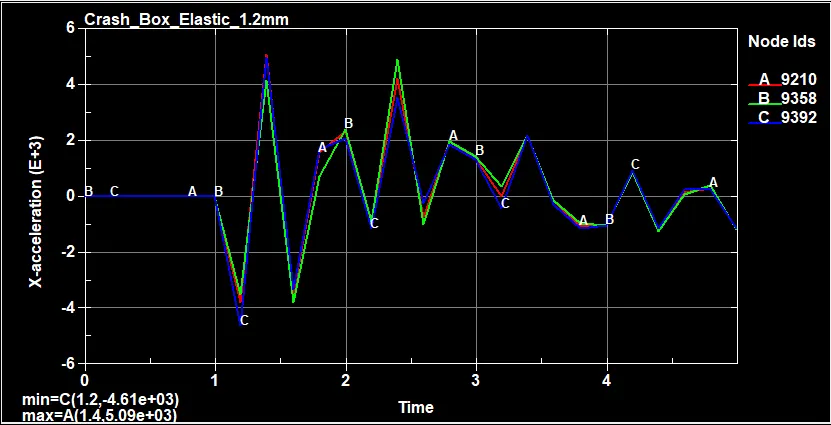
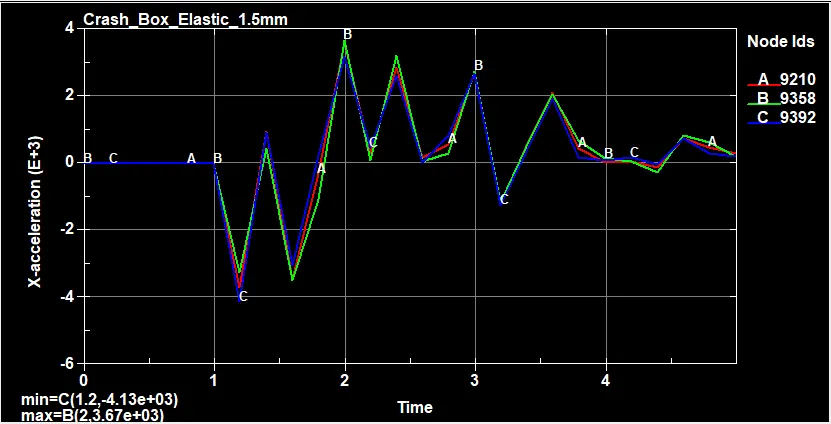
The nodes of the both thickness values for elastic material, minimum is observed at 1.2ms and the both models decelerate right after the crash.
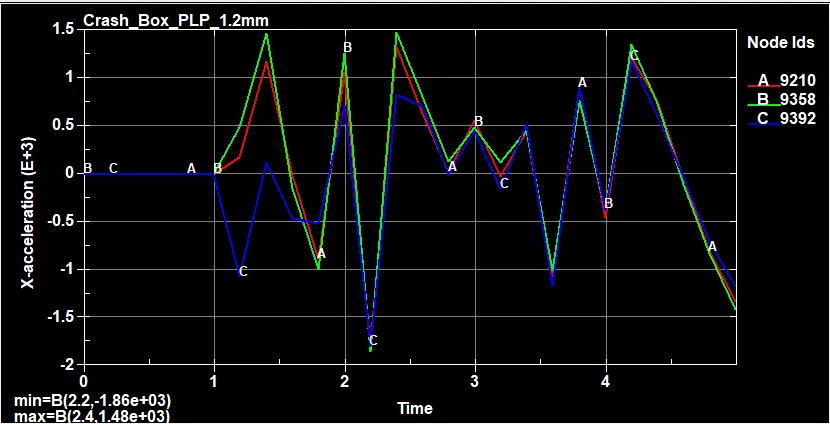
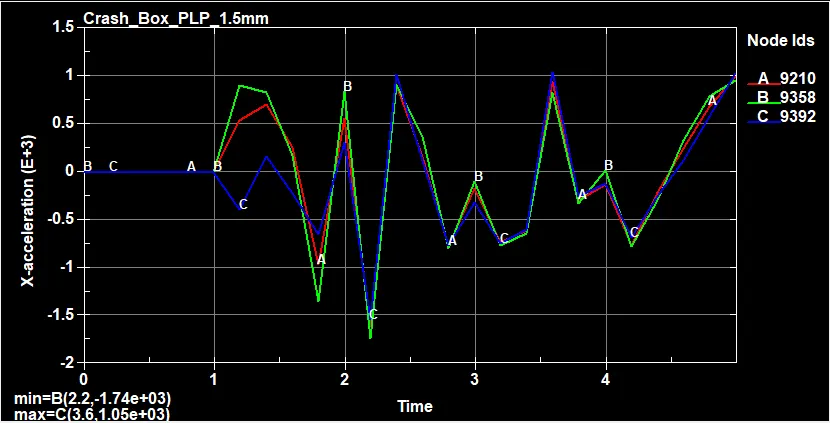
The nodes of the plastic material moving with uniform velocity are observed to be accelerating right after the crash and during this time, the plastic material undergoes plastic deformation mostly.
Thin shell elements are observed to have maximum acceleration value compare to thick shell models in both material cases.
Maximum directional stress and strain along length (Absolute values):
| Case | X- Stress (MPa) | Y- Stress (MPa) | X-Strain (1e-3) | Y- Strain (1e-3) |
|---|---|---|---|---|
| Case 1: Elastic 1.2mm | 491.09 | 466.44 | 2.01 | 1.17 |
| Case 2: Elastic 1.5mm | 449.46 | 386.47 | 1.87 | 0.982 |
| Case 3: PLP 1.2mm | 227.89 | 254.48 | 0.76 | 6.05 |
| Case 4: PLP 1.5mm | 247.89 | 239.77 | 0.73 | 6.19 |
The above tabulated values are absolute values at various time intervals.
Energy plots:
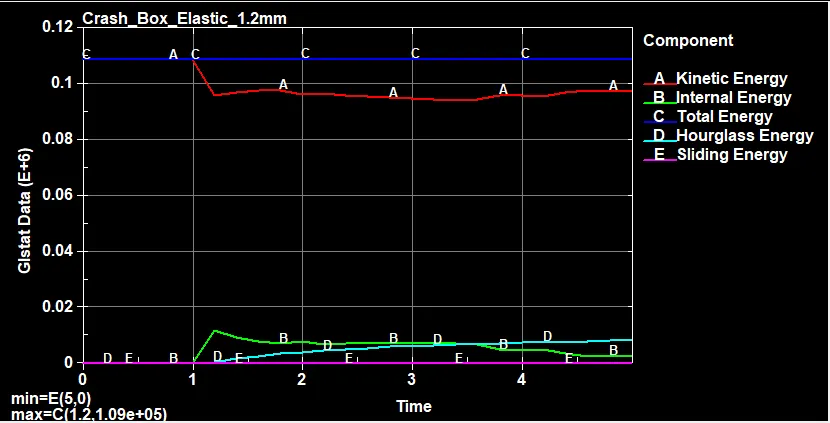
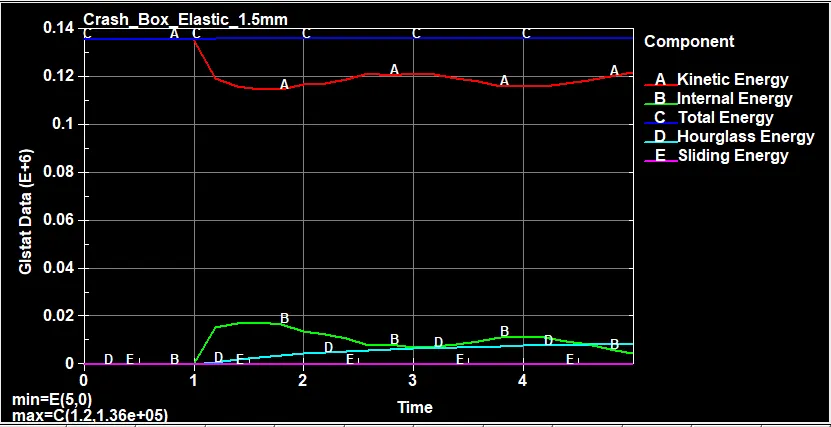
The elastic materials happen to have less raise in the internal energy and retain most of its kinetic energy as expected and this is also confirmed in the above animations.
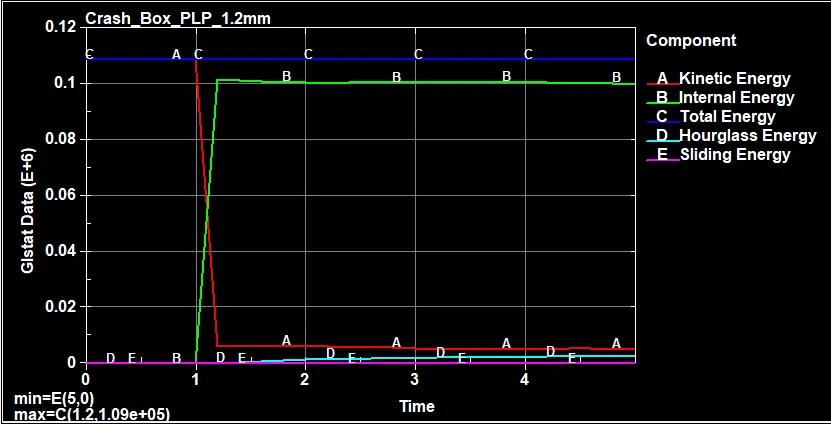
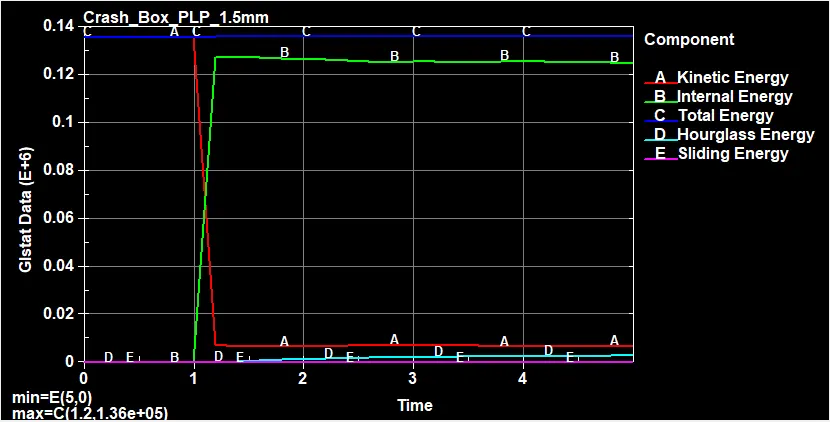
The non linear material energy plots show that there is a high raise in internal energy due to the plastic deformation at crash and very less amount is retained as kinetic energy.
From all the energy plots it is clear that there is no amount of sliding energy during the simulations and this is due to the bouncing of the crash box off the wall after crash. Total energy in the all cases is almost constant and this shows the energy is successfully conserved.
Conclusions:
The crash box with different thickness and material is crashed into the rigid wall is simulated successfully according to the objective. The results are validated and compared among thickness and material conditions. The unit system used is gm-mm-ms.