Week-4 Challenge WOT Condition Part-2
Challenge01: Difference between mapped and dynamic model.
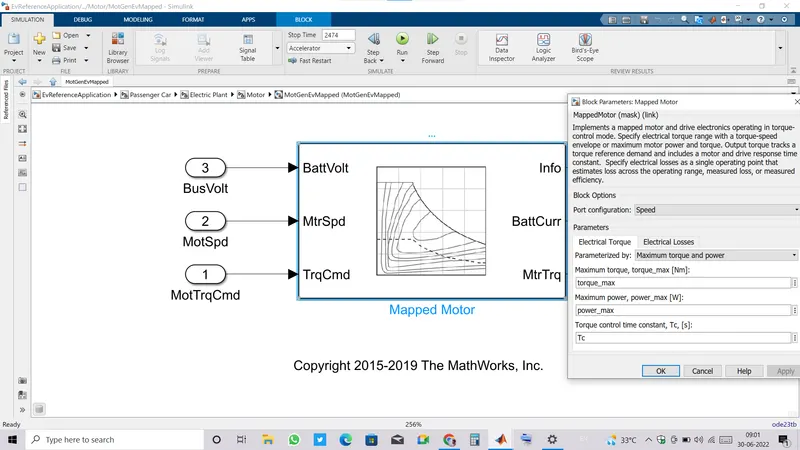
MAPPED MODEL:
- In Mapped model,instead of actual behaviour of components the component data is configured with the help of lookup tables.
- It is also known as Global model.
DYNAMIC MODEL:
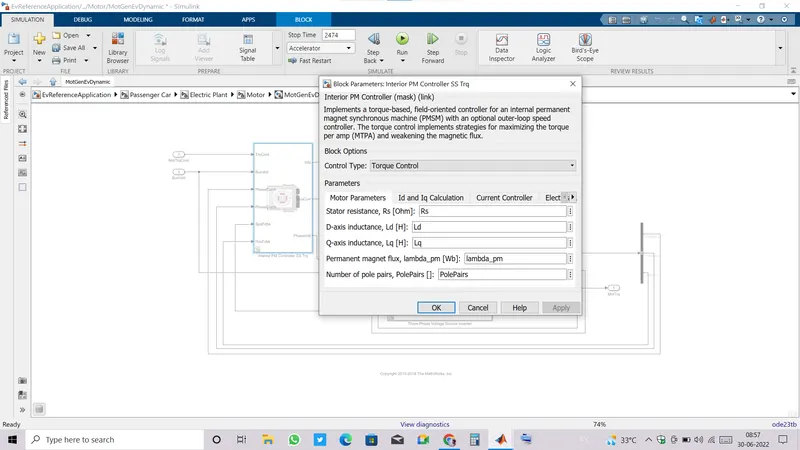
- This model is the real time operation based model.
- In this model, actual behaviour of each component is taken into consideration and then configured by providing values of parameters.
- It is also known as Real-time model.
Challenge02:
Calculation of miles per gallon.
- Vehcile speed and Battery power data is taken for Miles per gallon calculation.
- We can see the product of vehicle speed to itself is taken and then root, this is done for distance calculation and to avoid the distance appear in negative value caused of negative velocity value.
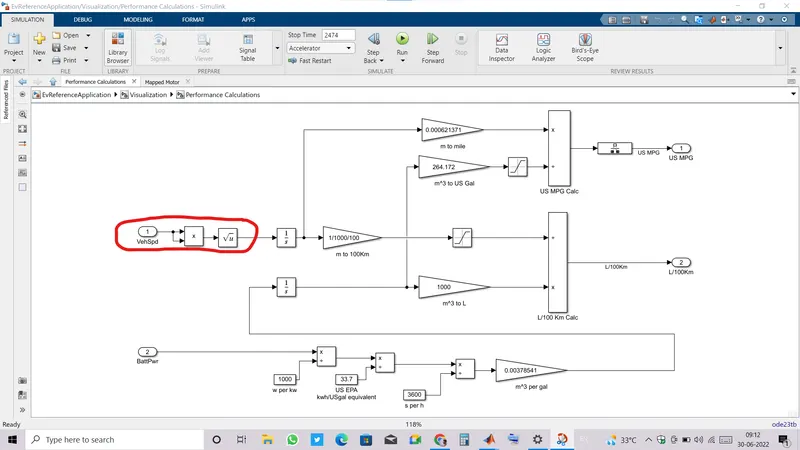
- Distance travelled by vehicle is being calculated by vehicle speed integration.
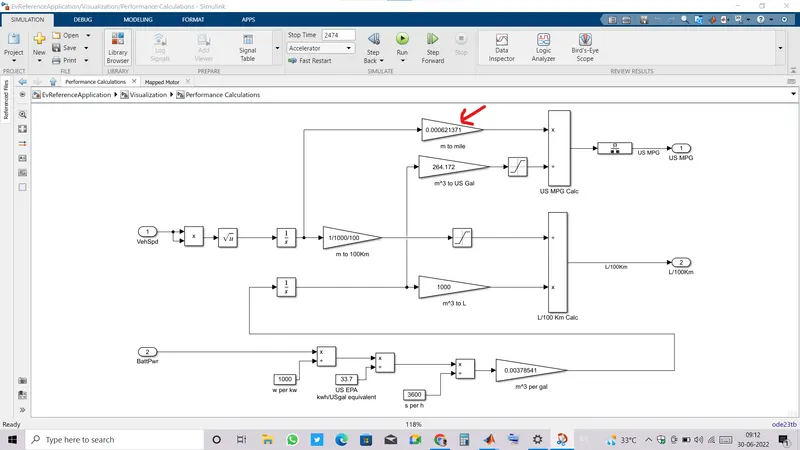
- Then Distance is converted to miles by multiplying it with 0.000621371.
- Now for energy calculation in gallons, battery power data is used.
- Battery power is in Watts so dividing it by 1000 will convert power unit from Watts to kiloWatts.
- To convert kW into gallons, it is further divided by 33.7 {1 gallon = 33.7 kW.}.
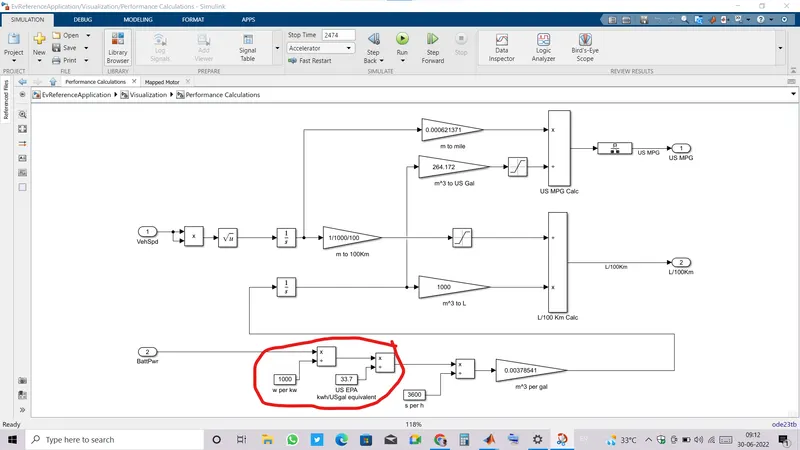
- We know the relation between power and energy, Integration of power over a period of time gives energy, time is in seconds so converting it into hours further dividing outcome by 3600.
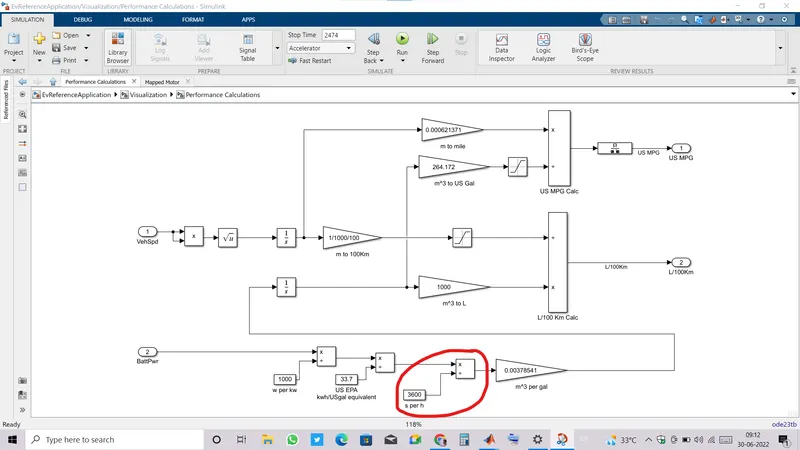
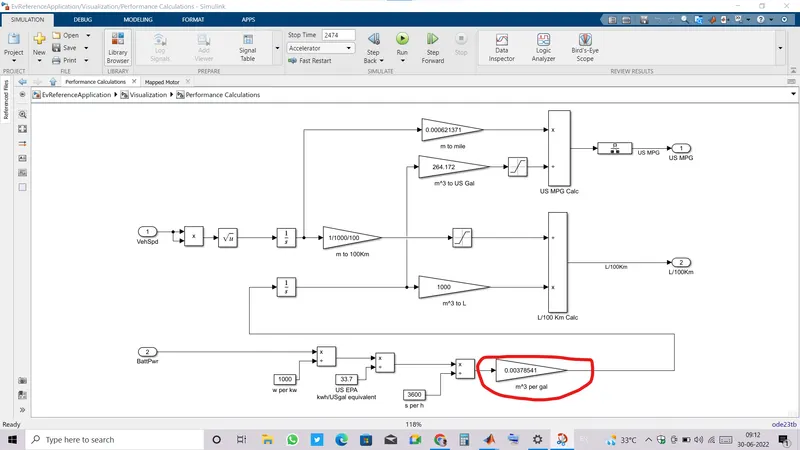
- Now, Gallon is converted into m^3 by multiplying 0.00378541
- Then power is need to be integrated to get energy so in the next step integration block is used.
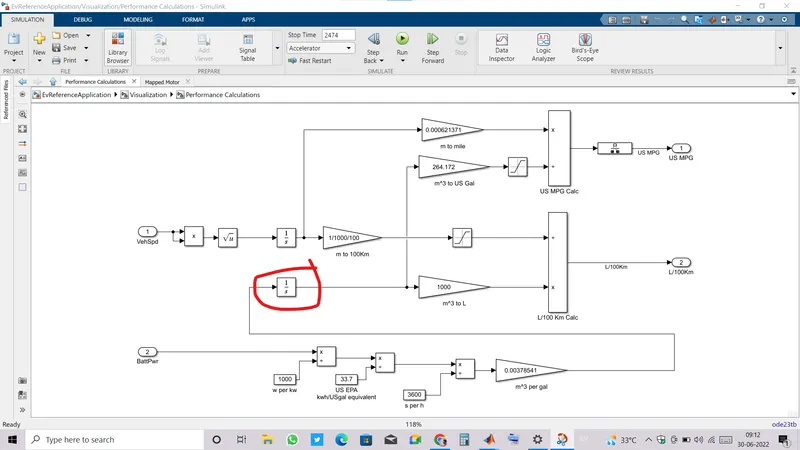
- Till now, We got energy(in m^3 per hour) which is consumed by vehicle travelling a distance(in miles).
- Now m^3 is converted into gallons by multiplying 264.172 .
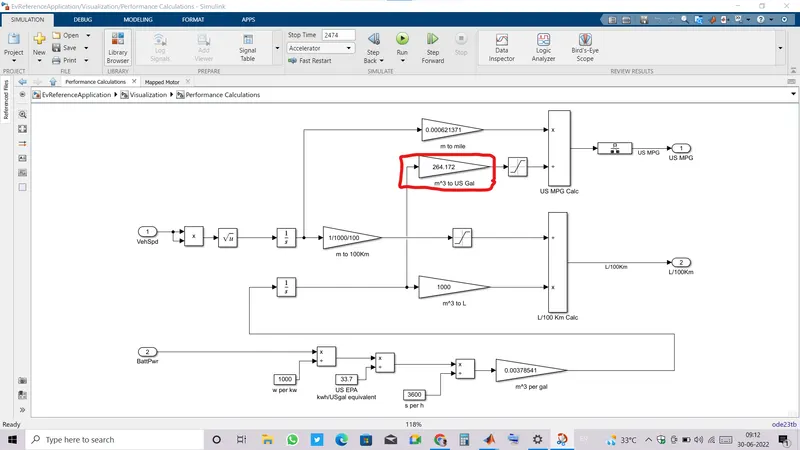
- Vehicle travelled distance in miles in then divided by energy calculated in Gallons gives Miles per gallon value.
- Saturation block with lower limit 0.001 is used in gallon branch because it is given to denominator and if it goes zero then the miles per gallon value goes infiinte, so to make the miles per gallon in limit it is done.
Fuel Flow rate calculation:
- For fuel rate calculation, again same data vehicle speed and battery power is used.
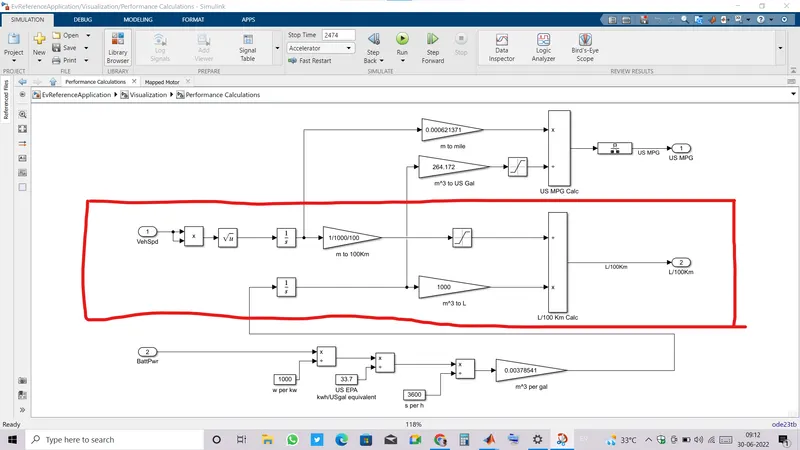
- Distance is calculated as discussed earlier.
- Fuel rate is calculated per 100 kms so that converting distance from m to per 100 km by dividing 1000*100.
- The energy we already calculated in m^3 is then converted into Litres by mutliplying 1000 .
- Fuel rate is then calculated by diving Litres by distance(per 100kms).
Challenge03:
- Open any model of HEV multimodel REFERENCEApplication.
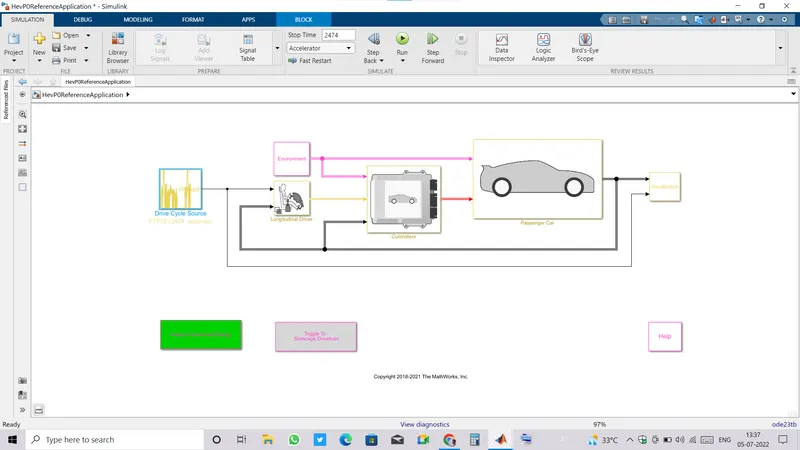
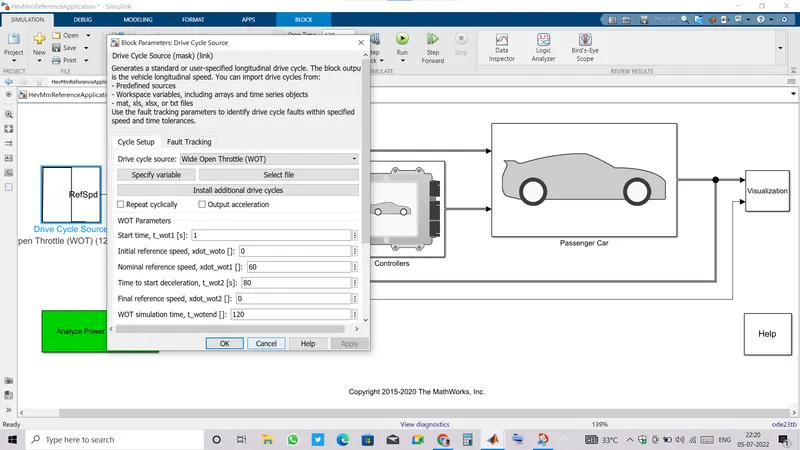
- To select WOT drive cycle just goto Drive Cycle Source block in model window and double click on it.
- Select WOT as shown in image below.
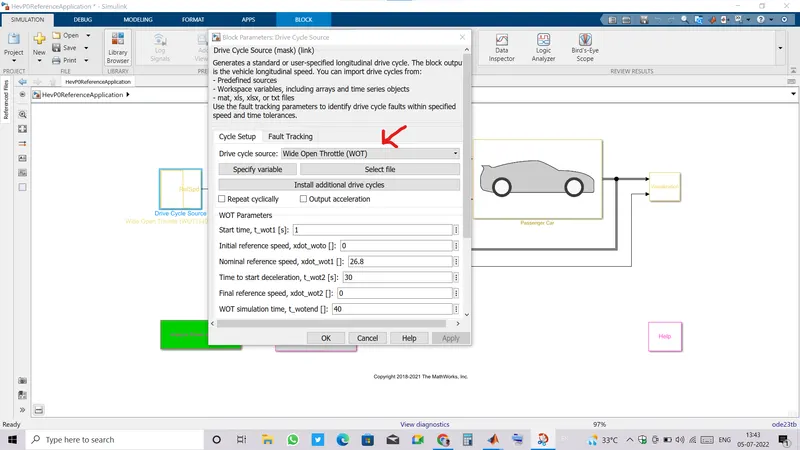
- After selecting WOT Drive Cycle, provide WOT parameters.
- Now, goto Environment and change the value of Grade and Wind.
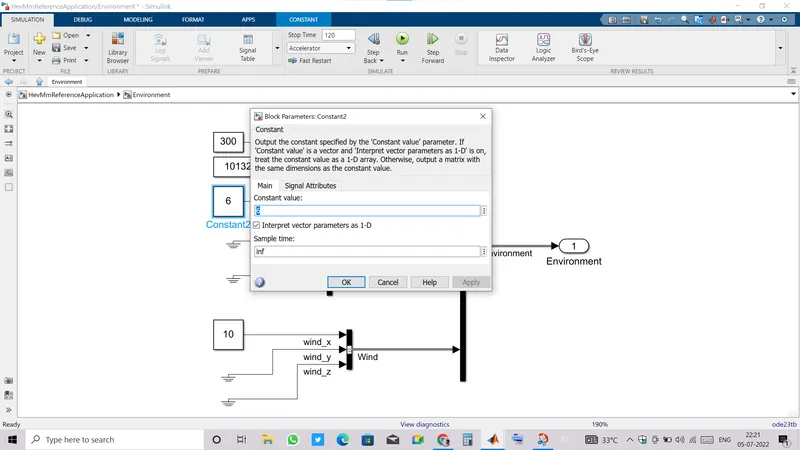
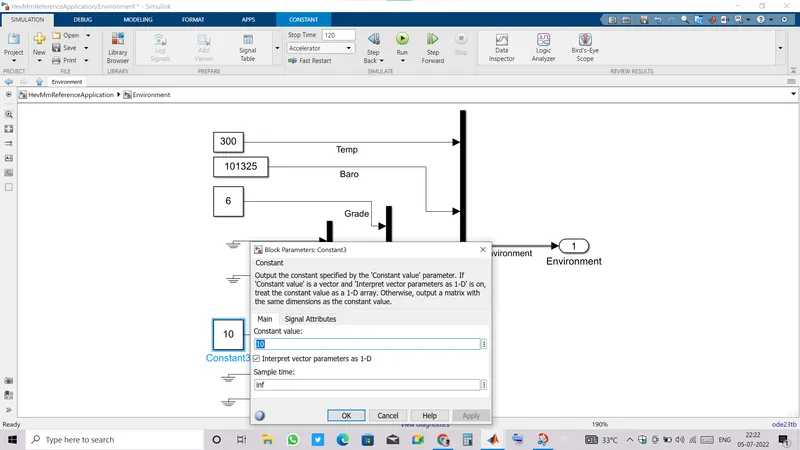
- Model is ready to run , run for 120 secs and see the result plots.
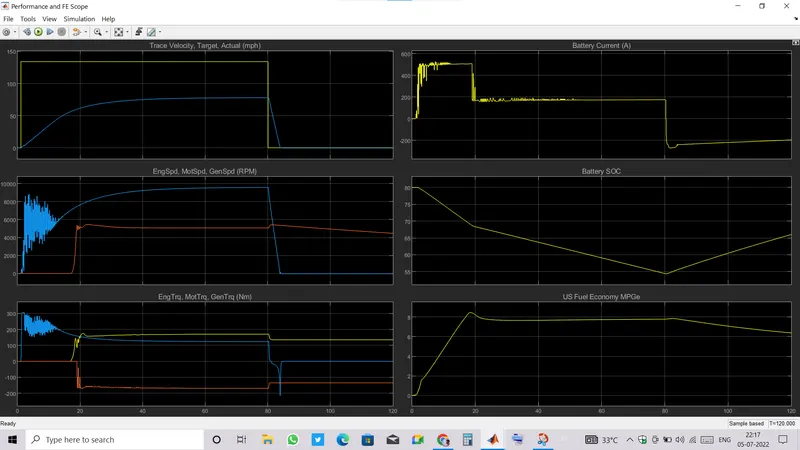
- We can see that the trace followed by actual velocity(blue line) is not overlapping the target velocity trace(yellow line), the limiting factor here is the current, BMS does not allow battery to operate at overcurrent, hence speed is compromised here.
- Battery current is increasing till the vehicle is accelerating, and current becomes zero when power is supplied by engine only.
- SOC is falling as vehicle is accelerating.
- While decelerating, we can see the battery currrent is going negative that indicates the regenerative braking , Battery SOC is building during regenerative braking.
- Initially motor torque is greater than engine torque then engine torque overtook and became greater than motortorque.
- Motor is all time running at higher speed than engine.
Challenge04: Comparing the simulated results of hybrid and pure electric powertrain:
- Change the drive cycle for Pure EV ReferenceApplication to WOT.
- Set the WOT Parameters.
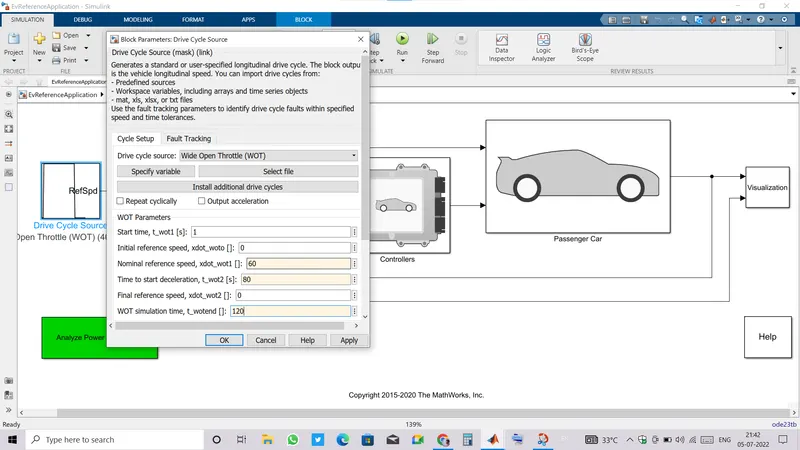
- Also change the environment like Grade and Wind values as we did before.
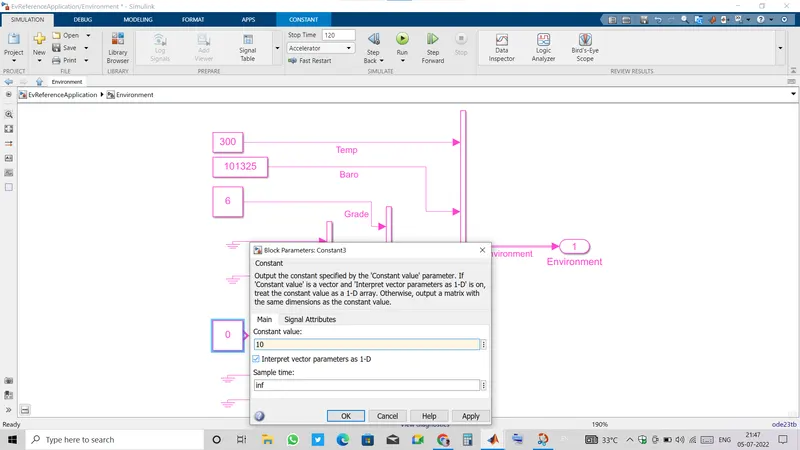
- Run the simulation for 120 secs and see the plots obtained.
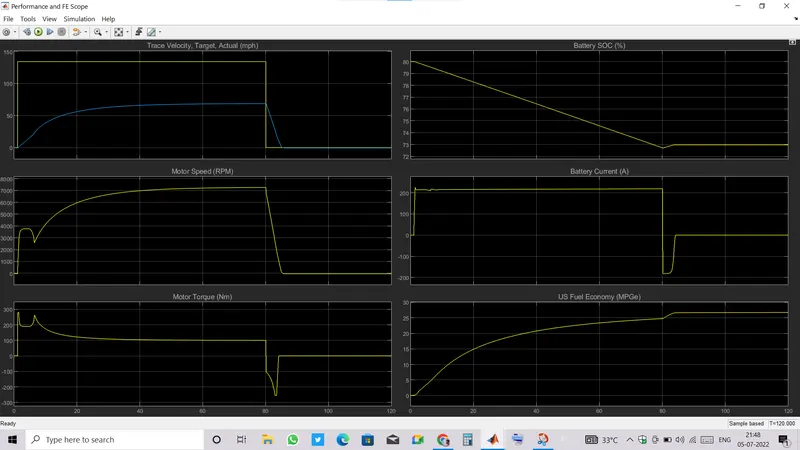
- In PURE EV , we have to compromise with speed when Grade and wind is introduced.
- We can see that Actual velocity is lagging Target velocity because of limitation in maximum current.
- Battery operation is limited by BMS , hence current is limited to safe value and the acceleration is also according to cuurent flow.
- When there is no further acceleration or we can say speed becomes constant then the battery current also become constant.
- SOC is falling down when vehicle is accelerated, and while deceleration SOC is buidling because of regenerative braking operation.
- During regenerative braking battery current becomes negative that means battery is charging at that time.
- Initially Motor torque is highest till motor gain much speed.
Comparison:
- Trace speed for both the Model is same.
- In PURE EV , SOC is fallen down to 73 % only but in case of HEV SOC Further fell to 55%.
- In PURE EV Motor speed curve is smooth, but in HEV we can see the engine speed is changing frequently, Similar is happening with motortorque also.
- In PURE EV, Battery is taking around 200 Ampere current while accelerating but in case of HEV the current drawn is nearly 500 Ampere which is very large.
- Miles per gallon calculation for PURE EV is in between 25-30 but in HEV it is only around 8 which is very less.
- Regenerative operation is more effective in HEV model because motor generator set is present and battery can be charged by either motor/generator or by engine while running.