Week-11 Challenge: Braking
Challenge01: For a defined driving cycle, calculate the energy required for braking.
- Forming a drive cycle by using excel sheet.

- After that open MATLAB script and import this excel file to workspace.
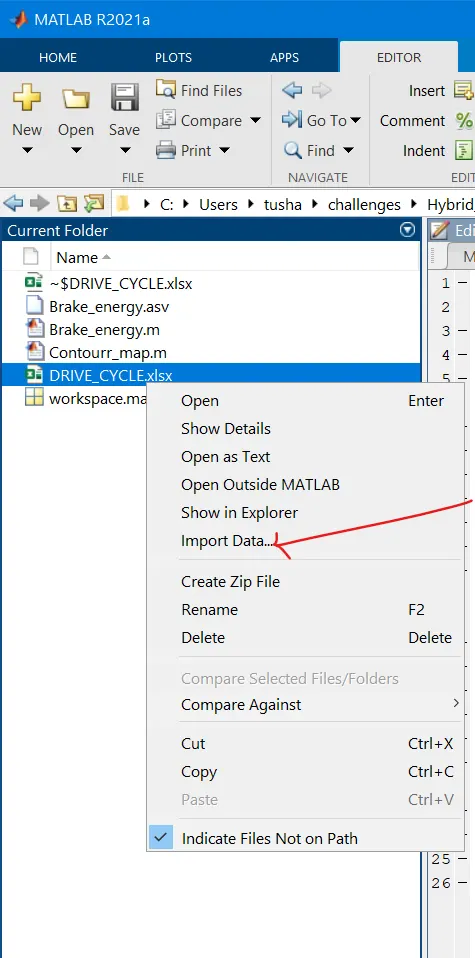
- Import data from drive_cycle to workspace as shown in image below.
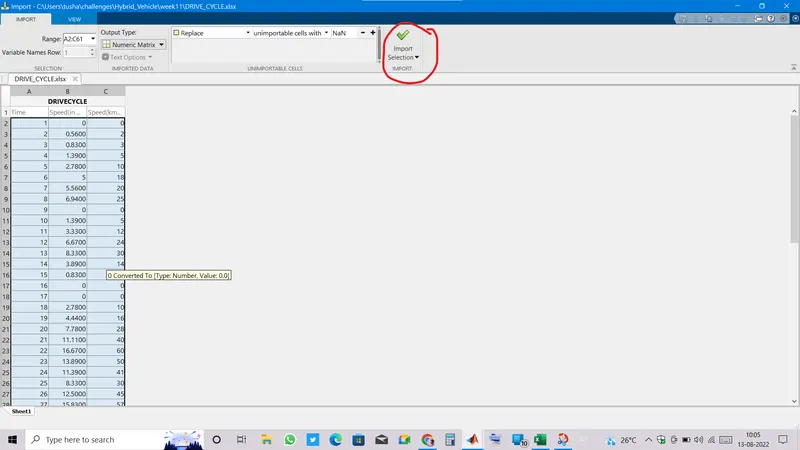
- Data is succesfully imported into workspace, now writing script for braking energy calculation.
- \
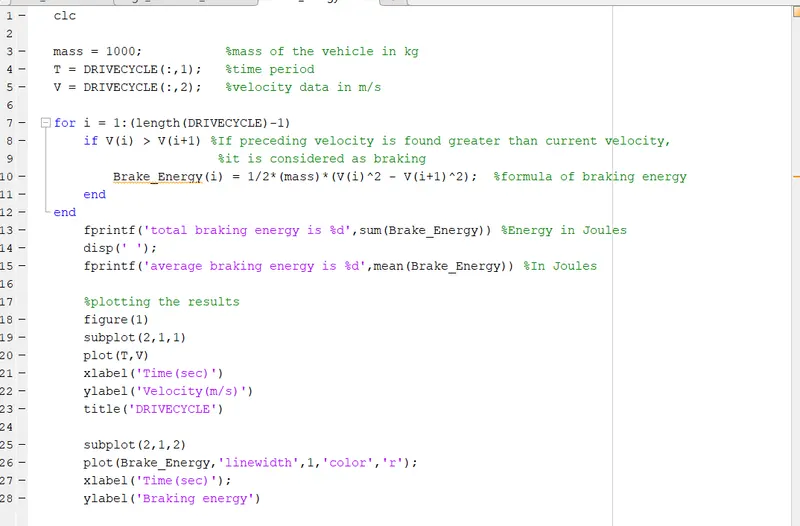
- Braking energy is only calculated whenever the vehicle retards or the velocity of vehicle is less than previous velocity.
RESULT:
- Run the script file to get plot of Dirve cycle and Braking energy.
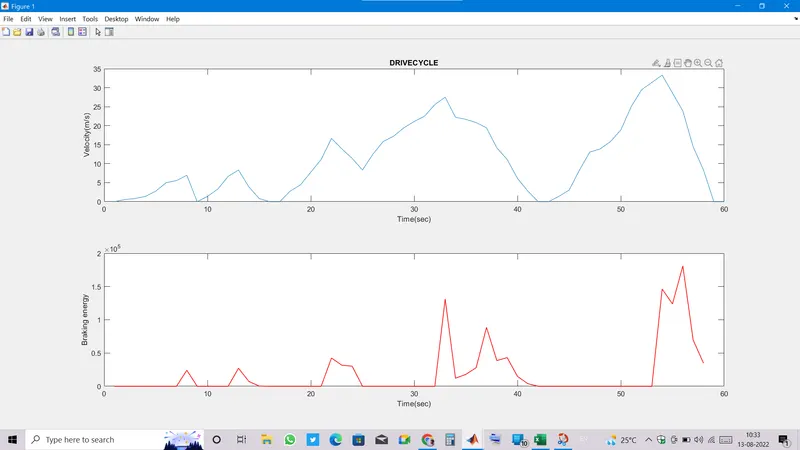
- We can see that Braking energy is not cal culculated when vehicle is retarding.
- Total braking energy iscalculated by using sum() function, and average braking energy is calculated by using mean() function as we used in script.
Challenge02:
1).Why electric motor can’t develop braking torque at high speed similar to starting?
- lWe already know how the induction motor Torque speed curve looks likep
- There is highest relative motion between RMF and rotor at stanstill condition so that there maximum emf getting induced in rotor thus motor start rotating.
- But when the rotor runs near to synchronous speed, there will be less difference between the synchronous speed and rotor speed, so the Slip goes nearly zero hence developed torque will decrease and the rotor will slow down.
- When rotor starts rotating with more than synchronius speed, the induced emf direction also get reversed and hence the induced current direction reversed which result in the torque producing in opposite direction.
- In EVs there are some constraints over braking operation of motor.
- Regenarative braking is being used in EVs so that during braking period the battery is getting charged with the power which is fed back from motor to battery. But we know that battery has limit in charging current and the fed back power depends upon current flowing, hence we can't let current to cross its limit thus we have to compromise with the torque.
- Also we require a bidirectional power converter which allows power to flow in either direction.
- The operation of motor above synchronous speed is constant power(P = T.w) region so increasing speed of motor above synchronous speed result into reduction in torque in order to maintain the power constant.
2).How electric and mechanical brakes are coordinated?
- When vehicle is running at high speed, brake pedal is applied to slow down vehicle , the control signal from brake pedal is transfered to controller that to observe how effectively brake pedal are being pressed.
- According to the intensity of brake pedal input and how much power is required by battery to get its capacity ,the controller(ECU) decides how much electric braking is required to stop vehicle within short time range so the control signal again transferd to motor.
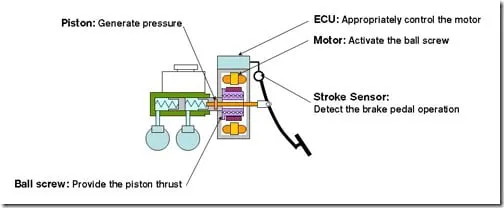
- The simple funda of Electric driven intelligent Braking(EDIB) is when vehicle is at high speed, more mechanical brake(brake cylinders are controlled by wires or we can say by motor itself) with less electric brake is applied together and when vehicle retards the effect of regenerative braking increases with releasing brake pedal and the lost energy is recovered by regenarative braking.
Challenge03: Make a MATLAB program which plots contour of given motor speed, torque and efficiency values. Attach the code as a .m file attach a screenshot of all the plots.
- To calculated efficiency we need to calculate losses happening in motor. Motor losses are sum of coppper losses , iron losses , windage losses and some constant loss.
- These losses when subtracted from input power give output power.
- Copper loss is proportional to square of torque and iron loss is proportional to the speed, similarly windage losses are proportional to the cube of speed and the proportionality constants are calculated by experiments.
- Let's write m script and plot contour.
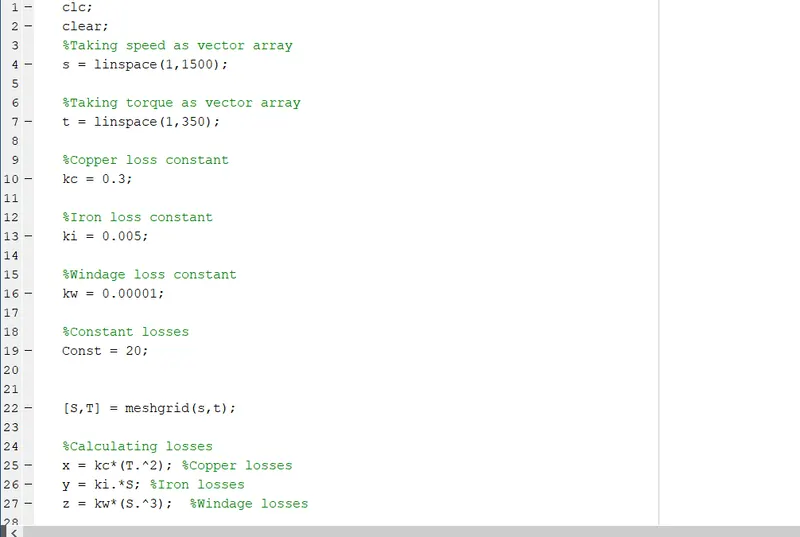
- Provide speed and torque in form of array vector.
- Also povide proportional constants for losses calculation.
- Then calculate losses by writing equations as shown below.
- Now calculating output power by multiplying instantaneous values of Torque and speed .
- Input power is calculated by adding losses into output power.
- We have input and output power ,by dividing output power from input power we can get efficiency.
- For efficiency contour lines, providing some efficiency values so that we got traces according to provided value. For example provided value for contour line is 0.91 so in plot we will get a single contour line which is traced by connecting all the point with efficiency 0.91
- Similary we can trace curve for different output power (8kW and 10kW).
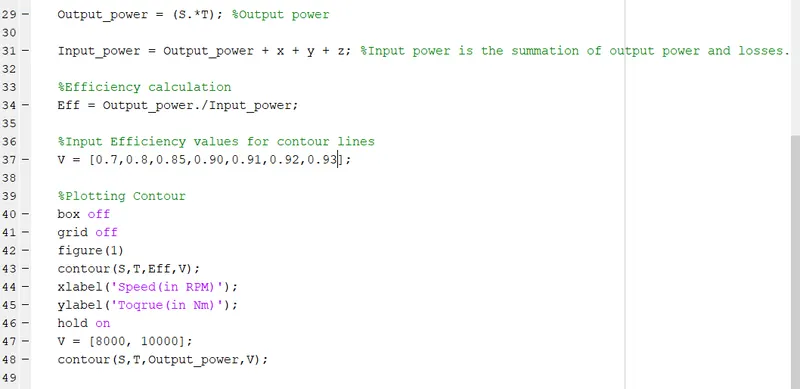
- M-script is all set to run and observe the contour plot.
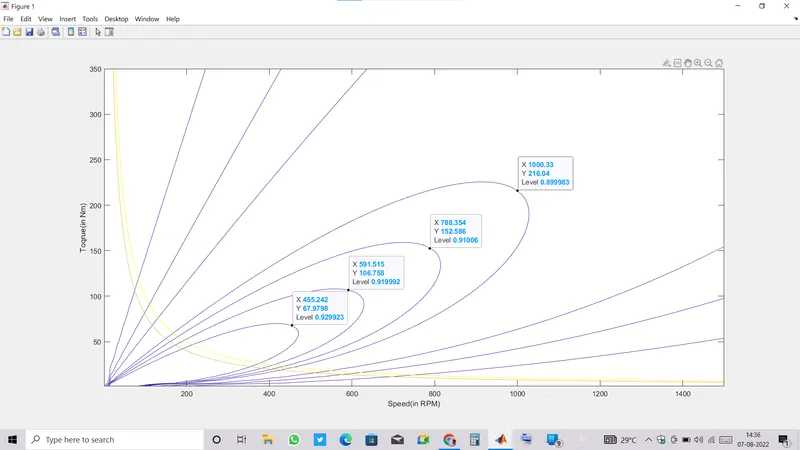
- We can see the coutour line with smaller loop is showing highest efficiency and as loops are expanding the efficiency is getting reduced.
- This is because of losses, the losses are dependant either on speed or on torque, at lower value of speed and torque lower the losses hence higher the efficiency.
- There are two yellow lines showing output power of 8kW and 10kW.