Week - 4
Challenge01: Implementing control logic of a “washing machine” using Stateflow
- Open a blank simulink model.
- Add a chart as shown in image below.
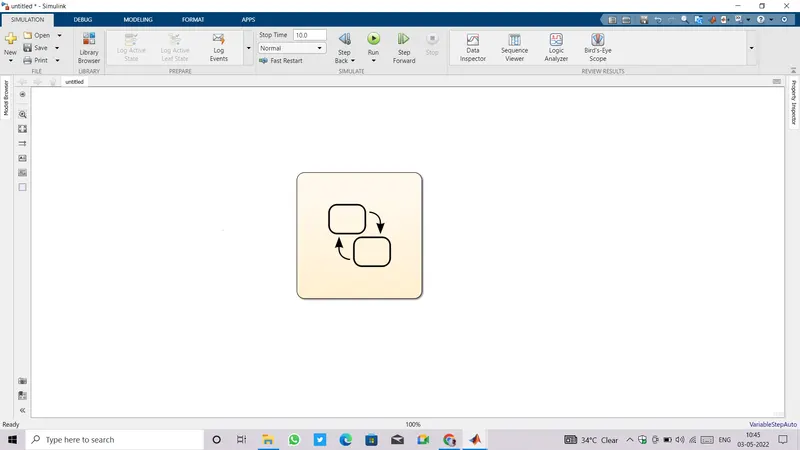
- Double click on chart block, it'll direct us inside the chart window which looks like shown below.
- Now start adding states as per given sequence such that first comes Power supply then Water supply after it Soaking and washing at last then Rinsing and dryer.
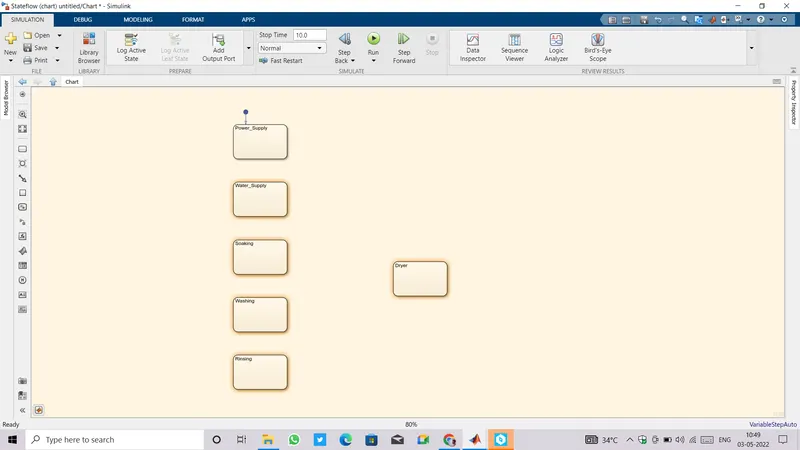
- The first one with an arrow and blue circle is a default entry state.
- Now goto Model explorer to add inputs and outputs for given system.
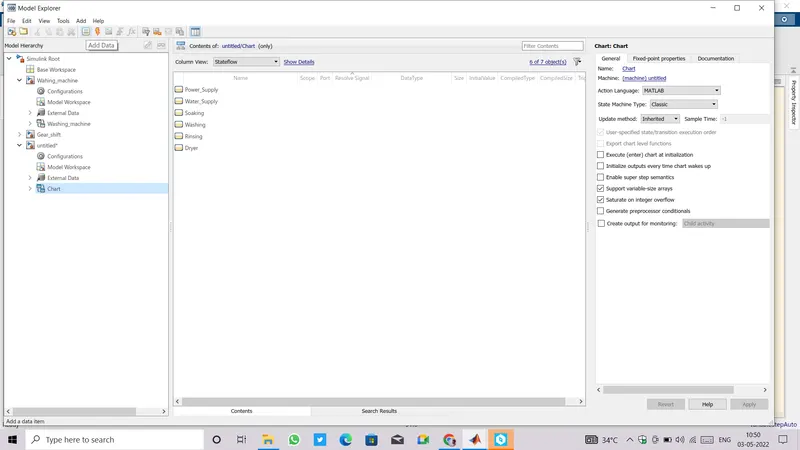
- At the very top left corner of model explorer window, there we can find tool bar with icons.
- Find Add Data icon and click on it as many times as the numbers of inputs and outputs that we have to provide.
- We require two inputs, one for power supply and other for water supply.
- Also there will be two outputs states which we use to give indication for Power and Water supply.
- So we have four input+output in total, so add four Data in chart by clicking four times on Add Data.
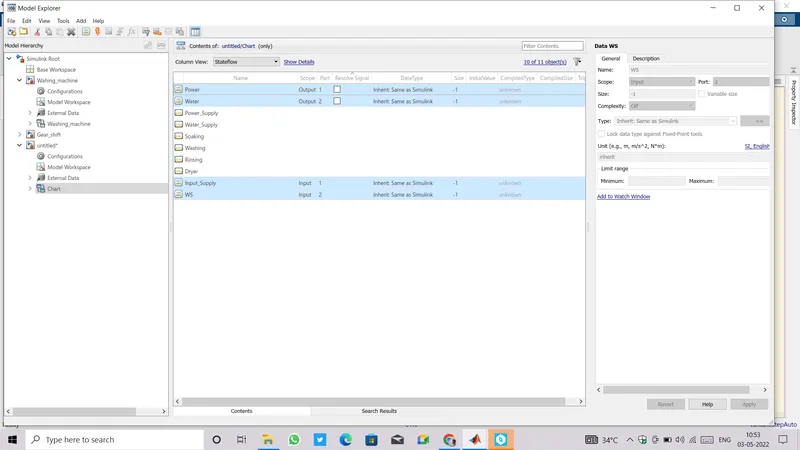
- Now come back to chart window, start assigning the entry and exit state value to each state block with transition condition from one state to another state.
- First for Power supply state entry state value will be Power_Supply=0; and exit state will be Power_Supply=1; and the transition condition in either direction between Power supply and Water Supply state will be Input_Supply==1 and Input_supply==0 respectively.
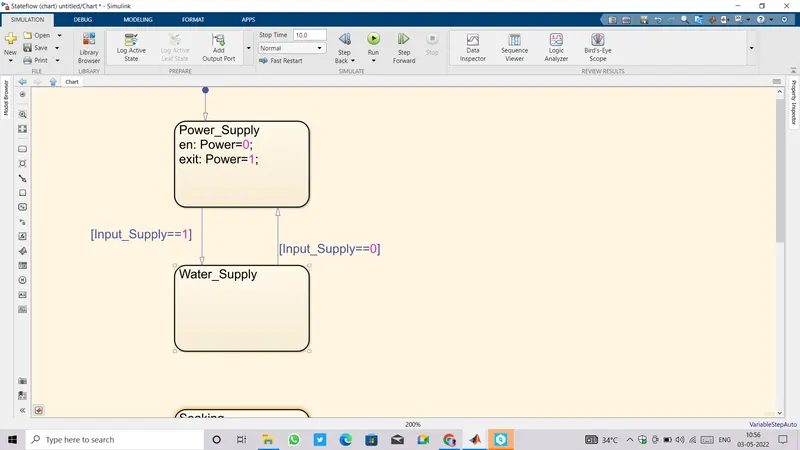
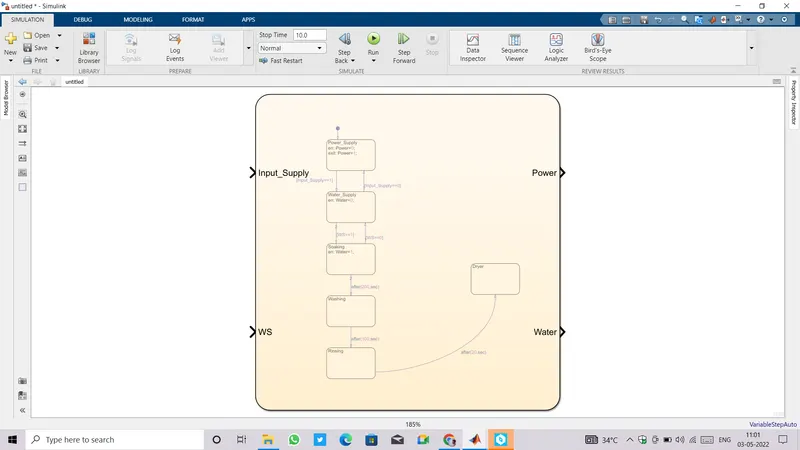
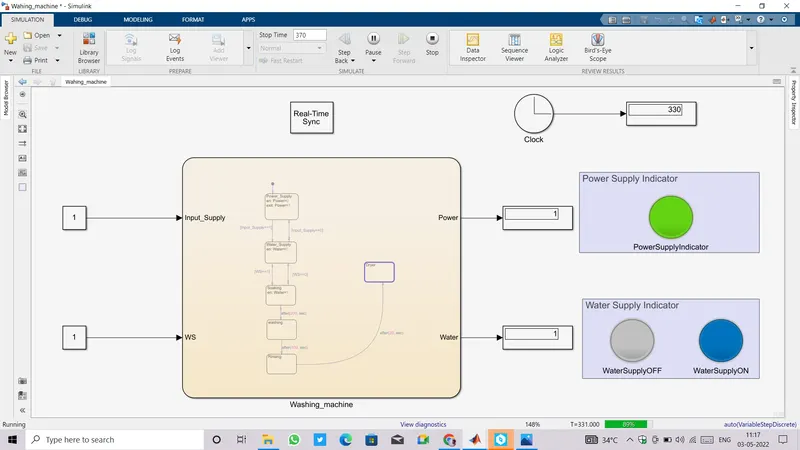
- Similarly, entry state and transition conditions for all remaininig states are shown in images below.
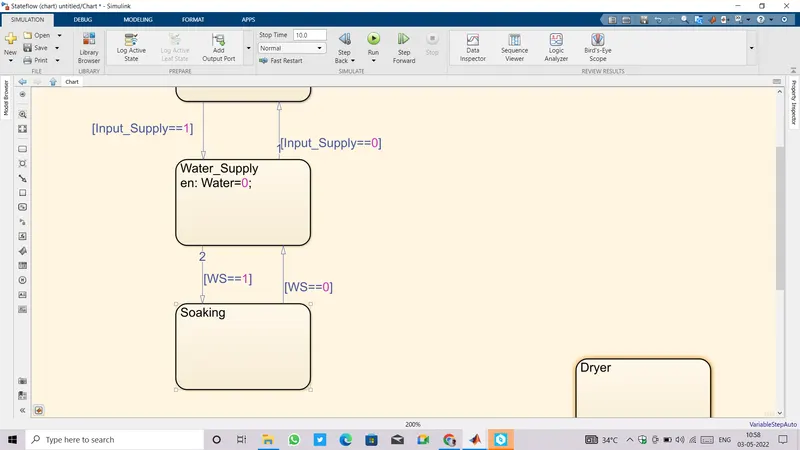
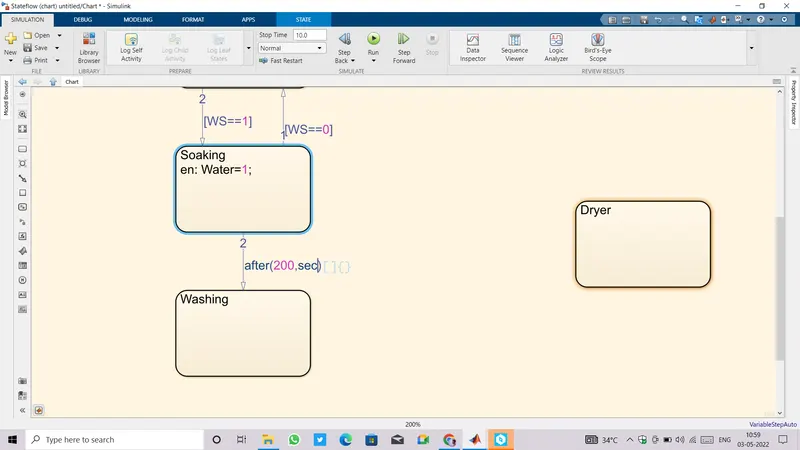
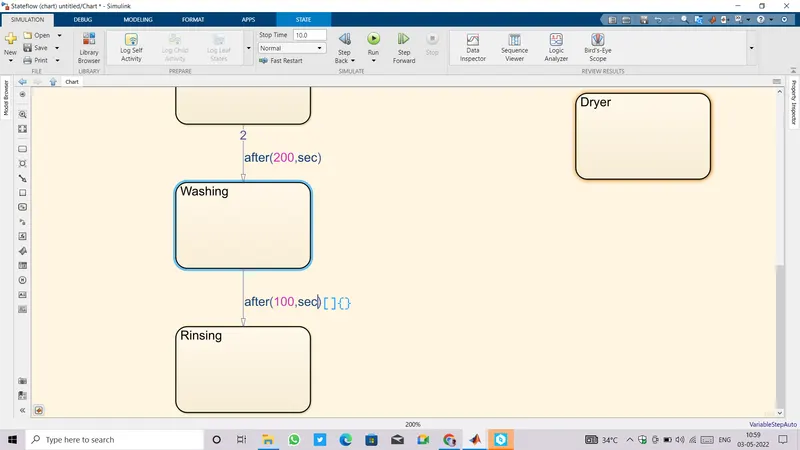
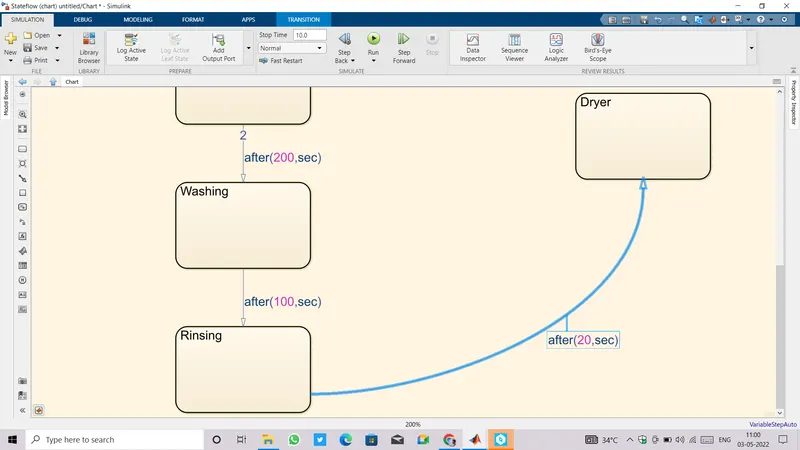
- We have made the flowchart as per requirement.
- The simulation time should be the whole sum of operating time of each state that is 200+100+20+50=370 secs.
- The chart finally looks like shown below.
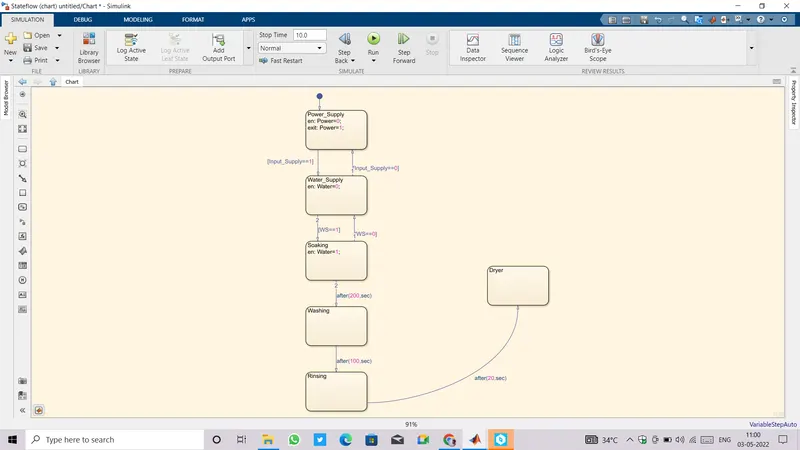
- Come out of chart, we will find the same input and output ports which we already defined in model explorer window early stages.
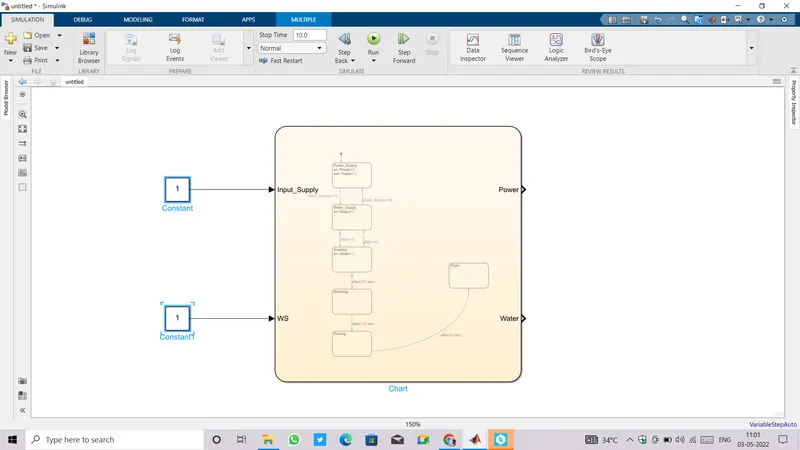
- Connect constant blocks to each input so that we can provide zero or one manually to test whether our system is working or not.
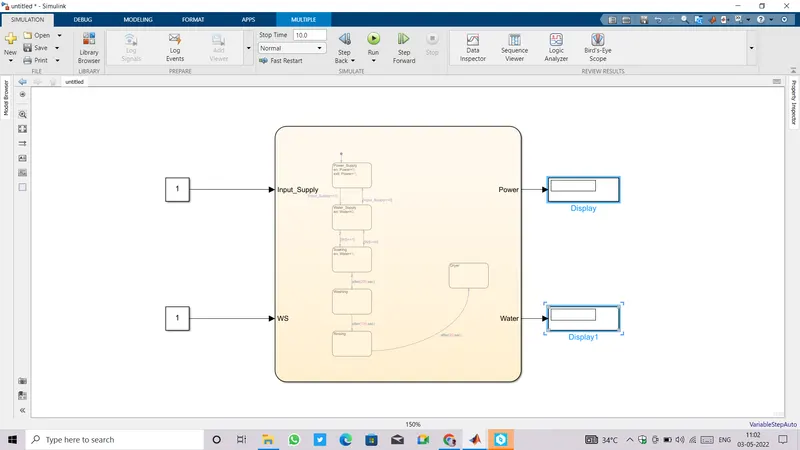
- Also connect display at both output ports.
- Now add three lamps which are to be used as indicator of power supply and water supply.
- One is for power supply indication and another two are for water supply ON and OFF indication.
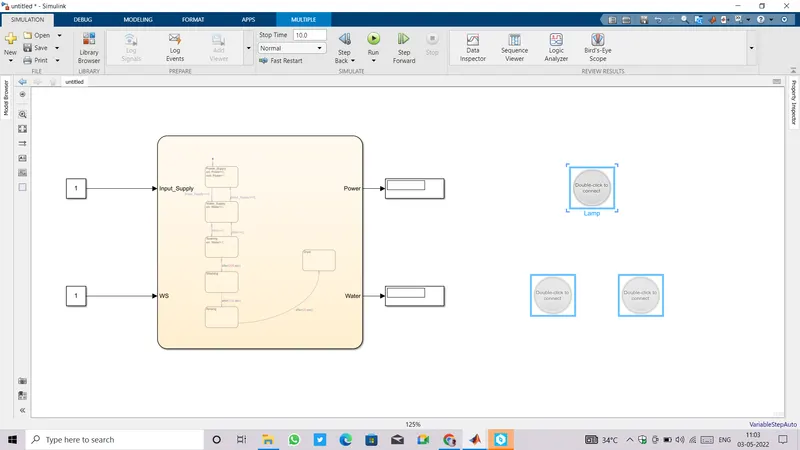
- To connect all lamps with their proper match, tap on lamp block , a chain like symbol will appear on the top of that. block.
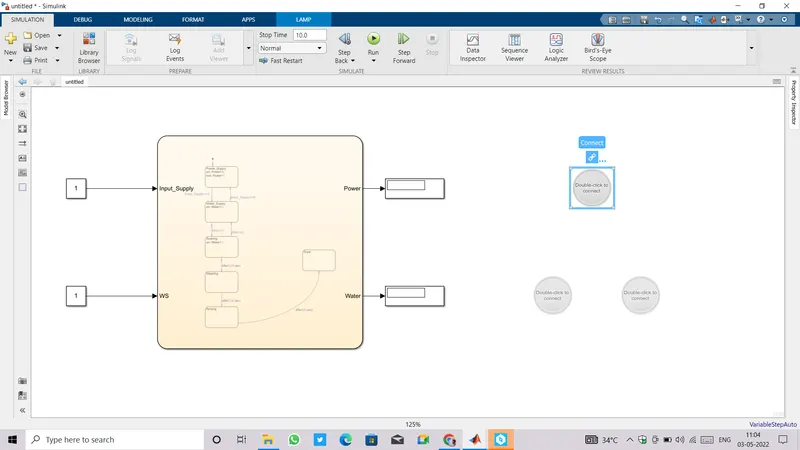
- Click on connect symbol and then go inside chart.
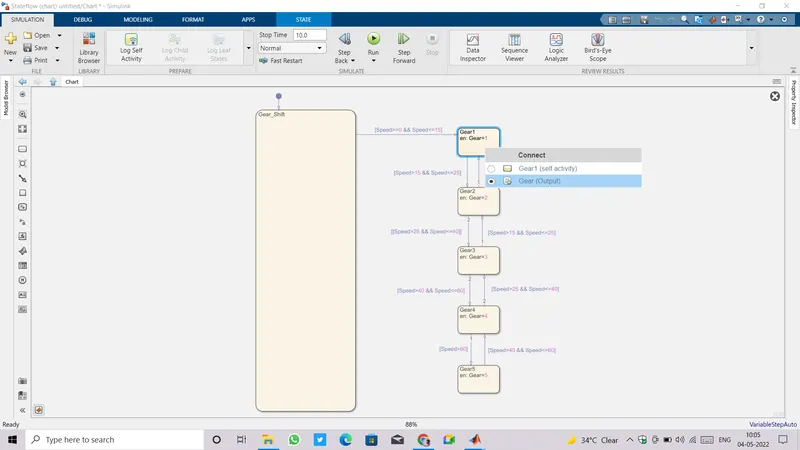
- Select click on any state that you want to connect the lamp, it'll shown some options choose the right one.
- For example here we are connecting a lamp for Power Supply indication.
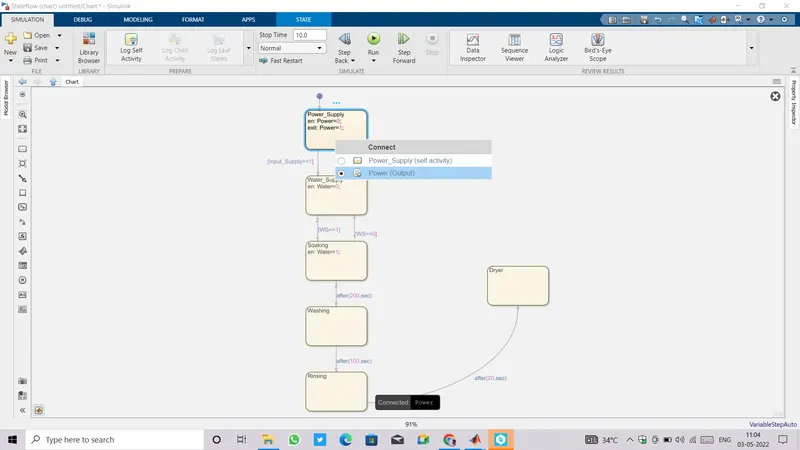
- Do similar drill with remaining two lamps and connect them with water supply ON and OFF.
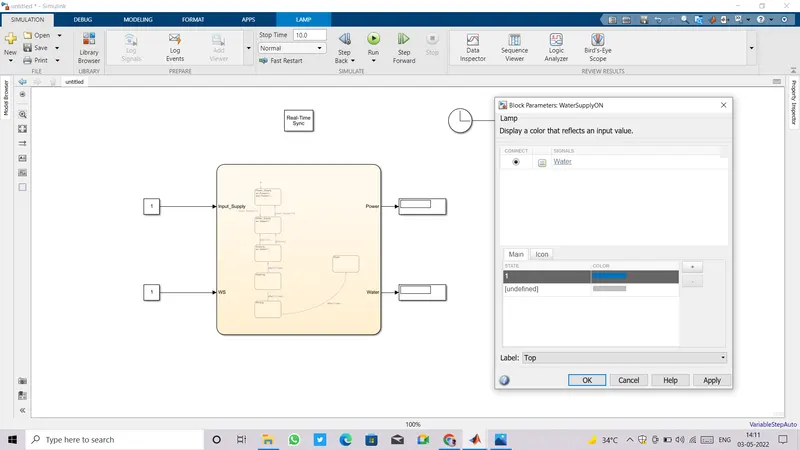
- After connecting all lamps , double click on each lamp and set the color and State for which it is supposed to glow.
- Setting for all three lamps is shown below.
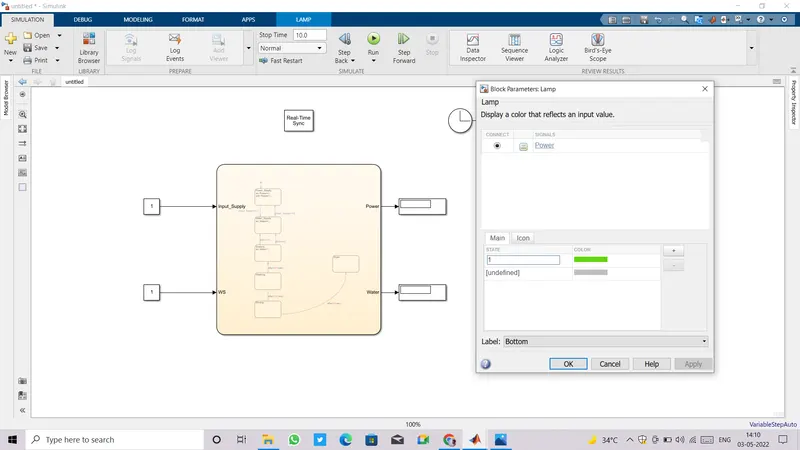
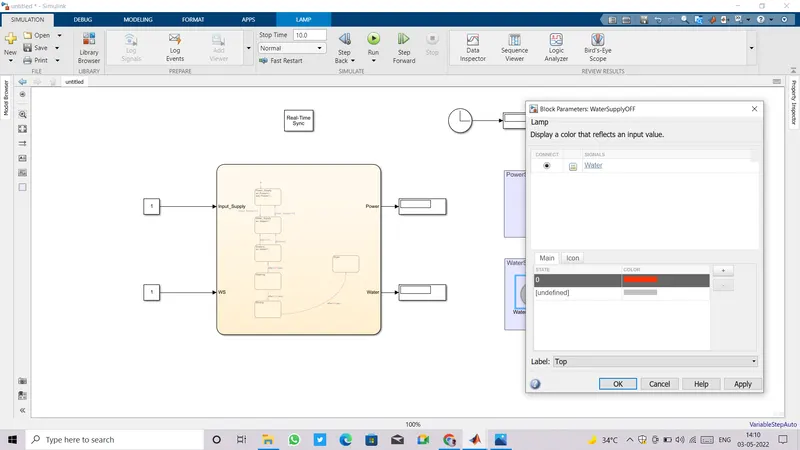
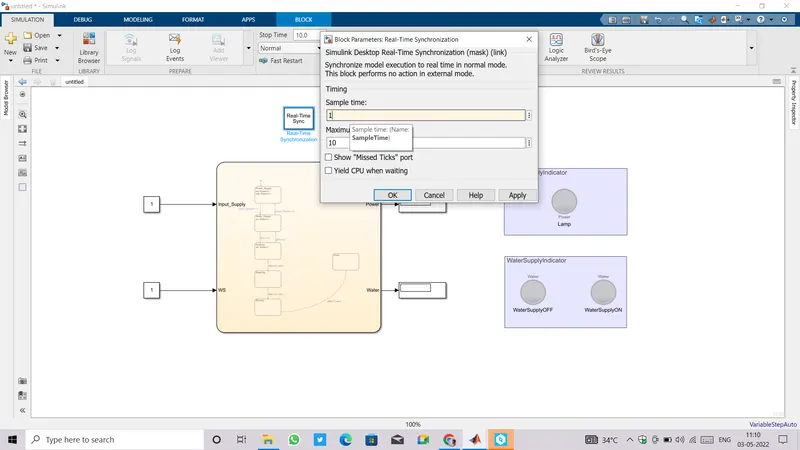
- Simulink run the model as fast as it can, it does not synchronize with real time by default, so for that purpose we need to add a block named 'Real time synchronization'.
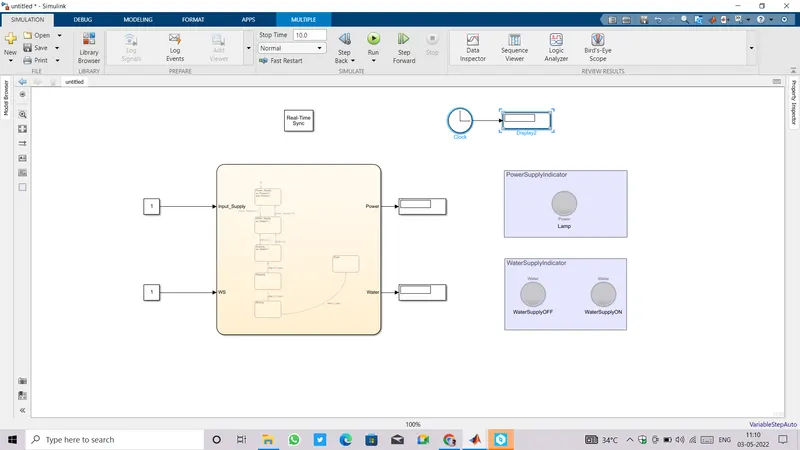
- Add a clcok with a display to observe the time.
- Time to test our system by changing input values .
- First give 0 and 0 to both Input supply and WS and run the simulation, we found that both display showing 0 and a lamp for Power supply and Water_supply_ON is off and lamp for Water_supply_OFF is glowing in red color.
- One more thing we observed that flowchart is stopped at Power supply state.
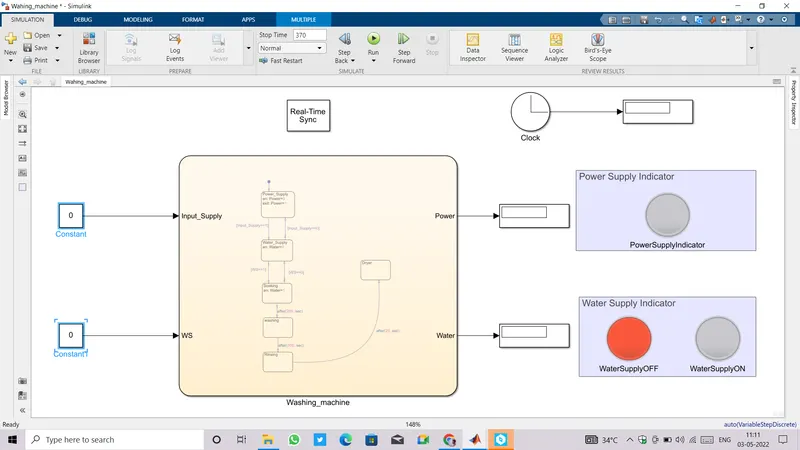
- Now change the input supply from 0 to 1 and leave WS as it is (0).
- Run the simulation, we found that display for power is changed to 1 and lamp is blowing in green color, that means power is available but the water supply still not provided so lamp is glowing red.
- In Flowchart, we can see it is stopped at water supply with entry value 0 bacause no water supply is given from input side.
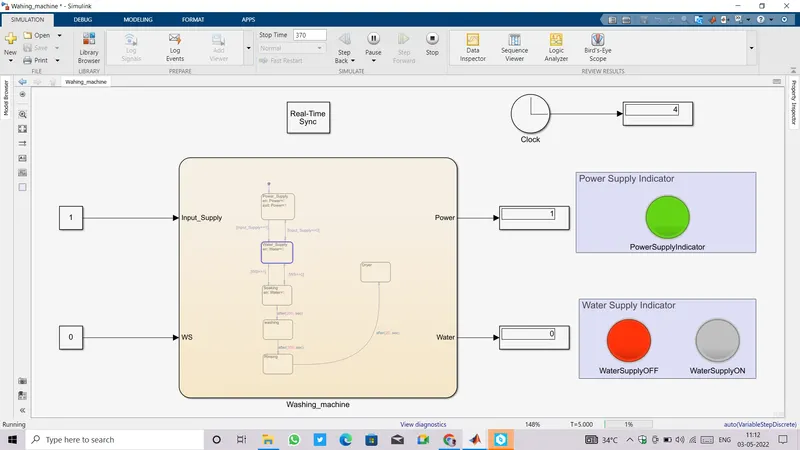
- Now give 1 at both the inputs.
- Run the simulation, we found 1 at both the displays and green lamp is glowing which means power is available and this time a blue lamp also glowing which means water supply available.
- The flowchart is stucked at Soaking state,it'll be there till 200 sec as the soaking time was set to 200 secs, after that flow will shift to Washing state.
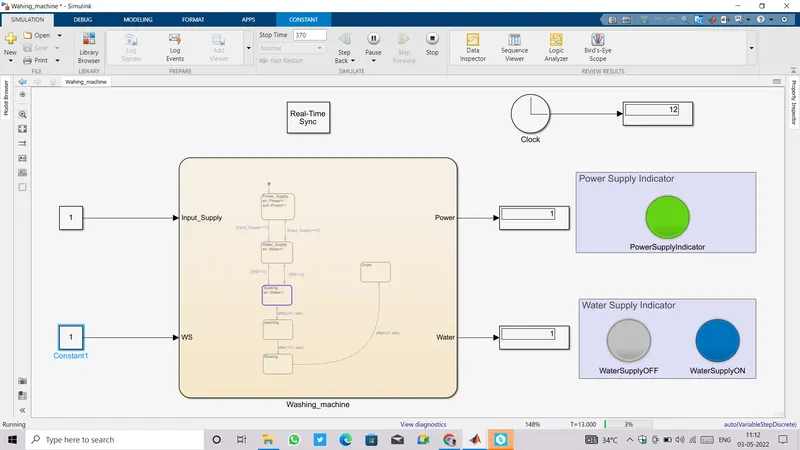
- After 200 secs flow shifted to Washing state.
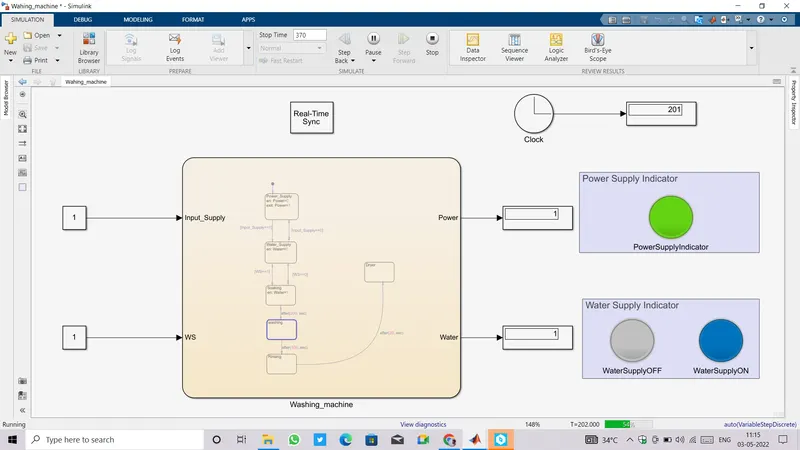
- Washing operation will continue for 100 secs.
- Then after this 100 secs (300 secs cumulatively), Rinsing operation will start.
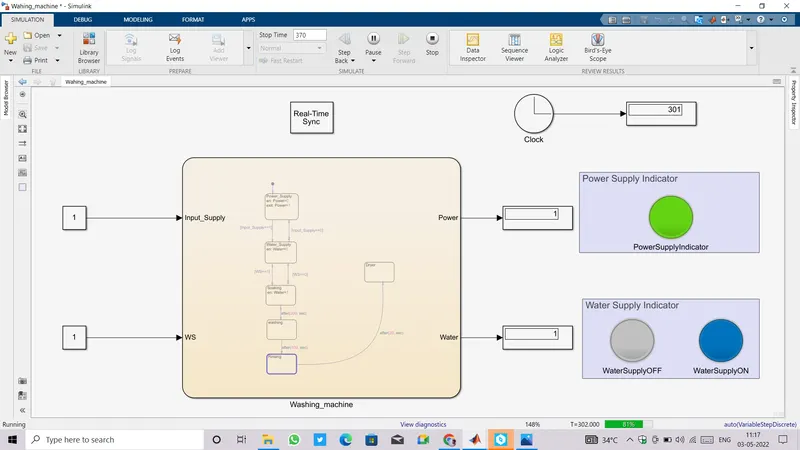
- Flow will remain for 20 secs at Rinsing state, and then it Dryer will ooperate after 320 secs cumulatively.
- Dryer will operate for 50 secs till 370 cumulative secs.
Challenge02: Making a Simulink chart for the “Gear shift” logic.
Given:
Speed Range(kmph) Gear
0 to 15 1
16 to 25 2
26 to 40 3
41 to 60 4
Above 61 5
- Open a blank simulink model.
- Add a Chart into it.
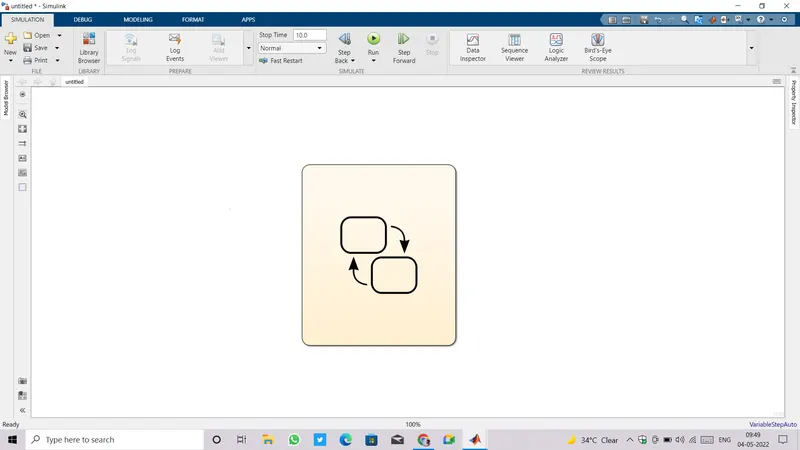
- Double click on chart and go inside it.
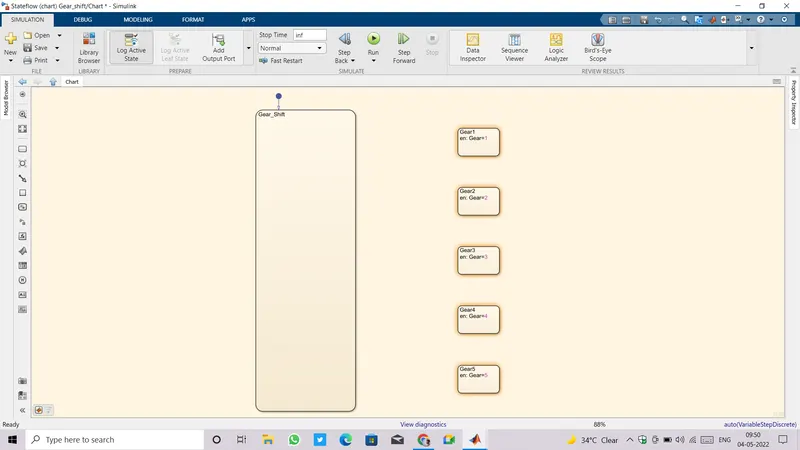
- It willl look like shown below.
- Start adding States as per requirement.
- There will be one default state and five more states for each gear (from gear 1 to 5).
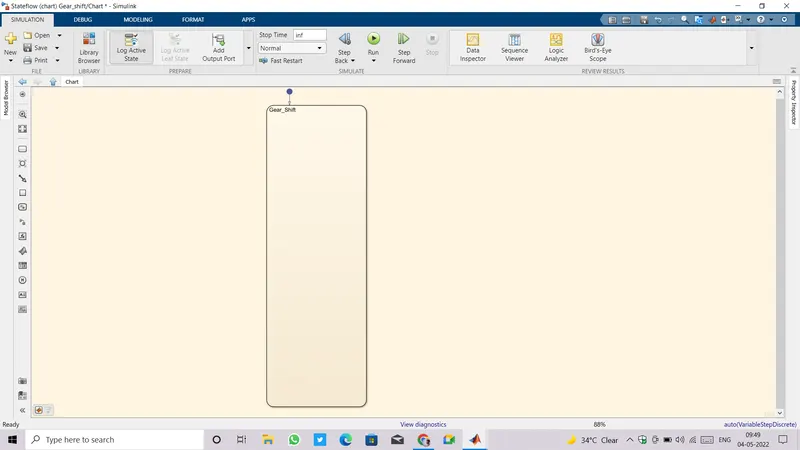
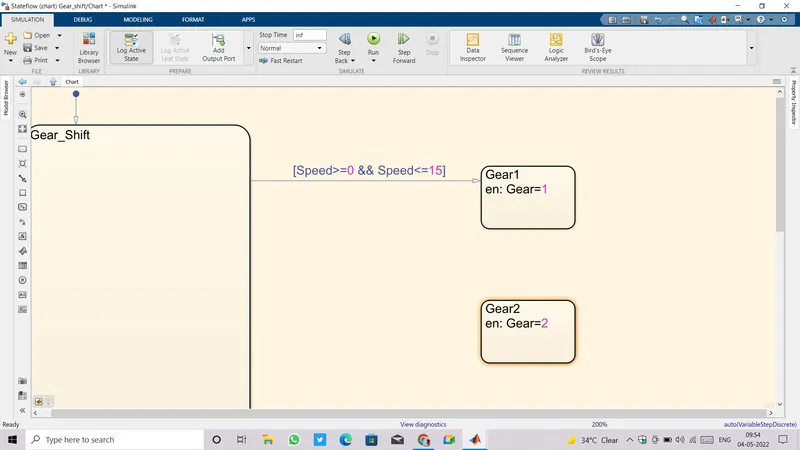
- There will be transition conditions from one state to other , starting from Default state to Gear1 state, transition condition will be Speed>=0 && Speed<=15 kmph.
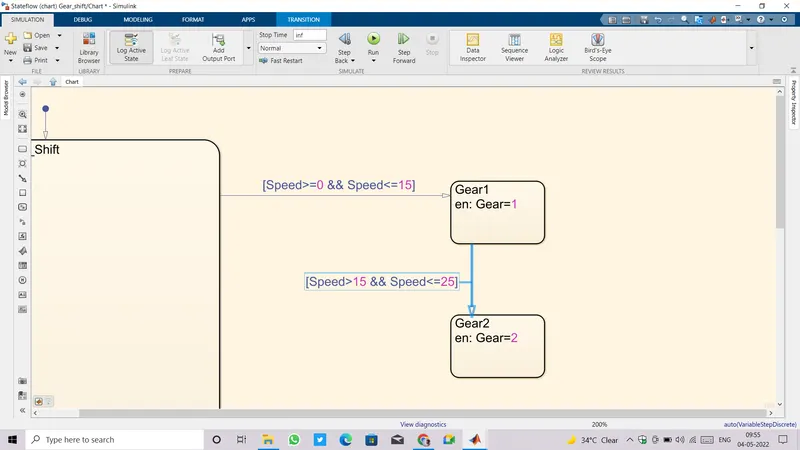
- Similarly all the transition conditions for gear shifting with corresponding states are shown in images below.
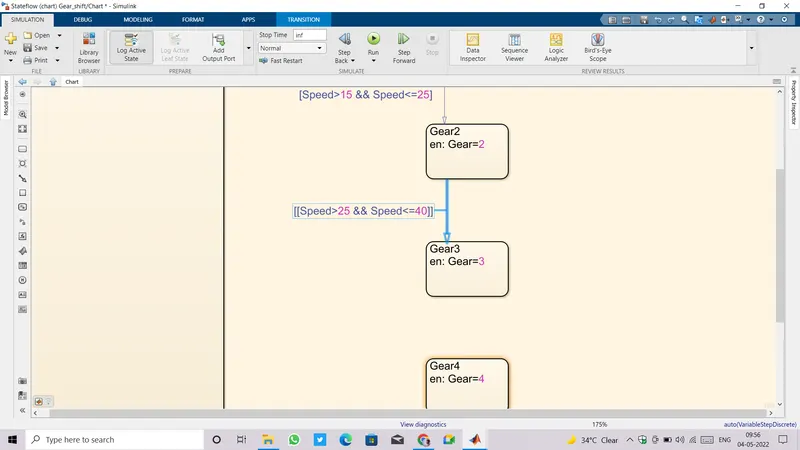
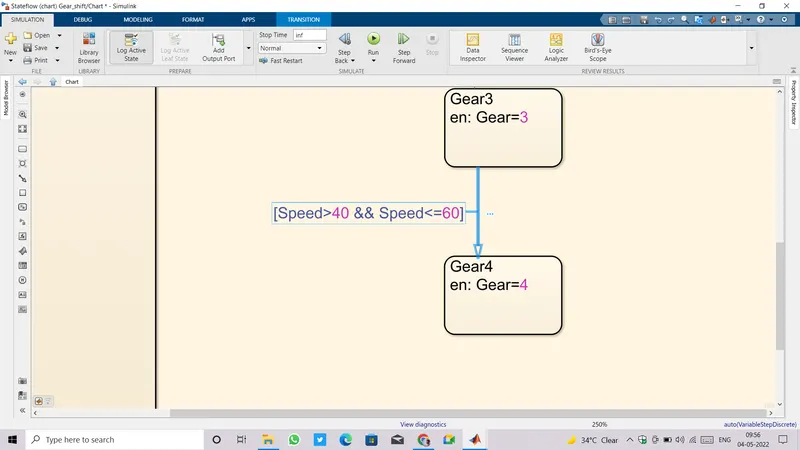
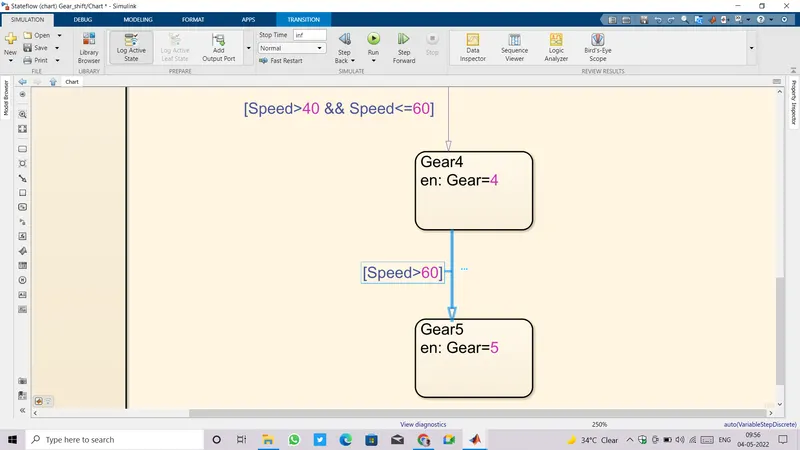
- Transition conditions must be bidirectional,if not then once speed got increased and gear shifted to the top gear state, it 'll not come back to any previous gear state even speed decreases.
- Starting from Gear5, transitions are shown in images given below.
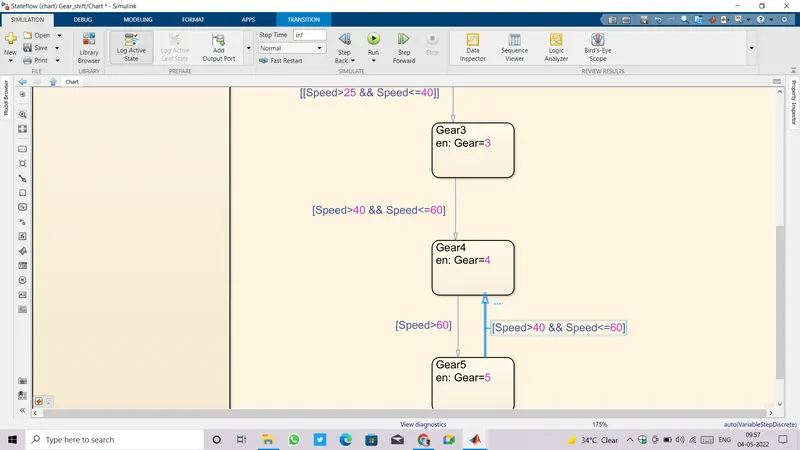
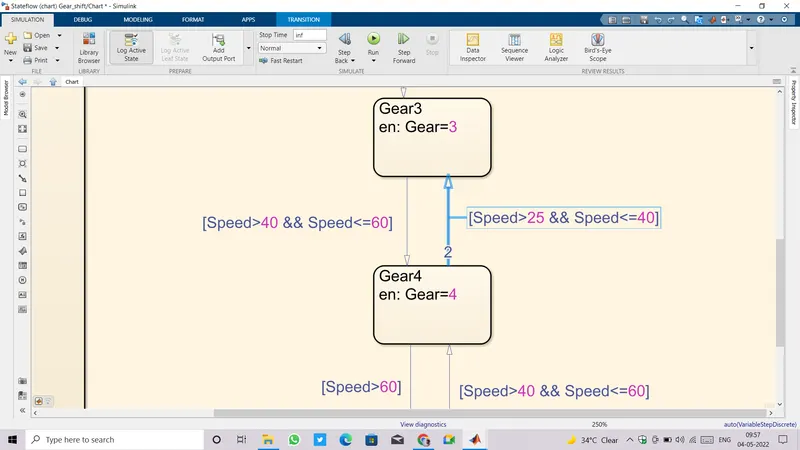
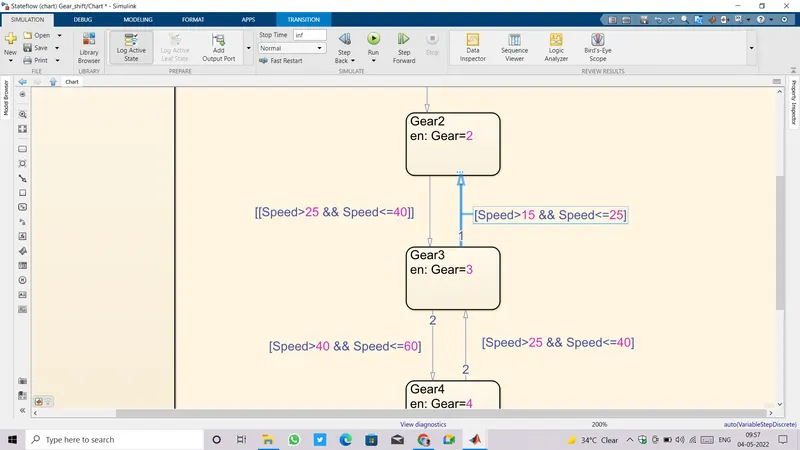
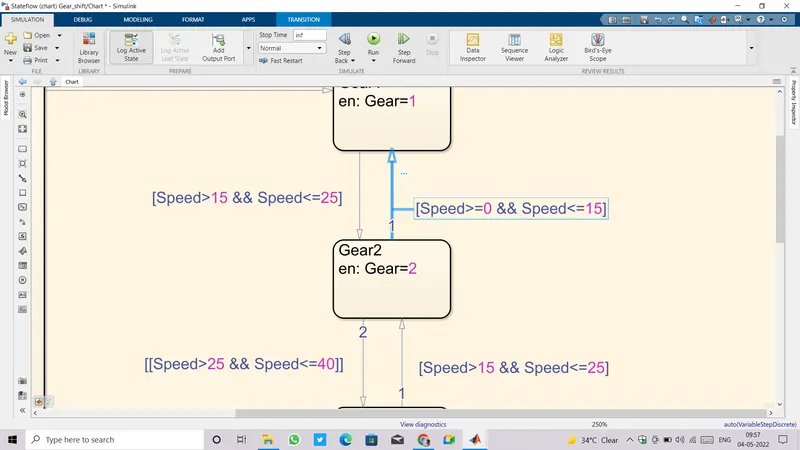
- One important thing to observe here that we provided transitions between gears no direct transitions are provided to any gear from default state because we know that Speed increases from zero and gears are shifted accordingly. There is no sense in starting from Gear3 or Gear4 or any except gear1.
- vehicle is considered as standstill and then speed increases gradually from zero and gears are shifted in sequence no gear supposed to be skipped.
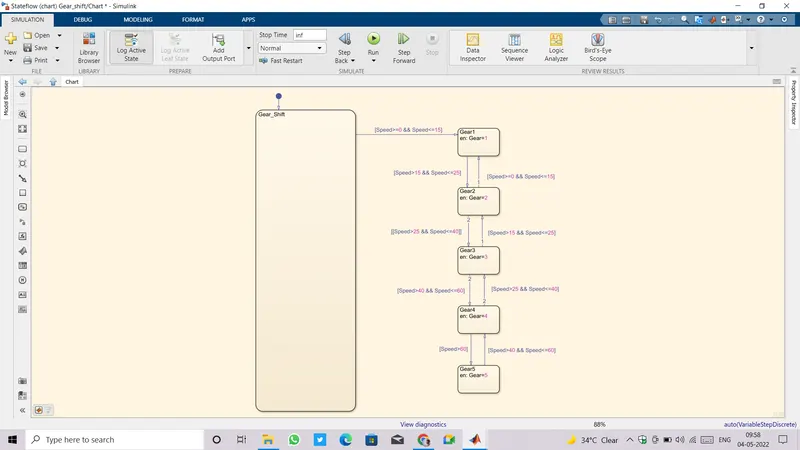
- Now goto model explorer window to define inputs and outputs of charts.
- At the very top left corner of model explorer window, we can see the tool bar pallete there.
- Search for Add Data and click on it as many times as number of inputs and outputs to be defined.
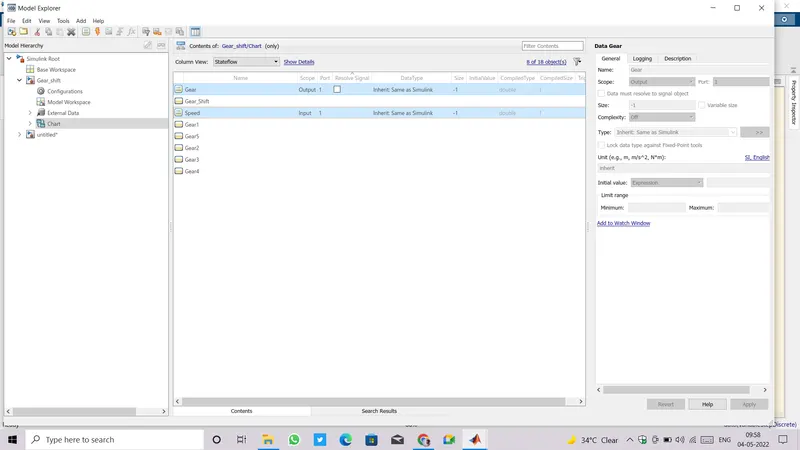
- Come back to the model, outside the chart we can see input and output ports are now available there.
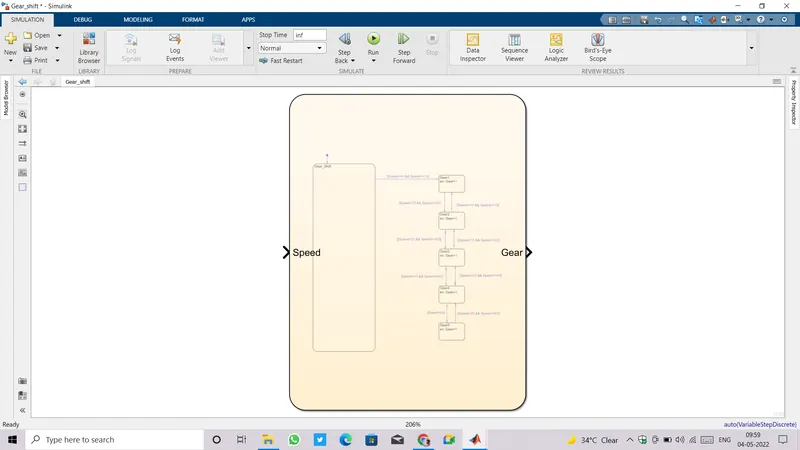
- Connect a slider gain a input port as we are asked to change the speed input while the simulation is running.
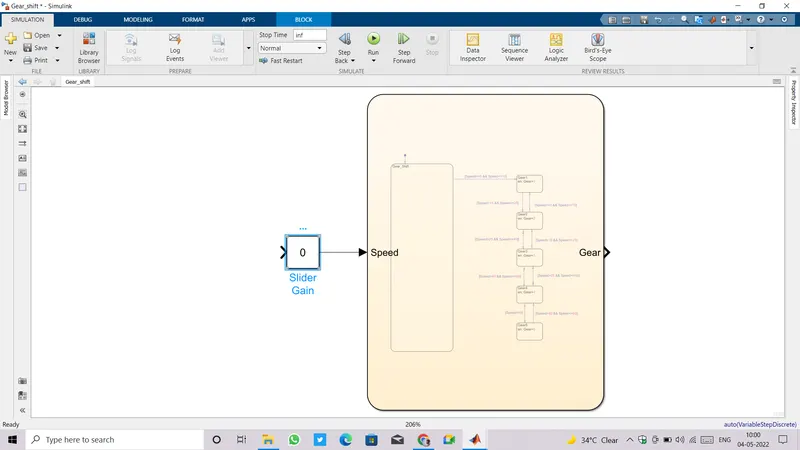
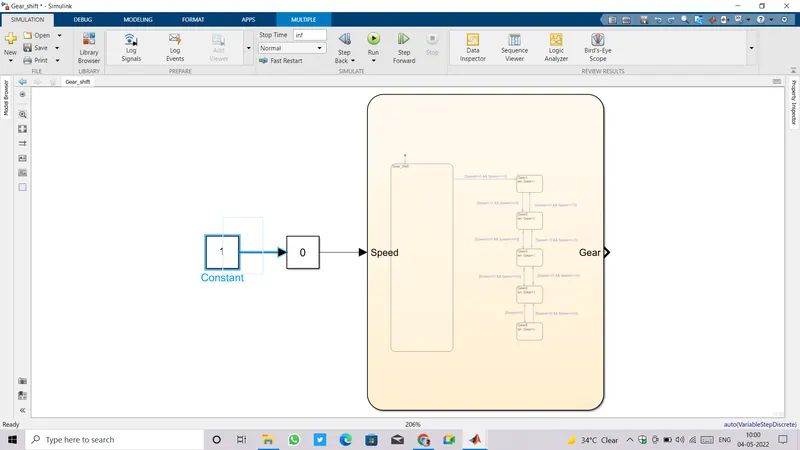
- Provide a constant block ,before Slider gain, with value 1.
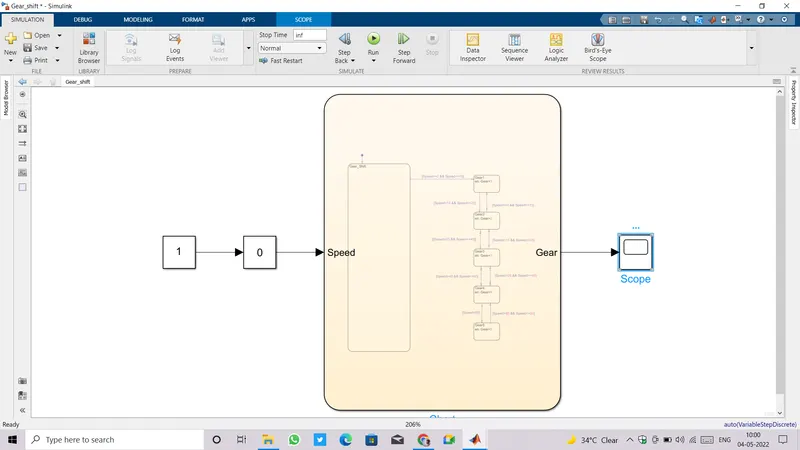
- Now Connecting a scope so that gear number can be displayed different speeds in form of a plot.
- We are adding lamps in addition to indicate the gear number over different speeds.
- Add five lamps, one for each gear.
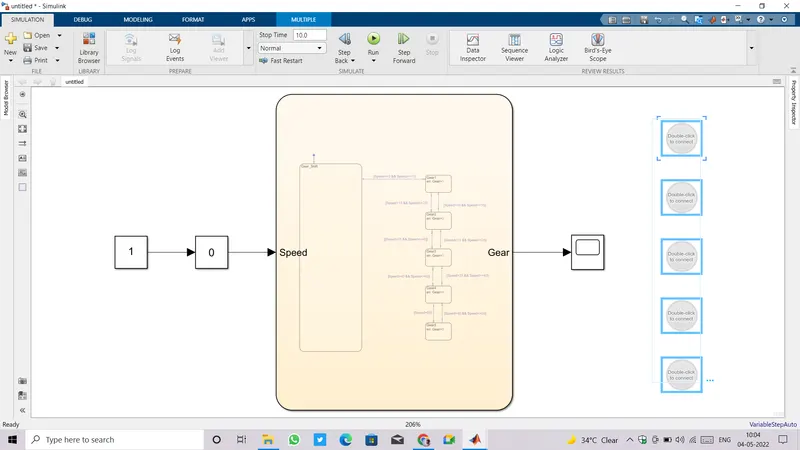
- To connect lamp click once on the lamp block and see a chain like symbol appears at the top of that block.
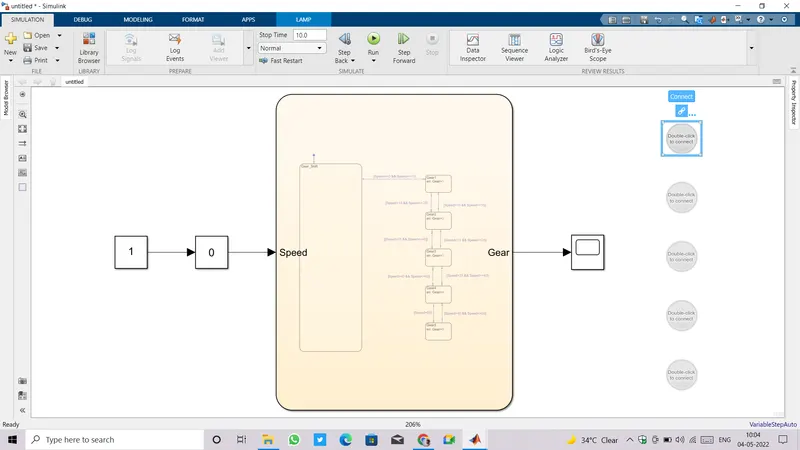
- Click on connect and then goto particular block inside the chart that is appropriate.
- After connecting lamp double click on it and set the parameters lke state and color of that lamp.
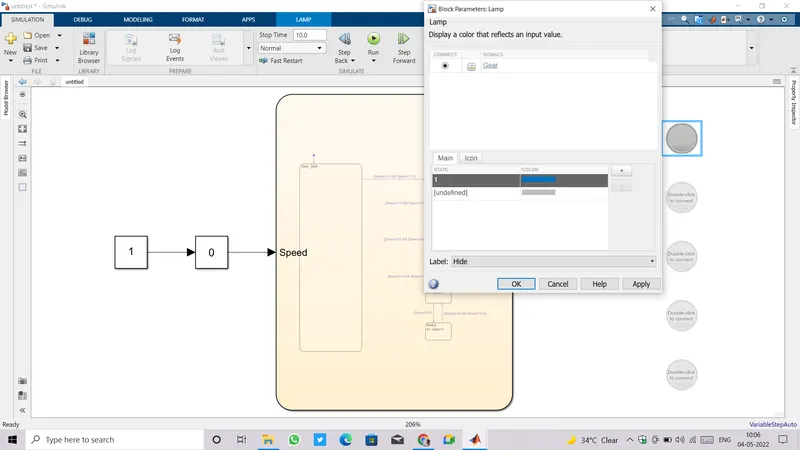
- Do the same drill with all lamps.
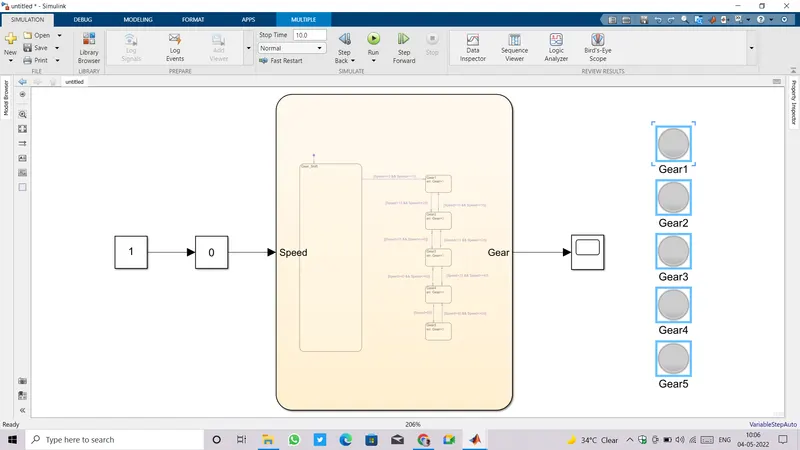
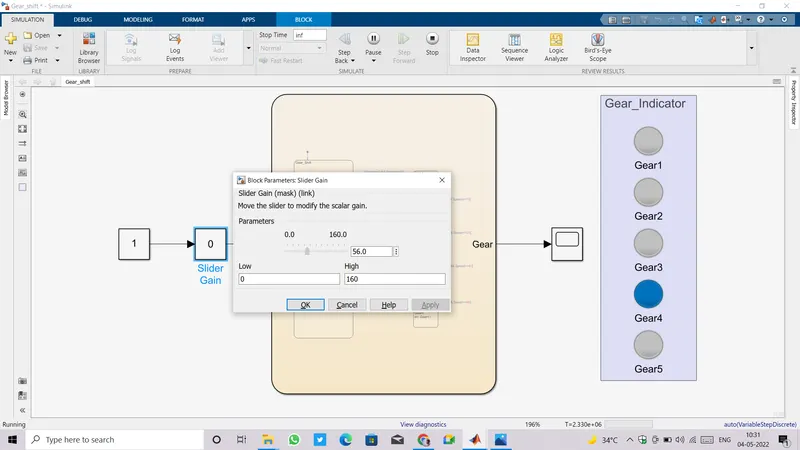
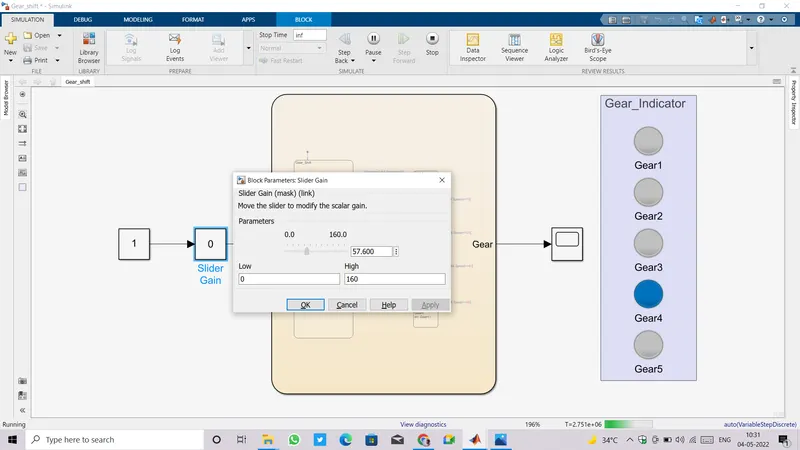
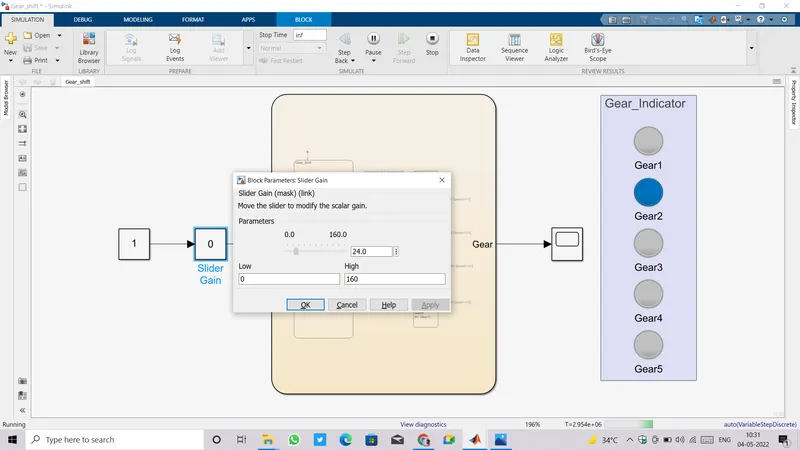
- States of Lamp is set such that when Gear becomes 1 1st lamp will glow ,when Gear becomes 2 2nd lamp will glow and so on.
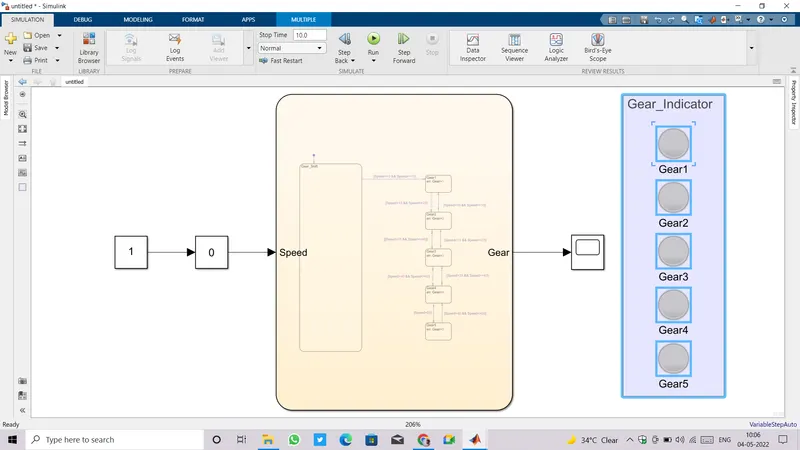
- Put all lamps inside an area and name it Gear Indicator.
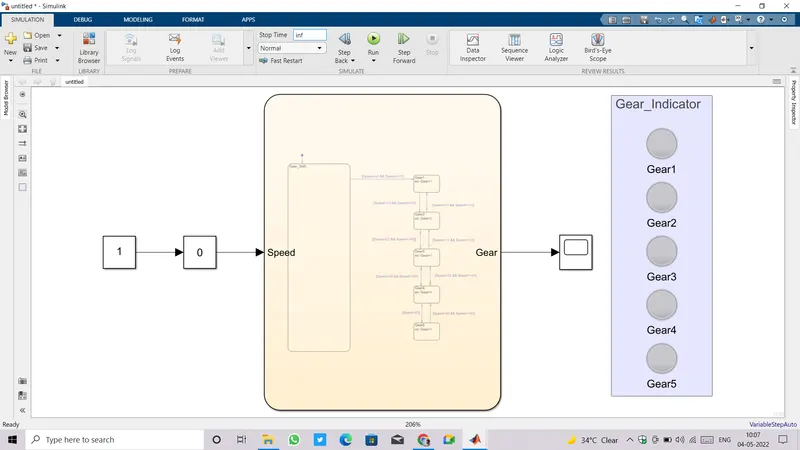
- We are going to change the speed input while running simulation for that purpose we need to set simulation run time to infinte.
- Now run the simulation and open the slider gain to change the input speed.
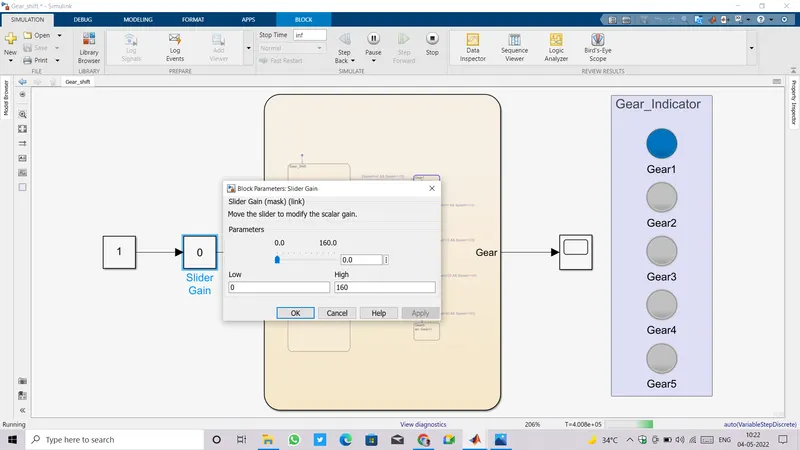
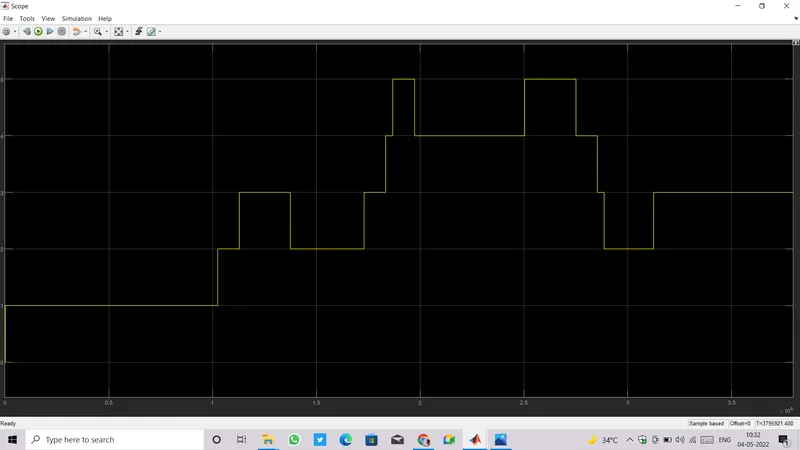
- We can also see the Gear number in scope block.