Project
Project:
- ATV are made to travel on off roads or rough, rugged areas where normal vehicles can never be sustained.
- These vehicles have indepedent suspension system with non pneumatic tires, it uses Four wheel drive system as 4WD system have Low gear range that causes high torque which helps to crawl over obstacles.
- The Modelling as well as performance of ATV depends on various parameters like: Gear ratio, Throttle Valve input, Brake input, Vehicle Body weight, primary and secondary pulley radius, some inertial forces.
- Changing any parameters listed above can lead to change in the performance of vehicle.
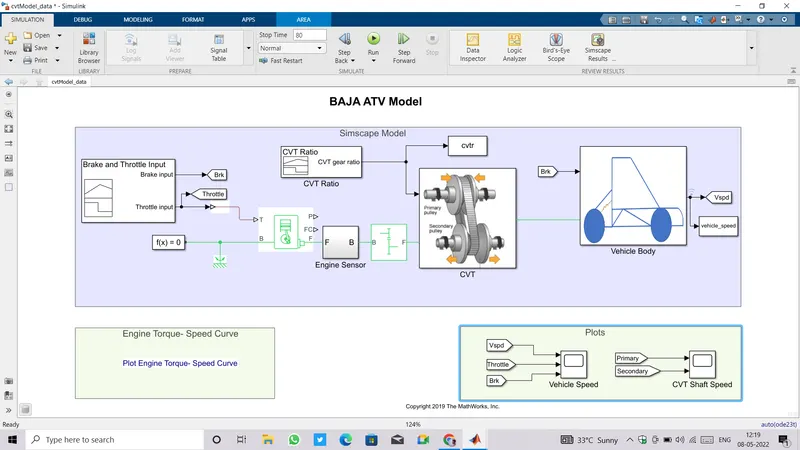
- The blocks related to respective parameters are shown below.
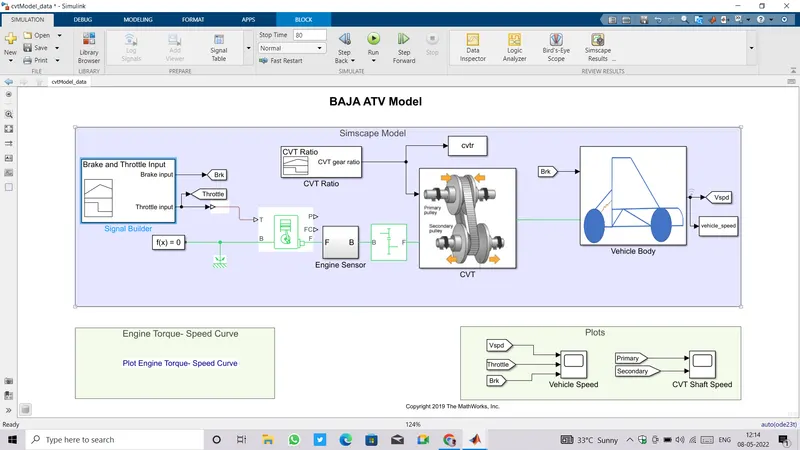
- Throttle and brake inputs are given by signal builder block.
- Throttle input is set to 0.3 till 20 secs then set to 1.
- Brake input has 0 value throughout the simulation.
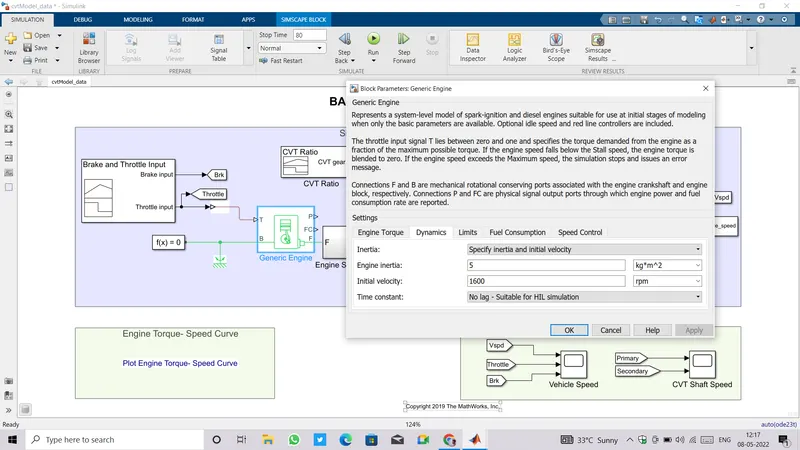
- Next comes the generic engine.
- Parameters of engine: Engine inetia is set to 5 kgm^2 and initial engine velocity is 1600 rpm.
- Port T is connected to Throttle input from signal builder and B and F are mechanical conserving ports, B is connected to Rotationa reference. P and FC are remained unconnected.
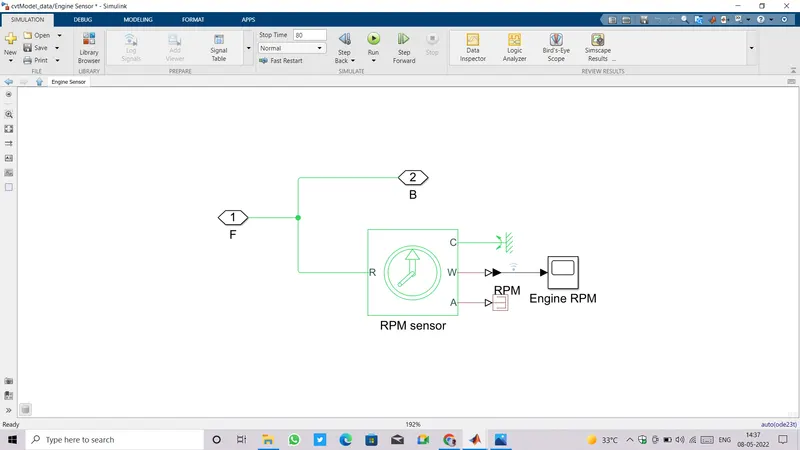
- The next is an Engine sensor subsystem which has a Rotational motion sensor inside it,sensing engine speed from 0 to 80 secs.
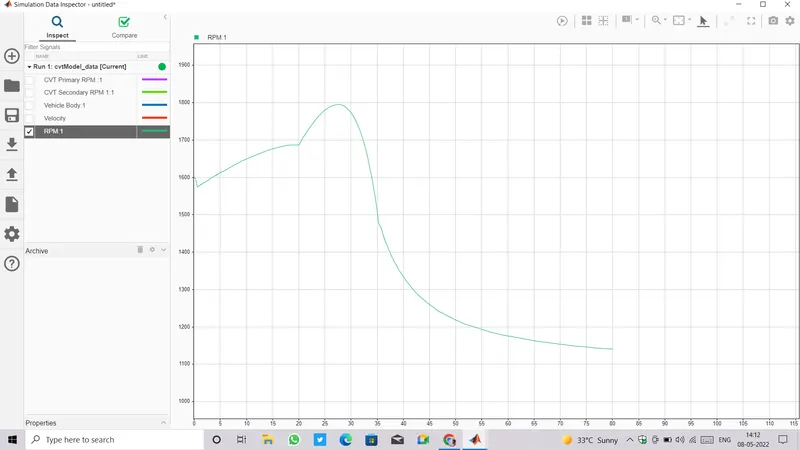
- The signal is logged,it means we can see the plot of engine Speed over 80 secs by just clicking onto log sign appearing near the scope looks like a wifi symbol.
- A slight drop down in engine rpm from 0 to 4secs , then it started rising almmost linearly till 20 secs and then followed parabolic path from 20 to 35 secs. From 35 to 80 secs it started decaying exponentially. That is the effect of Throttle input.
- Engine Speed plot:
- The next block ahead of engine sensor is a gear ratio block.
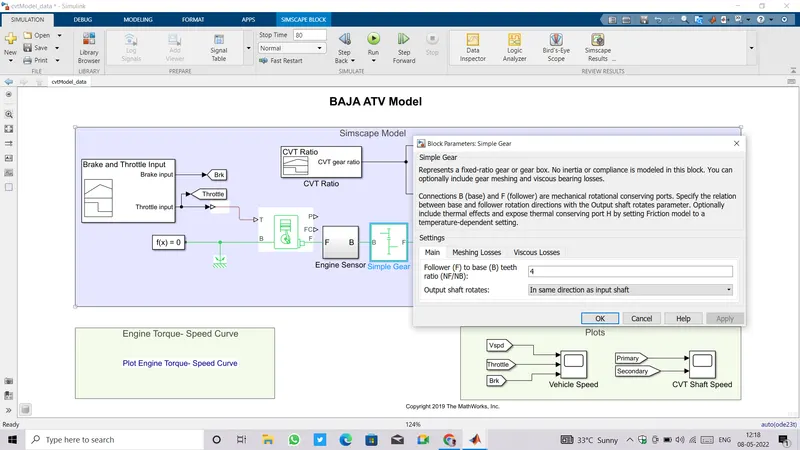
- The parameters of this block enable us to set Gear ratio, which is 4 here.
- The input side is B which is conected to engine rotstional conserving port and the output is F which can be further conneted to axel of vehicle by differential.
- Gear ratio thef F to B teeth ratio.
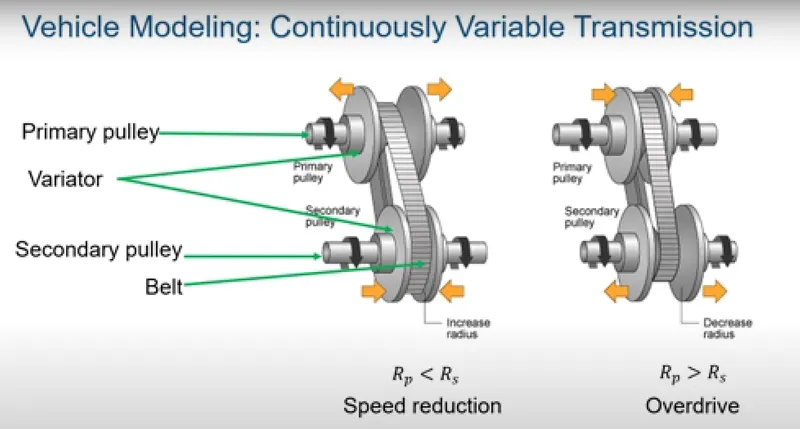
- The output from gear box is sent to CVT(continuously Variable Transmission) which is nothing but a combination of two pulleys with variable diameter connnected by a belt. One end is connected to the engine is called as primary pulley and other is linked to wheels called secondsary pulley.
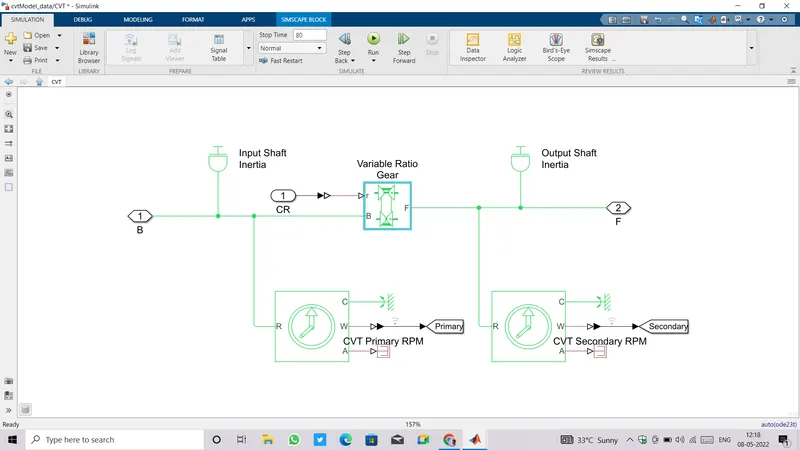
- In model we can see there is a block for CVT. The ports F an B are mechanical roational conserving ports and one more port r which is the ratio of input to output angular shaft velocities.
- When the input pulley diameter becomes smaller and output pulley diameter becomes large then vehicle runs in lower speed.
- When input pulley diameter becomes larger than output pulley diameter becomes smaller then the vehicle runs in greater speed.
- Two rotational motion sensors are connected to observe the motion of Primary and Secondary pulley, these signals are also logged we can see the plot by clicking on the Wifi like symbol.
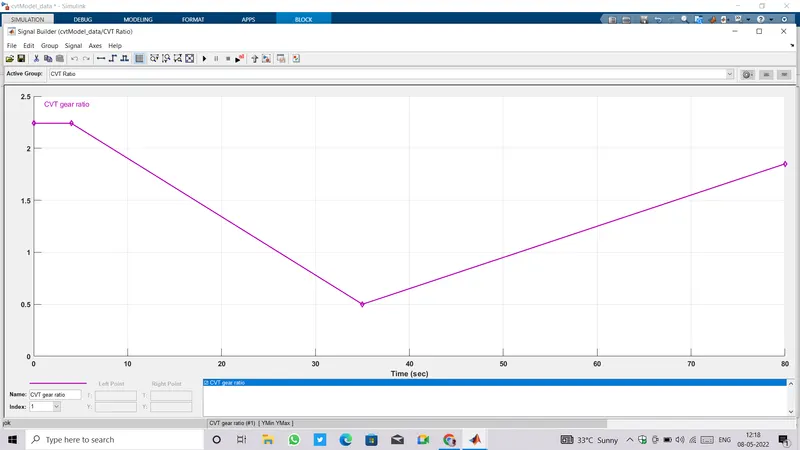
- Input to the r is given by signal builder block.
- Fron 0 to 4 secs it has value near 2.2 then started falling down till 35 secs and at 35 sec it became 0.5.Again rising from 35 sec till 80 sec and the final value at 80 secs is around 1.85 .
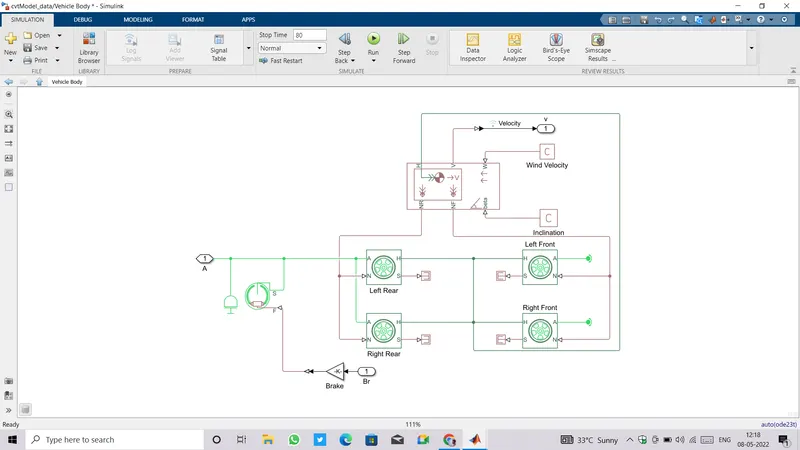
- The output from CVT is given to the mechanical rotational conserving port for wheel axles A, all A ports of wheels are interconnected and have a common connection with CVT output.
- The wheel structure is inside Vehicle body subsystem which is connected with vehicle body block.
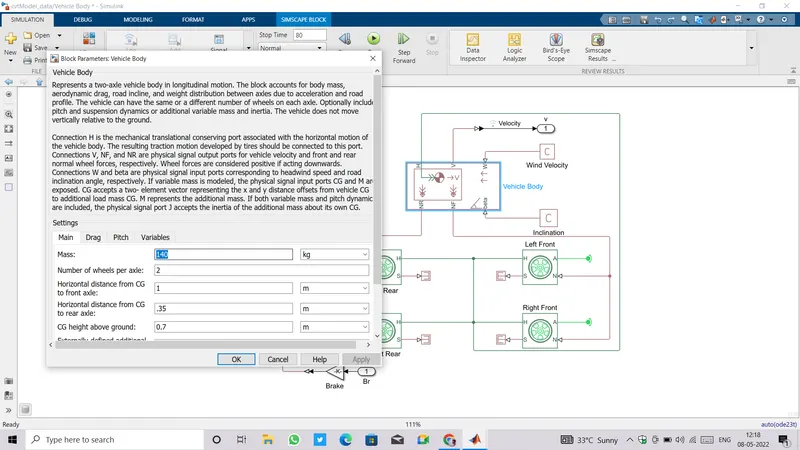
- The parameters of vehicle body like Vehicle mass, number of wheels per axle, Distance of rear and front from CG , CG height from ground.
- At the bottom in model there are scopes to see the Vehicle speed and CVT shaft speed.
Result:
- We will run the simulation by changing some parameters that we disscussed earlier.
- Observe the performance by changing gear ratio first.
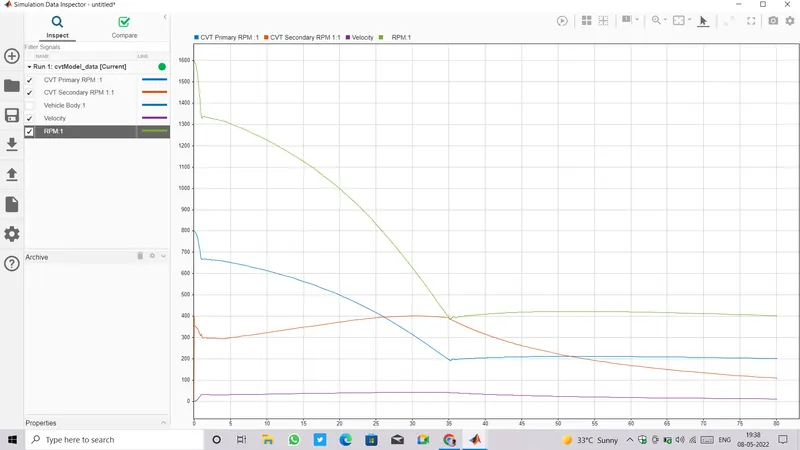
- Put Gear ratio = 2, let the remaining parameters as such.run the simulation for 80 secs.
- See the plots for Engine speed, Primary and secondary CVT shaft movement and velocity of vehicle.
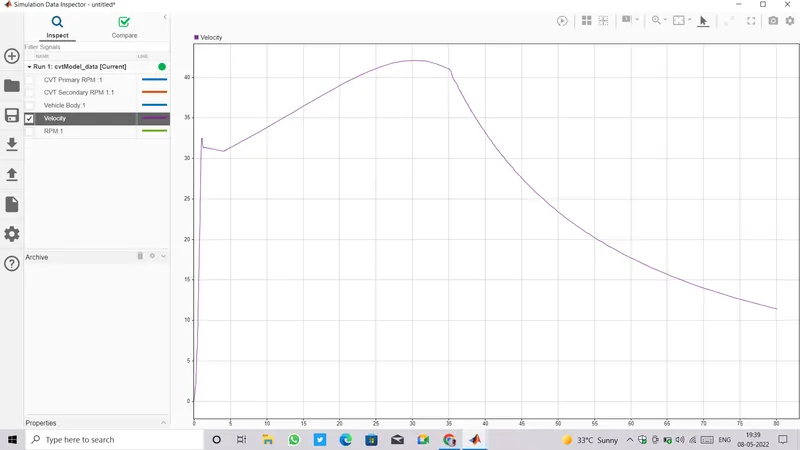
- Our main focus is on Velocity plot.
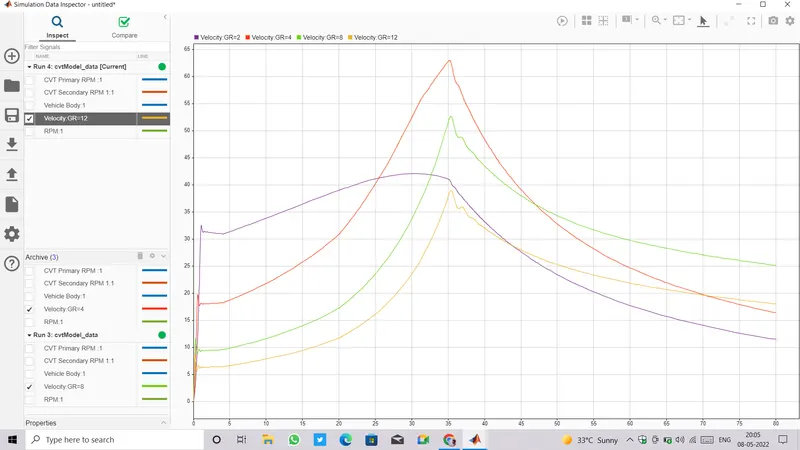
- Now putting gear ratio = 4, and then 8 & 12 , simulating and comparing the all velocity plots in Simulation data inspector.
- When gear ratio =2, the starting speed is around 32 kmph and then speed is increasing upto 35 secs as CR is decreasing, and from 35 secs to 80 secs speed is again decreasing as CR start increasing from 35 secs.
- It seems like CR has inverse relation with velocity.
- As gear ratio increases , starting velocity decreases and top velocity (which is near 35 secs) start increasing till Gear ratio =8 but after that at gear ratio = 12 starting velocity and top velocity we found is minimum among all.
- The best result we got at gear ratio = 4 so that we go for GR=4, we can see all velocity plots in an image below.
- Now Changing the Mass value of vehicle body.
- Put mass =100 kg. run the simulation.
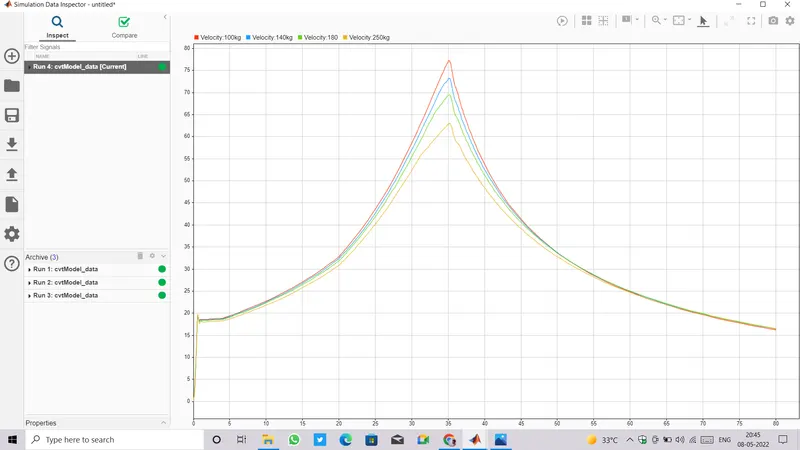
- We found top velocity further increased than in any previous cases. it went to near 77 kmph.
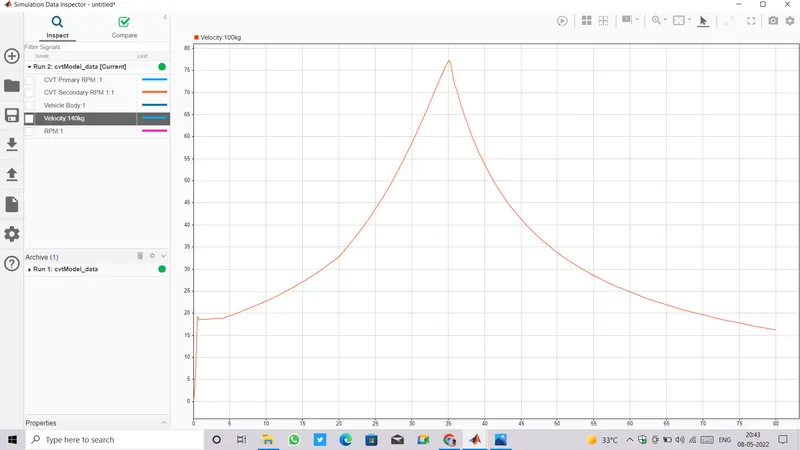
- Putiing mass = 140 , 180 and then 250 kg, comparing velocity withh all thes mass values, we got same starting speed around 18kmph but at 35 secs the speed started decreaing with increasing mass values.
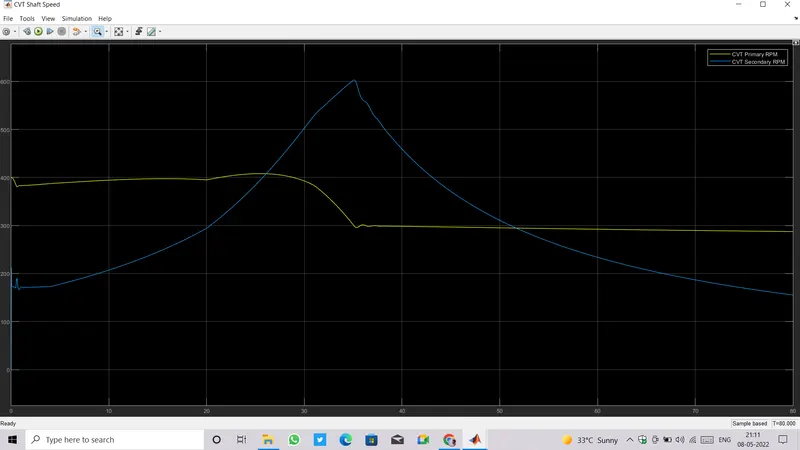
- By seeing the plot of CVT shaft speed we can conclude the relation between CVT ratio and velocity.
- At the starting Primary shaft rpm is 400 rpm and secondary is aroud 200 rpm which is less than primary rpm, it means the primary pulley diameter is less than secondary pulley diameter.
- The CVT ratio is defined as Driving/primary rpm to Driven/secondary rpm.
- At 26.1 and 52.6 secs CVt value is almost 1, it means Driving rpm and driven rpm must have same value, we found that at 26.1 sec both pulleys are running at 400 rpm and at 52.6 secs both are running at 300 rpm.
- Between 26.1 and 52.6 secs , secondary rpm overshoot and became greater than primary rpm because of CVT ratio fell down below 1. At exactly 35 secs the CVT ratio is 0.5 means primary rpm(300) must be halve of secondary rpm(600 rpm).
- As we disscussed earlier when input pulley diameter becomes smaller and output pulley diameter becomes large then vehicle runs in lower speed and When input pulley diameter becomes larger than output pulley diameter becomes smaller then the vehicle runs in greater speed, that's why velocity is increasing till 35 secs anfd then start decreaing after 35 secs.