Week-4 Challenge WOT Condition Part-2
AIM:-
- What is the difference between the mapped and dynamic models of engine, motor, and generator? How can you change the model type?
- How does the model calculate miles per gallon? Which factors are considered to model fuel flow?
- Run the HEV ReferenceApplication with WOT drive cycle. Change the grade and wind velocity in the environment block. Comment on the results.
- Keeping all other parameters the same, compare the simulated results of hybrid and pure electric powertrains.
Start from the very first question:-
- What is the difference between the mapped and dynamic models of engine, motor, and generator? How can you change the model type?
Mapped Models:- The Mapped engines represent engine behavior as a set of lookup tables (Brake torque, fuel flow, air mass flow, exhaust temperature, efficiency, and emissions) as functions of commanded load and measured engine speed. It's very fast and takes less time for the simulation. It also uses a set of steady-state lookup tables to characterize engine performance. The tables provide overall engine characteristics, including actual torque, Fuel flow rate, BSFC, and engine-out exhaust emissions.
When to Use:-
- If you have engine data from a dynamometer or a design tool like GT-POWER.
- For quasi-steady-state engine simulations.
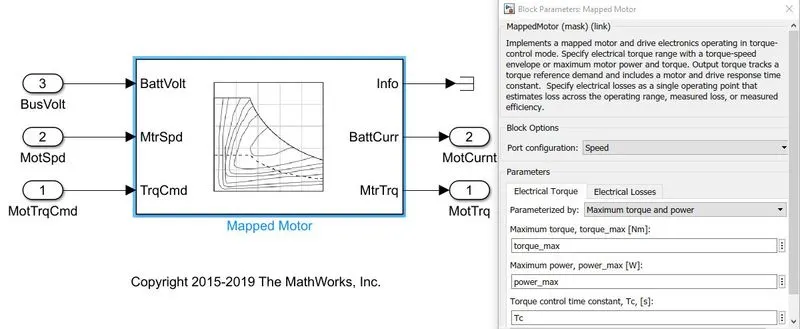
Dynamic Models:- Model decomposes the engine behavior into engine characteristics that are separated into lower-level components. By combining components in this way, the models capture the dynamic effects.
When to Use:-
- If you need a more detailed dynamic model and have component-level data.
- To analyze the impact of individual engine components on the overall performance.
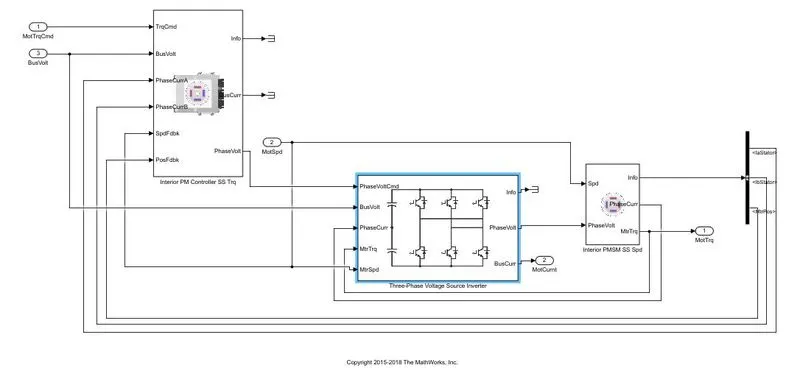
How can we change the Model Type:-
Step1- Go to the modeling tab.
Step2- Under the modeling tab there is a Variant manager. Open it
Step3- Select MotGenEvDynamic and then click on the right button of the mouse and select "set as Label mode active choice".
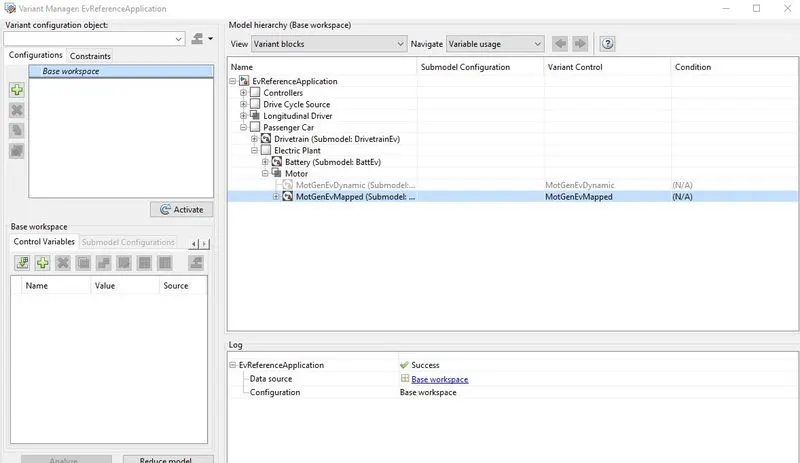
Step4- Then Click on Activate.
Theory for Mapped motor, Mapped Engine, and Mapped Generator are same please consider the above definition of Mapped Model.
Theory for Dynamic motor, Dynamic Engine, and Dynamic Generator are same please consider the above definition of Dynamic Model.
Q-2.) How does the model calculate miles per gallon? Which factors are considered to model fuel flow?
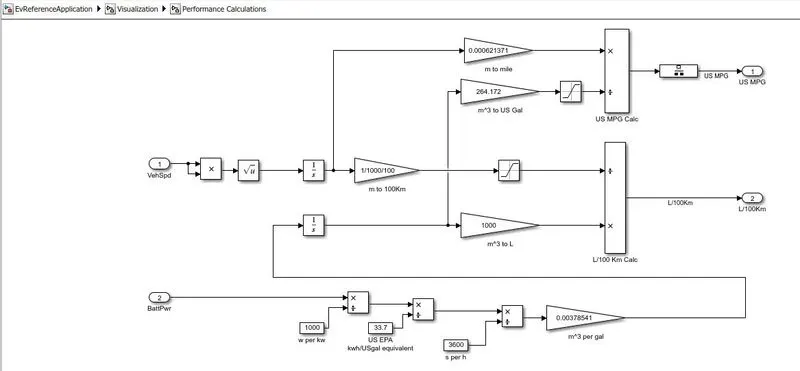
Calculation of battery power and vehicle speed in miles per gallon is used to find, that how economical the battery is as compare to engine fuel consumption. This mile per gallon is equivalent to the energy generated by electric power. This helps us to understand the economy of both vehicles.
The vehicle speed and battery power are input to compare the fuel economy of the engine with battery, we simply convert the battery power to gallon and vehicle speed to miles by using the following mathematical steps:-
The vehicle speed inputs are in m/s which is converted into miles by multiplying with 0.000621371.
Similarly, the kilogram of fuel is converted into cubic meters by multiplying by `1/(1000*0.739)`.
This cubic meter value is then converted into gallons by multiplying it with 264.172 the mile value and gallon value is used to find the mpg of the vehicle. Now the battery value is initially converted from watt to kilowatt by dividing with 1000 and then to gallon equivalent by again dividing it with 33.7 (because 33.7 kwh=1gallon).
After that divide the value by 3600 to get in per second and multiply by 0.00378541 we get the value in cubic meter per gallon.
We should go inside the EV Reference Application block click on the visualization block here you find the performance calculation block. The snapshot of the block is given below:
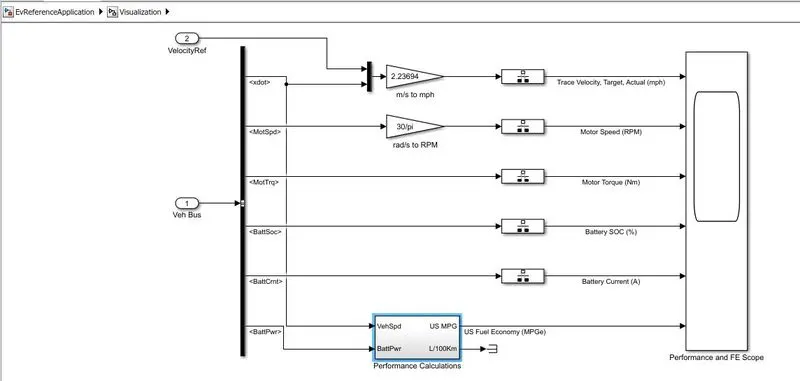
Inside the Performance Calculation block, we will get actual mpg calculations. Snapshot of Performance calculation block given below:
Factor considered to model fuel flow:
- Vehicle Speed,
- Battery Power.
Q-3). Run the HEV ReferenceApplication with WOT drive cycle. Change the grade and wind velocity in the environment block. Comment on the results.
- HEV Powertrain block set snapshot:
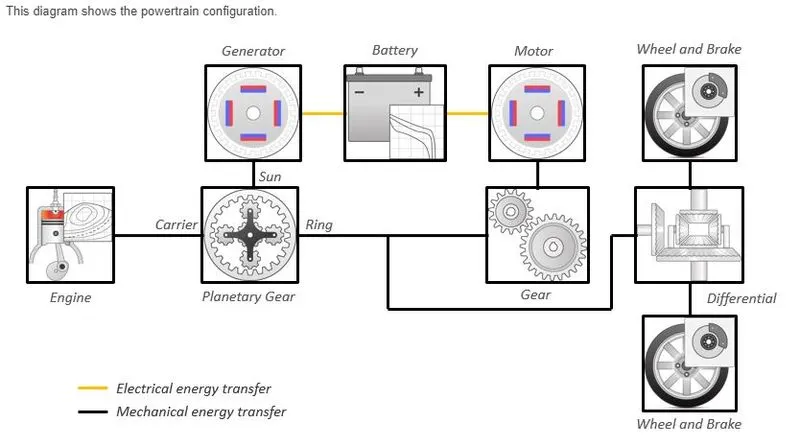
- First, we have to change the drive cycle from FTP75 to WOT with a sample time of 100 seconds.
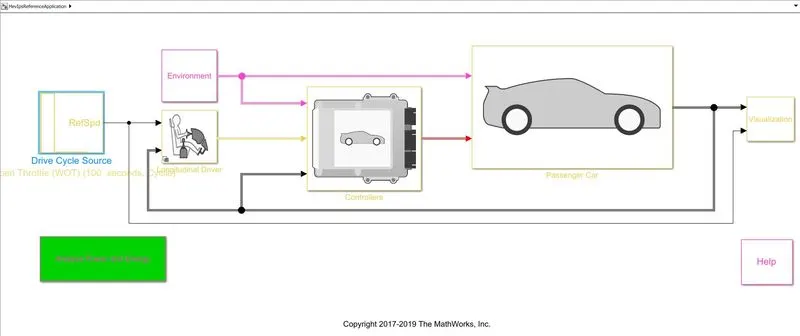
This is a backward-facing model as it moves from the drive cycle to the final car output.
A longitudinal Driver block implements a longitudinal speed-tracking controller. Based on reference and feedback velocities, the block generates normalized acceleration and braking commands that can vary from 0 through1. You can use the block to model the dynamic response of a driver or to generate the commands necessary to track a longitudinal drive cycle.
In Controller Block, the block has a powertrain input (from vehicle plant and provided data), output (motor torque command as required traction and braking command), and powertrain control module (PCM).
The Passenger Car Block has an electrical plant and drivetrain. In the electrical plant, we have a battery and motor-generator. In the motor-generator, we use a mapped condition instead of a dynamic condition. In the drivetrain, the mechanical power flows from the motor shaft to the wheel.
Visualization Block is used to plot the information coming from the drive cycle and the final outcome will be plotted.
- Detail of Wide Open Throttle (WOT) for 100 seconds given below:
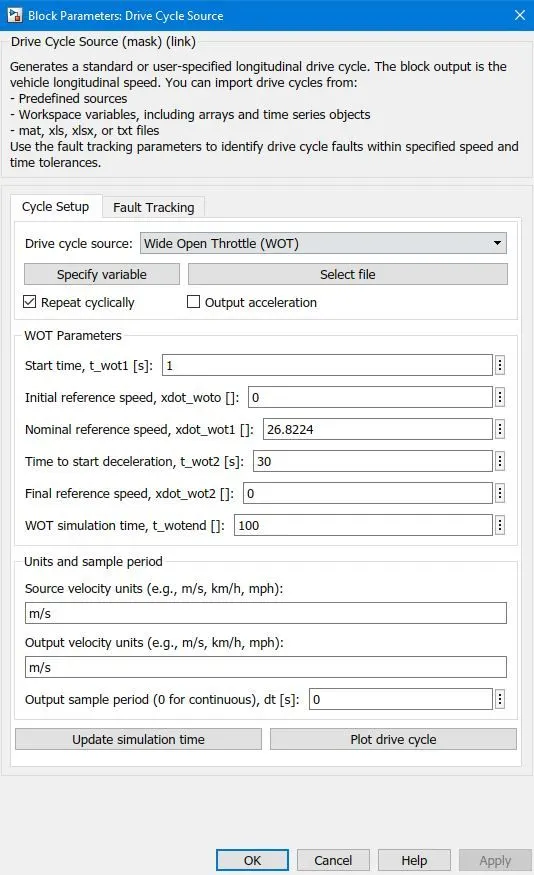
WOT cycle inputs are given in the above image.
- Environment block is given below:
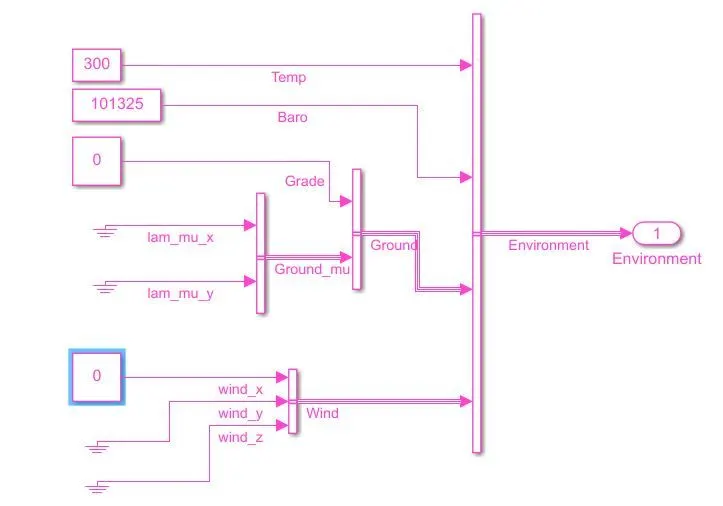
- Changes in the environment block are given below:
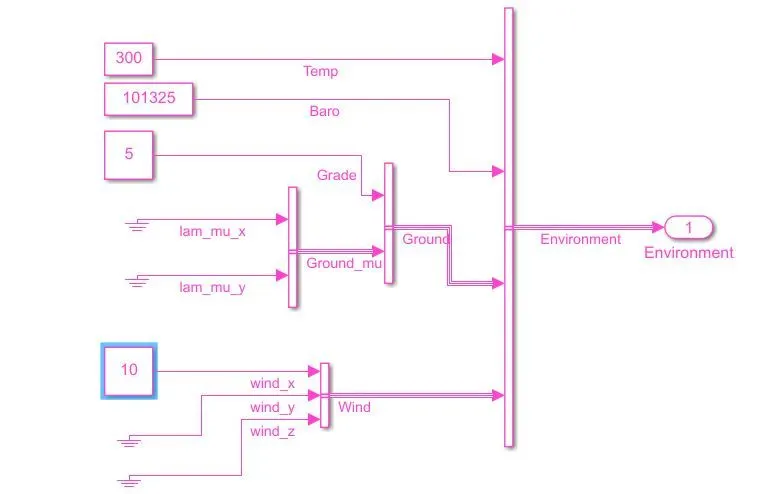
The grade percent and wind velocity are the same for both the powertrain of HEV and EV.
- RESULTS:
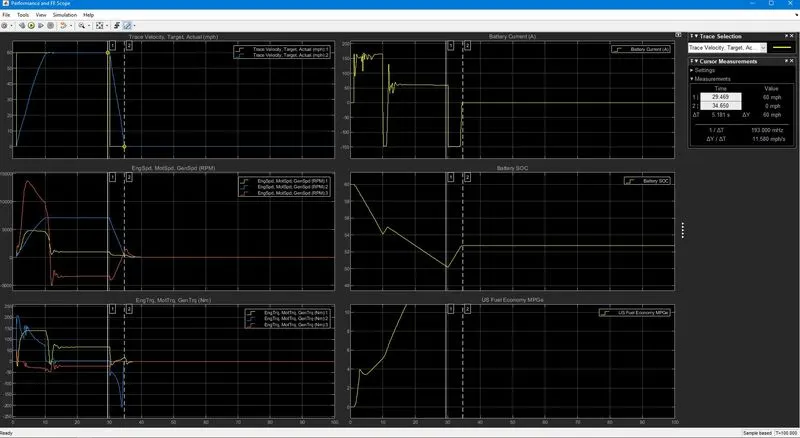
Case_1-With 0% gradeability and with 0m/s wind velocity. Snapshot of results given below:
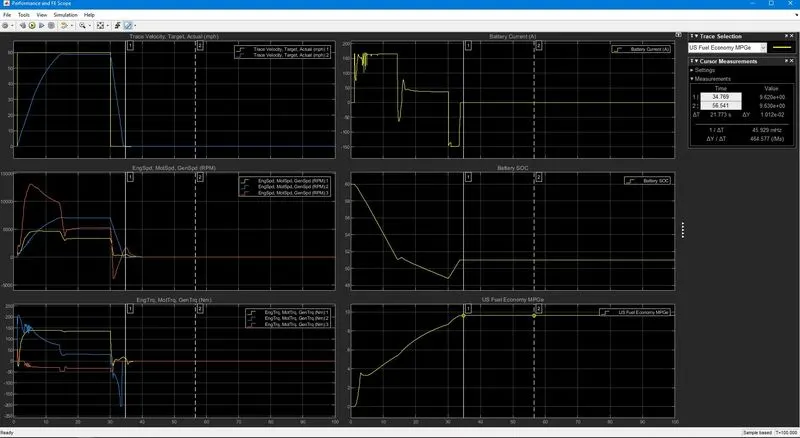
Case_2- With 5% gradeability and with 10m/s wind velocity. Snapshot of results given below:
- Comparison of Case_1 and Case_2:
If we compared both the results of the HEV vehicle we should get the variation in the top speed, engine speed, and fuel efficiency of the engine. The top speed, engine speed, and fuel efficiency are reduced in case_2 from case_1. When the gradeability and wind velocity comes into the picture the top speed, engine speed, and fuel efficiency decrease.
Q-4). Keeping all other parameters the same, compare the simulated results of hybrid and pure electric powertrains.
All parameters are the same as for the HEV reference application.
- EV powertrain block set snapshot given below:
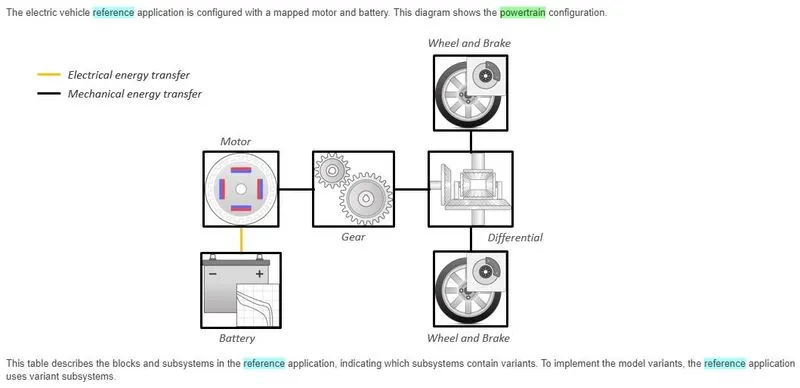
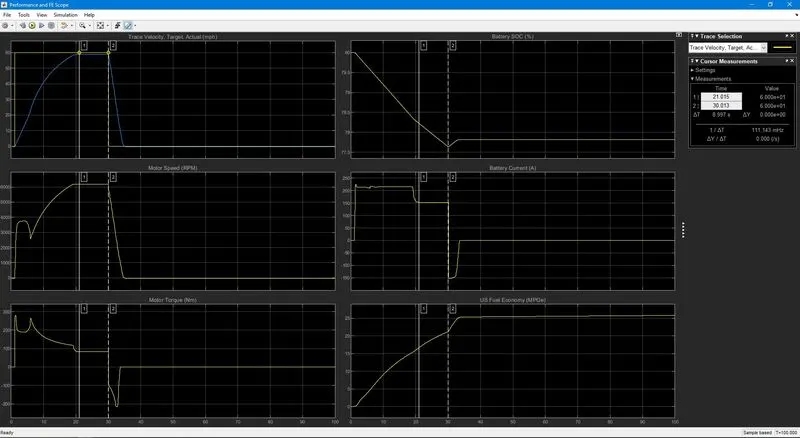
- Results are given below for EV Reference Application:
- Comparison of HEV and EV results:
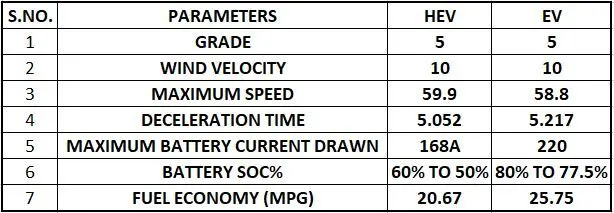
OBSERVATION:
- For the same conditions of Grade and wind velocity. The EV powertrain achieves a lower top speed when compared to the HEV powertrain.
- The conventional HEV uses a lead-acid battery whereas the EV uses lithium-ion cells which have more energy density.
- The motor is the only propulsion source in an EV powertrain, the motor needs higher rated power and generates the instantaneous start-up torque to propel the vehicle.
- The torque produced by the HEV is greater than that of an EV.
- The rate of battery discharge is clearly less in EV as compare to HEV.
- The EV has no emissions and fuel consumption.