Week-11 Challenge: Braking
AIM:-
- For a defined driving cycle, calculate the energy required for braking.
- Why electric motor can’t develop braking torque at a high speed similar to starting? How electric and mechanical brakes are coordinated?
- Make a MATLAB program that plots the contour of given motor speed, torque, and efficiency values. Attach the code as a .m file attach a screenshot of all the plots.
Question_1:- For a defined driving cycle, calculate the energy required for braking?
Answer:-
Driving Cycle: A driving cycle is a set of vehicle speed points versus time, it is used to calculate the fuel consumption of a vehicle, which is, later on, is compared with different vehicles. The main use of the driving cycle are as follows:
- To access the performance of a vehicle
- To analyze battery state and energy consumption in Electric vehicles
- To simulate vehicle model prior to the actual development
Braking: Braking is the process of controlling the velocity of an object by inhibiting its motion. An object in motion possesses kinetic energy and to bring the object to a stop this kinetic energy must be removed. Removing the kinetic energy can be accomplished by dissipating the energy to the atmosphere through friction or by converting it into another form of energy. The most common type of braking is mechanical brake which inhibits motion through friction brake pads. A mechanical brake applies a friction force to convert the kinetic energy of the vehicle into thermal energy which then dissipates into the atmosphere. Braking systems which don't use friction are referred to as regenerative braking systems (RBS). In RBS, the kinetic energy is converted into other forms of useful energy, which can be stored for later use increasing fuel efficiency.
The formula used to calculate Breaking Energy:-
`E = 1/2*m*v^2`
where,
m = mass of the vehicle in kg
v = velocity of the vehicle in m/s
E = Kinetic Energy in KJ
In our case, velocity will be `(V-V_i)` where V is the speed of the vehicle, `Vi' is the speed of the vehicle which is slow down or brought down to rest.
For example, if the initial speed of a vehicle is 20m/s and the final speed is 10m/s. The mass of the vehicle is 500kg. Then the required kinetic energy for Braking is `1/2*500*(20-10)^2 = 25000J = 25KJ`
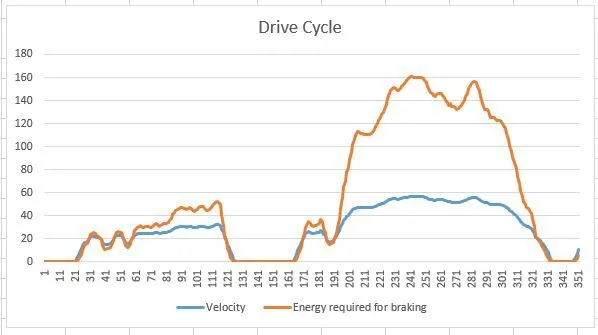
Here for a Drive cycle, the required braking energy is calculated for each second of time to slow down or stop the vehicle-Braking energy calculation for UDDS Driving Cycle.
Drive link of Excel Sheet given below:-
SnapShot of Velocity Vs Energy required for braking chart is given below:
Question_2:-
A). Why electric motor can’t develop braking torque at a high speed similar to starting?
Answer:- This situation occurs only when the vehicle is at high speeds because the motor will be running at the constant power region. In the constant power region, the torque of the motor reduces and so the motor cannot develop the braking torque which is equal to the torque that occurred during low speed at the constant torque range.
The torque vs speed plot of a vector control induction motor is given below:
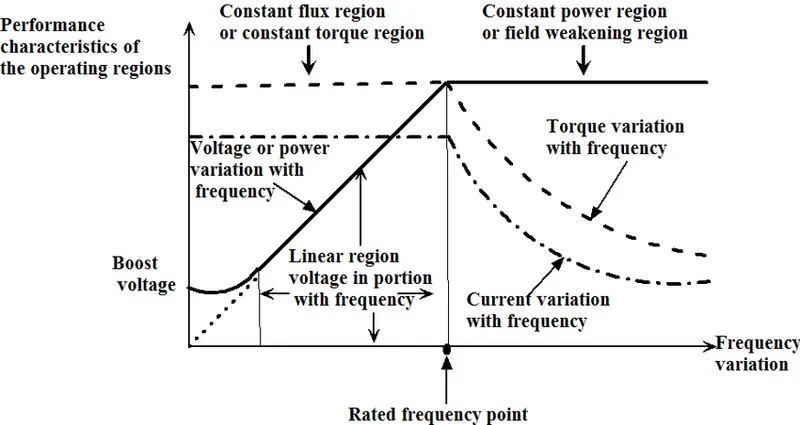
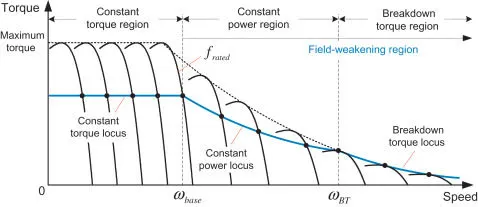
From the above characteristic curves of the motor that is seen that the torque of the motor remains high at low speeds and reduces as the speed increases.
Since the electric motor cannot develop braking torque at a high speed similar to starting.
B). How electric and mechanical brakes are coordinated?
Answer:- In mechanical braking which we usually see and experience in all vehicles, the brake pedal in the vehicle cabin helps us to engage or disengage the brakes. Currently, braking technology has done wonders by inventing life-saving braking technologies such as ABS, EBD, BA, and many others. All these technologies play a vital role in stopping the vehicle and coming back to rest at a high speed. In all these vehicles when the driver applies the brakes the brake pads come closer to the disc connected with the driving disc. The brake pads usually help inefficient braking.
These are two generic methods by which the vehicle could be braked in the Electric Brakes.
Series:- In the case of series we apply Mechanical brake and Regenerative electric brake one after another. We can apply only one brake strategy at a time either apply regenerative or apply Mechanical brake.
Parallel:- In the case of Parallel, we apply both brakes simultaneously. This particular Parallel braking is going to happen both at a time.
Electric Driven Intelligent Brake(EDIB):- EDIB is a combination of hydraulic brake or mechanical brake along with a regenerative brake. It is a parallel braking technique. The control criteria such that at low-speed use regenerative braking higher and at high speed or during the initial braking period we actually combine the both.
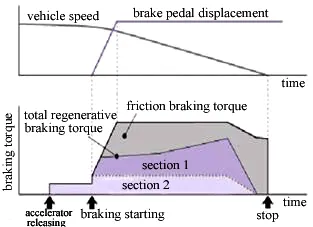
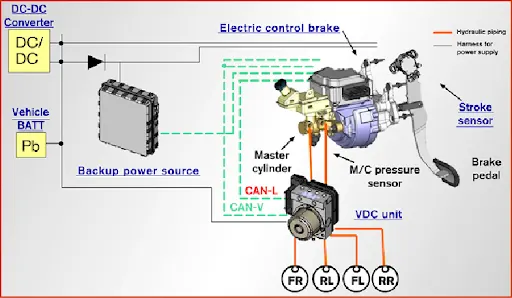
When the brake pedal is pressed the hydraulic fluid reaches the brake piston and created the braking pressure on the wheels and the same kinetic energy is been used by the Regenerative braking for generating more power using the bi-directional motor which operates as a generator while braking.
Question_3). Make a MATLAB program that plots the contour of given motor speed, torque, and efficiency values. Attach the code as a .m file attach a screenshot of all the plots?
Answer:-
MATLAB Code given below:-
clear all
close all
clc

% Plotting Efficiency Contour for Electric Motor
% Input of Speed & Torque
Speed=linspace(1,1000);
Torque=linspace(1,250);

% Losses
kc=0.2; % For Copper Loss
ki=0.008; % For Iron Loss
kw=0.00001; % For Windage Loss
C=20; % For Constant Motor Loss

% Meshing
[S,T]=meshgrid(Speed,Torque)

% Calculating Power = Speed * Torque
Outputpower=(S.*T);

% Calculating Losses
Cu=(T.^2)*kc; % Copper Losses
Fe=S*ki; % Iron Losses
W=(S.^3)*kw; % Windage Losses

Inputpower = Outputpower+Cu+Fe+W+C;
Efficiency = Outputpower./Inputpower;

% Now Set the Efficiency to plot Contour
V=[0.70,0.80,0.85,0.90,0.91,0.92,0.925,0.93];
box off
grid off
contour(S,T,Efficiency,V)
xlabel('Speed(rad/s)')
ylabel('Torque(Nm)')
title('Motor Speed-Torque Efficiency Contour Plot')
hold on

% Now Plot a contour of Power Output
% Additionally Plotting Contour of 8kw and 10kw
V=[8000,10000];
contour(S,T,Outputpower,V)
Output Plot:-
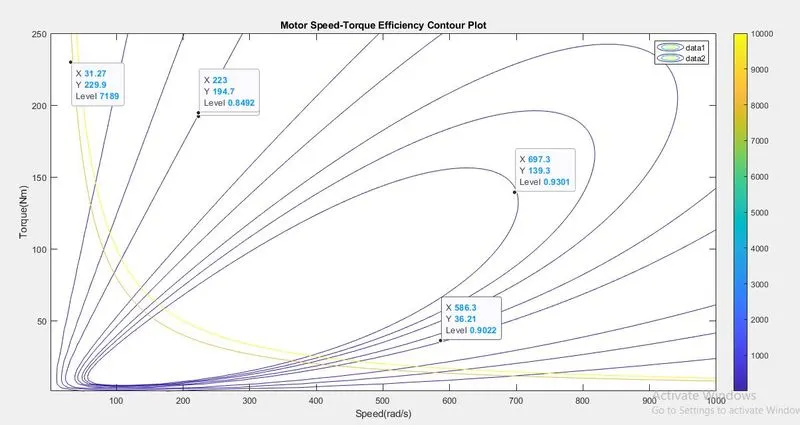
The above Plot shows the Motor Speed-Torque Efficiency Contour plot. A point is denoted in the innermost contour line is a group of efficiencies which is the highest value of the efficiency as 93%, because where the height is maximum and another point is denoted outermost contour line contains a group of efficiencies which is the lowest value of efficiency as 70%, because where the height reduces. Increasing efficiency order as going inward and decreasing efficiency order as going outward. The yellow line shows the 8kw and 10kw power.
Google drive link for .m file- https://drive.google.com/file/d/18Vn5K4f5pMLdgQDc60nsUzsjc2vY0PEE/view?usp=sharing