Week 2 Air standard Cycle
AIM : To Write code in PYTHON that can solve an otto cycle and plot PV diagram.
DESCIRPTION :
Otto cycle explains the working procedure of convertion of chemical energy throught the thermal energy and that thermal energy is converted into mechanical energy as from the law of conservation of energy the energy is neither be created nor destroyed,it will just transfer from one form to another.
the same principle is also applied here, the Otto cycle was first discovered by 1876 by nicolas Otto,the otto cycle is the most efficient SI engine in those days.
It run in the four stroke cycle, the two is reversible adibaliatic process and other two is insentropic process.
OTTO CYCLE WORKING PRINCIPLE :
PROCESS 0-1:
In this process, the piston sucks the air fuel mixture into the combustion chamber as it moves from TDC to BDC. due this movement from TDC to BDC there will be a vaccum is created inside the combustion chamber hence the air fuel mixture is pulled inside. in this process there is no change is temperature, pressure, only the volume is increased.
PROCESS 1-2 :
as the air fuel mixture is sucked in, now the piston is moved from the BDC to TDC and piston compress the air fuel mixture. In this case the temperature T1 is changed to T2 and pressure P1 is change to P2, but the enthalhy of the system remain constant, hence it is called as adibiatic compression process.
PROCESS 2-3 :
after the air fuel is compressed its pressure and temperature is also increased, this process the compressured air fuel mixture is ignited using the spark plug. during this process the enthalpy is change to s2-s3 and the pressure and temperature is also changed, mean while the volume will remains constant, hence this process called as constat volume heat addition. i.e isentropic compression process
PROCESS 3-4 :
due to the combustion the pistion is pushed downwards to BDC, hence the temperature and pressure is reduces and the power is produced in this process because now the chemical energy is converted to mechnical energy. hence it is called as power stroke here
PROCESS 4-1:
after the power stroke the piston explels the waste gases throught the exhaust value, in this combusted gases temperature and pressure is further decreased.
then the new cycle of fuel is enterned into the combustion chamber for the next cyclic process.
CODING FOR OTTO CYCLE PROGRAM :
import math
import matplotlib.pyplot as plt

#user conditions
print("AIR STANDARD CYCLE - OTTO\n\n")
print("ENTER THE APPROPRIATE VALUES FOR THE GIVEN PARAMTERS\n\n")
#user inputs
t1 = float(input("enter the values for temperature at state point 1 in K \n"))
t3 = float(input("enter the values for temperature at state point 3 in K \n"))
p1 = float(input("enter the values for pressure at state point 1 in PA \n"))
gamma = 1.4

#geometric paramters
b_d = float(input("enter the values for bore dia in CM \n"))
s_l = float(input("enter the values for stroke lenght in CM \n"))
c_l = float(input("enter the values for connecting rod lenght in CM \n"))
c_r = float(input("enter the values for compression ratio \n"))
N = float(input("enter the number of cyclinders\n"))

#volume computation
v_s = (math.pi/4)* pow(b_d,2) *s_l
v_c = v_s/(c_r-1)

def engine_kinematics(start_crank,end_crank):

    a = s_l /2
    R = c_l /a

    s_c = math.radians(start_crank)
    e_c = math.radians(end_crank)

    num_values = 100

    v =[]

    for i in range(0,num_values):
         # Linear interpolation method
         # Formula y = y1 + (x - x1) * (y2 - y1) / (x2 - x1)
         theta = s_c + i * (e_c - s_c)/(num_values-1)

         #relationship between crank angle and volume inside the combustion chamber
         term1 = 0.5 *(c_r -1)
         term2 = R + 1 - math.cos(theta)
         term3 = pow(R,2) - pow(math.sin(theta),2)
         term4 = pow(term3,0.5)

         v.append((1+term1*(term2-term4))*v_c)

    return v

#volume @ state point 1
v1 =  v_s + v_c

#volume @ state point 2
v2 = v_c

#pressure @ state point 2
#adibiatic process in ideal gas
#p1*v1^gamma = p2*v2^gamma
p2 = p1*pow(v1,gamma)/pow(v2,gamma)

#temperature @ state point 2
#ideal gas law
#pv = nrt
#p1v1/t1 = p2v2/t2
t2 = (p2*v2*t1)/(p1*v1)

V_compression = engine_kinematics(180,0)

constant = p1*pow(v1,gamma)

P_compression = []

for v in V_compression:
    P_compression.append(constant/pow(v,gamma))

#volume @ state point 3
v3 = v2

#pressure @ state point 3
#ideal gas law
#pv = nrt
#p2v2/t2 = p3v3/t3
p3 = (p2*v2*t3)/(t2*v3)

V_expansion = engine_kinematics(0,180)

constant = p3*pow(v3,gamma)

P_expansion = []

for v in V_expansion:
    P_expansion.append(constant/pow(v,gamma))

#volume @ state point 4
v4 = v1

#pressure @ state point 4
#adibiatic process in ideal gas
#p3*v3^gamma = p4*v4^gamma
p4 = (p3*pow(v3,gamma))/(pow(v4,gamma))

#temperature @ state point 4
#ideal gas law
#pv = nrt
#p3v3/t3 = p4v4/t4
t4 = (p4*v4*t3)/(p3*v3)

# Cubic Capacity Calculation
CC = v_s * N
print("\nCubic Capacity =", format(CC, '.4f'), "cm^3")

# Efficiency Calculation
eff = 1 - pow((1 / c_r), gamma - 1)
print("\nEfficiency =", format(eff * 100, '.2f'), "%")


#plottings
plt.plot([v2,v3],[p2,p3],label='Isochoric Heat Addition')
plt.plot(V_compression,P_compression,label='Isentropic Compression')
plt.plot(V_expansion,P_expansion,label='Isentropic expansion')
plt.plot([v4,v1],[p4,p1],label='Isochoric Heat rejection')
plt.legend()
plt.xlabel('Volume (cm^3)')
plt.ylabel('Pressure (Pa)')
plt.title('Air Standard Cycle - Otto Cycle')
plt.savefig("pv-diagram.png")
plt.show()
CODE EXPLAINATION :
import math
import matplotlib.pyplot as plt
math and mathplotlib are two most powerful python library where math is used too create the mathematical functions like sin, cos, sqrt, log, pi and various mathematical calculations and operations. mathplotlib is used for plotting the grap for required data points. it can create static and animate and interactive visvalisation.
#user conditions
print("AIR STANDARD CYCLE - OTTO\n\n")
print("ENTER THE APPROPRIATE VALUES FOR THE GIVEN PARAMTERS\n\n")
#user inputs
t1 = float(input("enter the values for temperature at state point 1 in K \n"))
t3 = float(input("enter the values for temperature at state point 3 in K \n"))
p1 = float(input("enter the values for pressure at state point 1 in PA \n"))
gamma = 1.4

#geometric paramters
b_d = float(input("enter the values for bore dia in CM \n"))
s_l = float(input("enter the values for stroke lenght in CM \n"))
c_l = float(input("enter the values for connecting rod lenght in CM \n"))
c_r = float(input("enter the values for compression ratio \n"))
N = float(input("enter the number of cyclinders\n"))
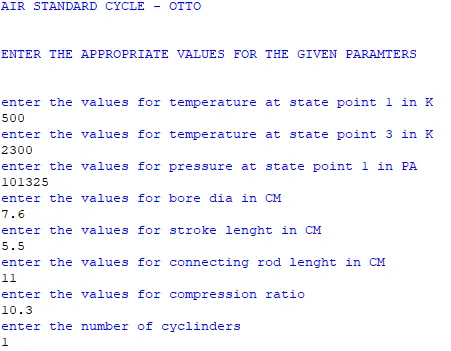
these are the user conditions and user input snipet,in which the user must be enter the appropriate value for temperature at state point1 and temperature at state point 2 and pressure at state point 1 then for engine geometric paramters the user need to give the input for bore dia, stroke length, connecting rod, compression ratio and no. of cyclinders in the engine.
#volume computation
v_s = (math.pi/4)* pow(b_d,2) *s_l
v_c = v_s/(c_r-1)
v_s - swept volume is the volume between the top dead centre and bottom centre
v_c - clearance volume is the volume of the engine at the top dead centre. (peak position of the piston)
those formula is snipted in python code for the calcuation of volume arrays.
def engine_kinematics(start_crank,end_crank):

    a = s_l /2
    R = c_l /a

    s_c = math.radians(start_crank)
    e_c = math.radians(end_crank)

    num_values = 100

    v =[]

    for i in range(0,num_values):
         # Linear interpolation method
         # Formula y = y1 + (x - x1) * (y2 - y1) / (x2 - x1)
         theta = s_c + i * (e_c - s_c)/(num_values-1)

         #relationship between crank angle and volume inside the combustion chamber
         term1 = 0.5 *(c_r -1)
         term2 = R + 1 - math.cos(theta)
         term3 = pow(R,2) - pow(math.sin(theta),2)
         term4 = pow(term3,0.5)

         v.append((1+term1*(term2-term4))*v_c)

    return v
Linear Interpolation of Crank Angle:
theta: Computes a linearly interpolated value of the crank angle within the range of start_crank to end_crank using the formula for linear interpolation.
Calculating Volume for Each Crank Angle:
Computes the volume inside the combustion chamber based on the crank angle using geometric relationships:
term1: Half of the compression ratio minus 1.
term2: Relationship involving the ratio of the connecting rod length and the cosine of the crank angle (theta).
term3: Mathematical expression related to the sine and cosine of the crank angle.
term4: Square root of term3.
Computes the volume using these terms and appends it to the list v.
Return Value:
Returns a list (v) containing the volumes for each corresponding crank angle within the specified range.
#volume @ state point 1
v1 =  v_s + v_c

#volume @ state point 2
v2 = v_c

#pressure @ state point 2
#adibiatic process in ideal gas
#p1*v1^gamma = p2*v2^gamma
p2 = p1*pow(v1,gamma)/pow(v2,gamma)

#temperature @ state point 2
#ideal gas law
#pv = nrt
#p1v1/t1 = p2v2/t2
t2 = (p2*v2*t1)/(p1*v1)

V_compression = engine_kinematics(180,0)

constant = p1*pow(v1,gamma)

P_compression = []

for v in V_compression:
    P_compression.append(constant/pow(v,gamma))

#volume @ state point 3
v3 = v2

#pressure @ state point 3
#ideal gas law
#pv = nrt
#p2v2/t2 = p3v3/t3
p3 = (p2*v2*t3)/(t2*v3)

V_expansion = engine_kinematics(0,180)

constant = p3*pow(v3,gamma)

P_expansion = []

for v in V_expansion:
    P_expansion.append(constant/pow(v,gamma))

#volume @ state point 4
v4 = v1

#pressure @ state point 4
#adibiatic process in ideal gas
#p3*v3^gamma = p4*v4^gamma
p4 = (p3*pow(v3,gamma))/(pow(v4,gamma))

#temperature @ state point 4
#ideal gas law
#pv = nrt
#p3v3/t3 = p4v4/t4
t4 = (p4*v4*t3)/(p3*v3)
now the volume at each state pointis dervied and for the adibiatic process curve the points mustbe interpolated such a way the it tends to form a curve. by the sing the above volume and crank angle relation, for the compression stroke, the start angle must be 180 degree and the end angle will be 0 degree.
this will be achieved by calling an engine kienamtics function and to find the Pressure, it is iterated in the for loop till V_compression
Volume @ State Point 1 (v1):
Computed as the sum of the clearance volume (v_c) and the swept volume (v_s).
Volume @ State Point 2 (v2):
Represents the volume at the start of the compression stroke, which equals the clearance volume (v_c).
Pressure @ State Point 2 (p2):
Calculated using the adiabatic process for an ideal gas based on the relationship pv = mrt, �1⋅�1�=�2⋅�2� where � p1 is the pressure at state point 1 and �gammagammagamma is the specific heat ratio.
Temperature @ State Point 2 (t2):
Determined using the ideal gas law p1v1/t1 =p2v2/t2
Engine Kinematics - Compression Stroke (V_compression):
Calculates volumes within the combustion chamber using the engine_kinematics function for the compression stroke (crank angles from 180° to 0°).
Pressure During Compression (P_compression):
Calculates the corresponding pressures during the compression stroke using the computed volumes and the adiabatic process equation.
Volume @ State Point 3 (v3):
Represents the volume at the start of the expansion stroke, which equals the volume at state point 2 (v2).
Pressure @ State Point 3 (p3):
Determined using the ideal gas law based on the relationship p2v2/t2 =p3v3/t3 �2⋅�2/�2=�3⋅�3/�3
Engine Kinematics - Expansion Stroke (V_expansion):
Calculates volumes within the combustion chamber using the engine_kinematics function for the expansion stroke (crank angles from 0° to 180°).
Pressure During Expansion (P_expansion):
Calculates the corresponding pressures during the expansion stroke using the computed volumes and the adiabatic process equation.
Volume @ State Point 4 (v4):
Represents the volume at the end of the expansion stroke, which equals the volume at state point 1 (v1).
Pressure @ State Point 4 (p4):
Calculated using the adiabatic process for an ideal gas
Temperature @ State Point 4 (t4):
Determined using the ideal gas law �3⋅�3/�3=�4⋅�4/�4
These calculations represent the different states (points 1 to 4) of the Otto cycle, considering adiabatic processes and ideal gas laws to determine pressures, temperatures, and volumes at each stage of the cycle. The engine_kinematics function helps model the changing volumes as the piston moves through its strokes.
-
# Cubic Capacity Calculation
CC = v_s * N
print("\nCubic Capacity =", format(CC, '.4f'), "cm^3")

# Efficiency Calculation
eff = 1 - pow((1 / c_r), gamma - 1)
print("\nEfficiency =", format(eff * 100, '.2f'), "%")
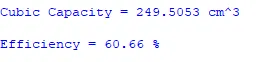
Cubic Capacity Calculation (CC):
- This calculation determines the total volume displaced by all the cylinders in the engine, known as the cubic capacity or engine displacement.
v_srepresents the swept volume of one cylinder, andNis the number of cylinders.- The swept volume is the volume displaced by the movement of the piston from top dead center (TDC) to bottom dead center (BDC) within the cylinder.
- The total cubic capacity gives an indication of the engine's total displacement capability.
-
Efficiency Calculation (eff):
- This calculation estimates the thermodynamic efficiency of the engine based on the compression ratio (
c_r) and the specific heat ratio (gamma). - The efficiency equation is derived from thermodynamic principles and represents the theoretical efficiency of the Otto cycle.
- A higher compression ratio generally leads to higher efficiency in the idealized Otto cycle. This efficiency represents the potential maximum efficiency achievable in an ideal engine cycle under certain assumptions.
#plottings
plt.plot([v2,v3],[p2,p3],label='Isochoric Heat Addition')
plt.plot(V_compression,P_compression,label='Isentropic Compression')
plt.plot(V_expansion,P_expansion,label='Isentropic expansion')
plt.plot([v4,v1],[p4,p1],label='Isochoric Heat rejection')
plt.legend()
plt.xlabel('Volume (cm^3)')
plt.ylabel('Pressure (Pa)')
plt.title('Air Standard Cycle - Otto Cycle')
plt.savefig("pv-diagram.png")
plt.show()
The formula used to compute the volume inside the combustion chamber based on the crank angle in the engine_kinematics function is derived from geometrical relationships related to the piston motion within the cylinder.
Geometric Parameters:
a: Half of the stroke length (s_l), defining the crank radius.
R: The ratio of connecting rod length (c_l) to half of the stroke length (a).
Conversion of Crank Angles:
s_c and e_c: Conversion of start and end crank angles from degrees to radians (math.radians function).
Iterating Over Crank Angles:
num_values: Total number of values between the start and end crank angles (here, set to 100).
for loop: Iterates through a range of values from 0 to num_values.
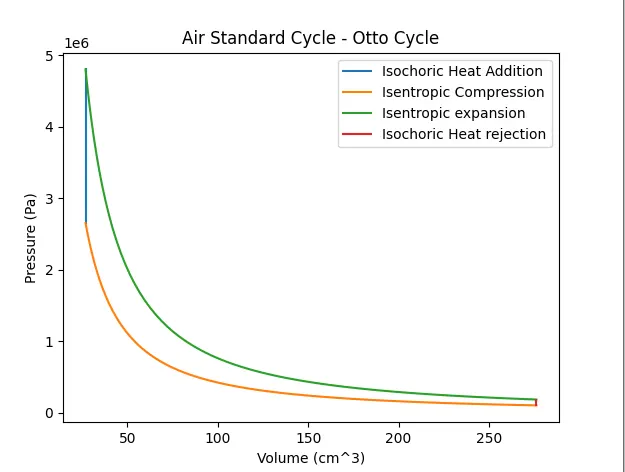
Isochoric Heat Addition:
The line plt.plot([v2, v3], [p2, p3], label='Isochoric Heat Addition') plots a line representing the heat addition process while the volume remains constant (v2 to v3). This process occurs during combustion where heat is added at constant volume, leading to an increase in pressure (p2 to p3).
Isentropic Compression:
The line plt.plot(V_compression, P_compression, label='Isentropic Compression') plots the compression stroke. It shows the relationship between volume (V_compression) and pressure (P_compression) during the compression process. This line represents the compression of the air-fuel mixture inside the cylinder.
Isentropic Expansion:
The line plt.plot(V_expansion, P_expansion, label='Isentropic expansion') shows the expansion stroke, plotting the relationship between volume (V_expansion) and pressure (P_expansion) during the expansion process. This represents the power stroke where the high-pressure gases expand, driving the piston down.
Isochoric Heat Rejection:
The line plt.plot([v4, v1], [p4, p1], label='Isochoric Heat rejection') represents the heat rejection process at constant volume (v4 to v1). This process occurs during exhaust where heat is rejected at constant volume, causing a decrease in pressure (p4 to p1).
Legend and Labels:
plt.legend() adds a legend to the plot displaying the labels defined in each plt.plot function.
plt.xlabel, plt.ylabel, and plt.title set labels for the x-axis, y-axis, and title respectively.
Saving and Displaying the Plot:
plt.savefig("pv-diagram.png") saves the generated plot as an image named "pv-diagram.png".
plt.show() displays the PV diagram with all the plotted processes.
ERROR DURING CODING :
- The graph has not ploted correctly, this is due to while snipetting the code for adibiatic process the code is inappropriate and also in graph the plotting points are mismatched.
RESULT :
USER INPUT:
ENGINE DISPLACEMENT AND ITS EFFIECIENY ACCORDING TO THE USER INPUTS:
PV GRAPH ACCORDING TO THE USER INPUTS :
PROJECT LINK :
https://drive.google.com/file/d/1E2SRKvx9PW3Fpgm1YudIs-Hz73H-xiKI/view?usp=drive_link
RESULT :
The desired and correct p-v diagram of Otto cycle was obtained using an array of volume inside the engine cylinder at different crank angle and it is coded as the engine efficiency and pv diagram calculator snipet where user needs to enter the desire input and obtain the result accordingly.