Thermal Modeling of 10S1P Battery Pack
For a 10 cell series lithium ion battery model, simulate the thermal effects and compare life cycle performance at various temperatures, charge & discharge rates using MATLAB/SIMULINK
All types of electric vehicles, whether BEVs, HEVs, or PHEVs, contain a battery pack that powers the vehicle. Lithium-ion batteries are sensitive, and how they hold up in a pack in different conditions is key to the vehicle performance. It is crucial to test the battery pack under normal and extreme conditions, such as different charging/discharging rates and different ambient temperatures, in order to understand how their performance differs, and how they must be maintained in different conditions to preserve their life cycle.
This project will simulate the thermal effects of a 10S1P Lithium-ion battery pack, which consists of 10 Lithium-ion NCR18650PF cells connected in series, to explore the performance of the pack. To make it interesting, a fault has been introduced in one of the cells to demonstrate the effect of the faulty cell on the entire pack.
The lithium-ion datasheet used for this project is:
https://datasheetspdf.com/pdf/955257/Panasonic/NCR18650PF/1
Note: All 10 cells are configured according to the above data. However, some ohmic resistance has been introduced in one of the cells, hence making it act like a faulty cell.
WHAT IS A FAULTY CELL?
A faulty cell demonstrates performance that is different than the other cells. Usually most cells will be displaying the same SOC, temperature, voltage levels, etc, but a faulty cell will show signs of overheating, overcharging, faster discharge (due to reduced capacity or reduced OCV), or will be an unbalanced cell. This will impact the performance of the entire pack as the faulty cell will limit the pack from utilizing its maximum potential.

In this project, the fault is represented by adding an external resistor. This will make the cell react differently than the other cells.
SIMULINK MODEL:
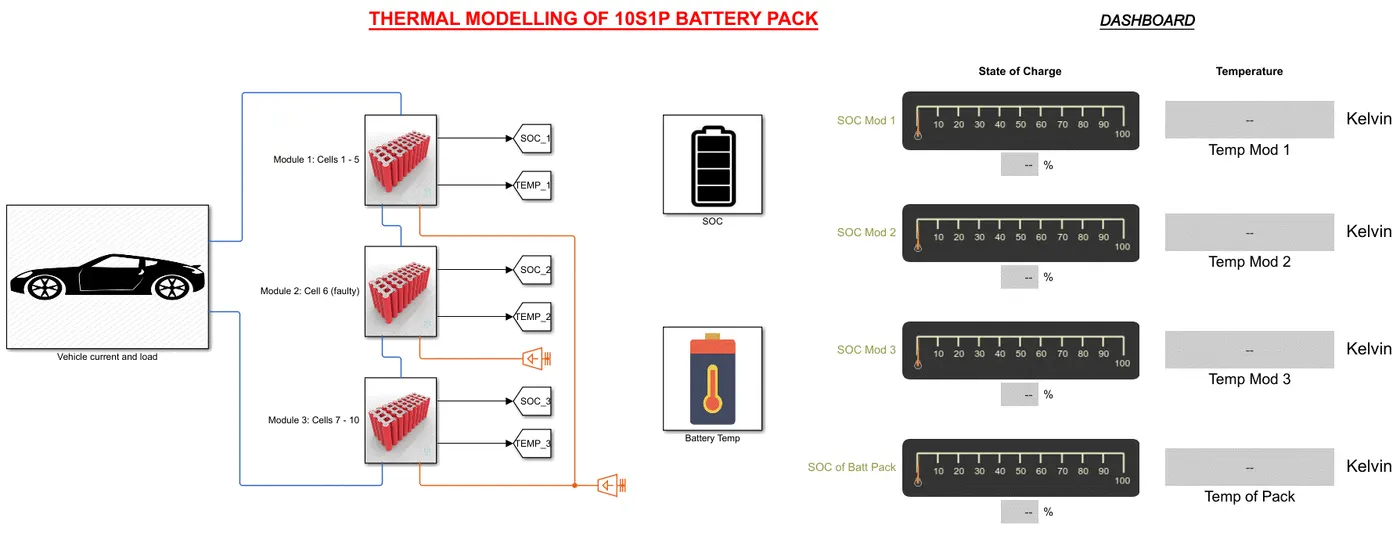
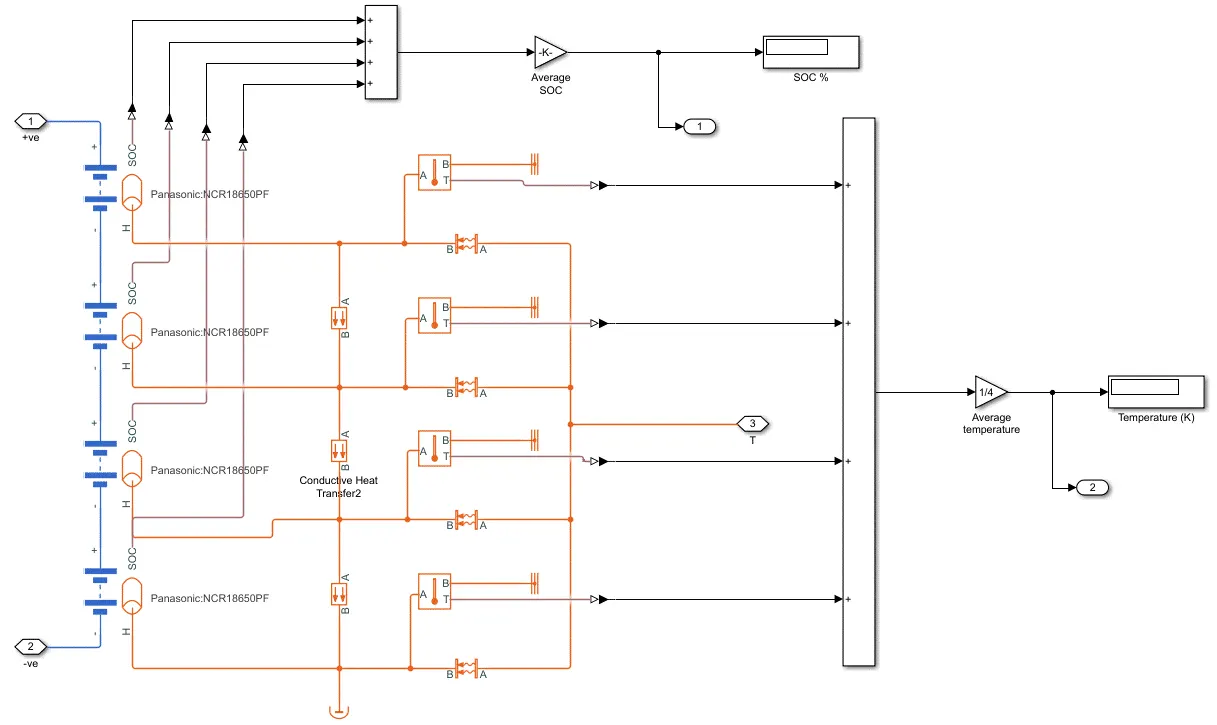
- Three modules have been connected together in series to make a 10 cell battery model
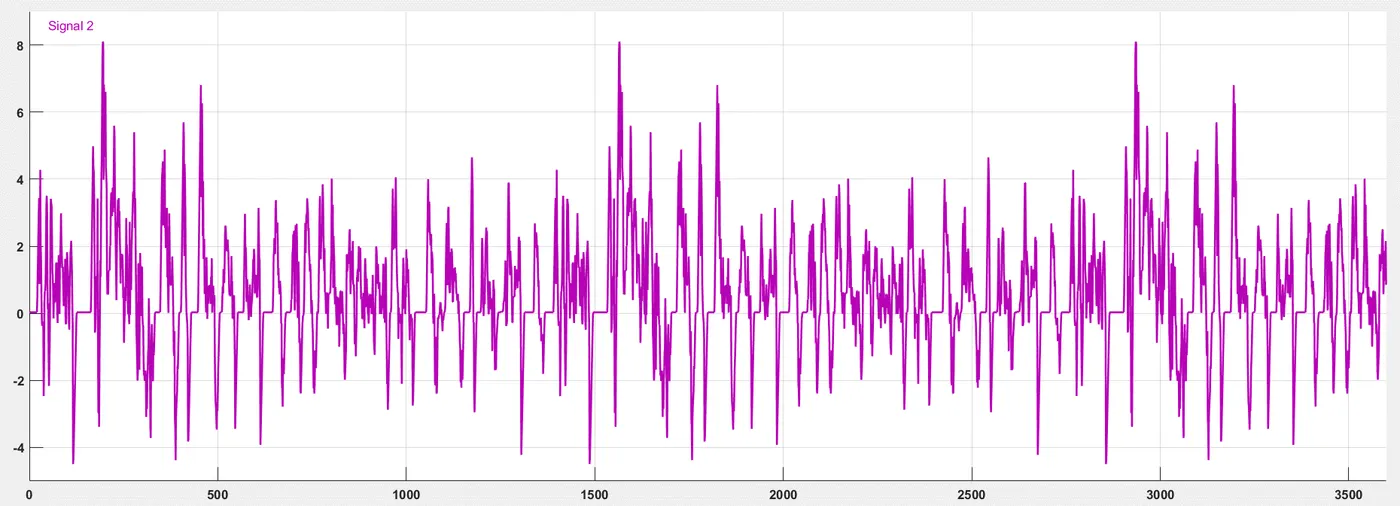
- UDDS cycle (current vs time) has been used to charge/discharge the batteries for 1 hour
- A resistor can be added to vary the rate of discharge
- All cells are initially at 25 degree C
- A temperature source is used to test the cell performance at four ambient temperatures: -10 degree C, 0 degree C, 25 degree C, 45 degree C
- Convective and conductive blocks have been added for heat transfer between blocks
CONSIDERATIONS FOR THE MODEL:
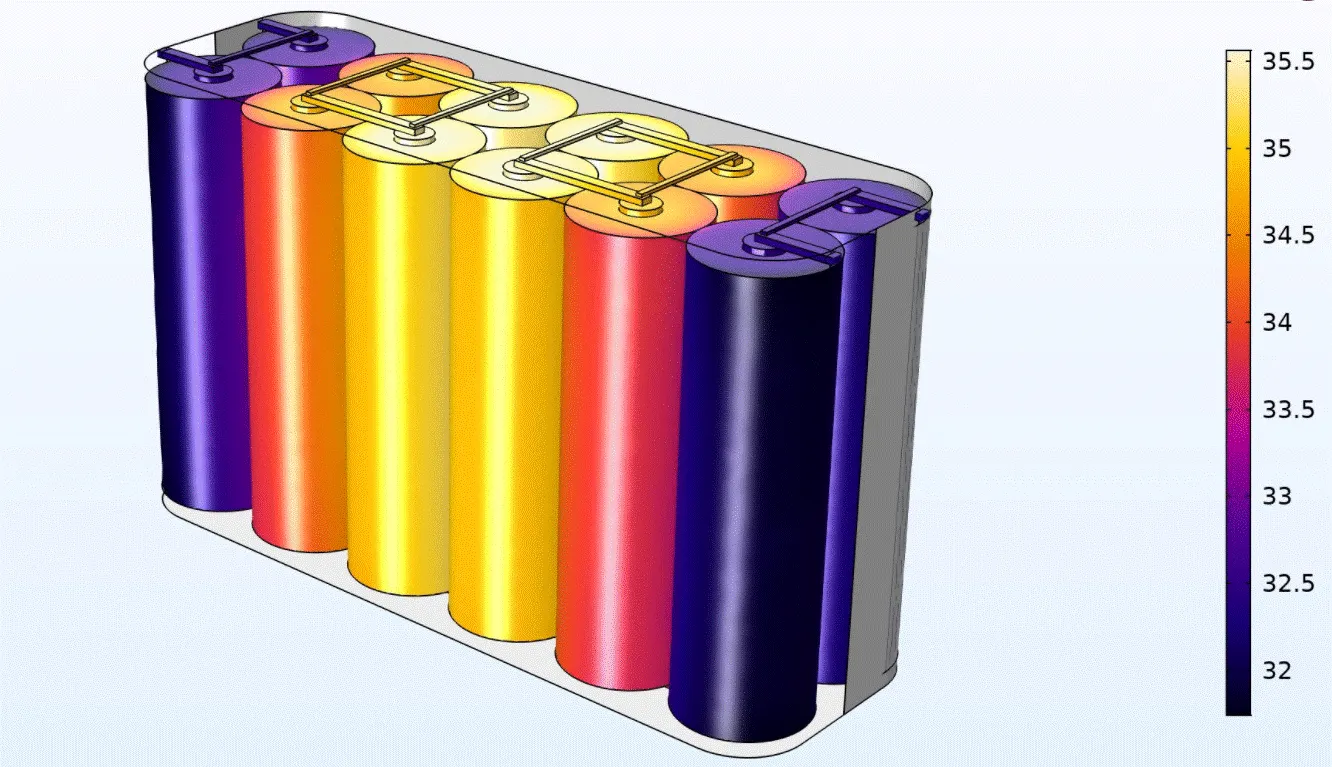
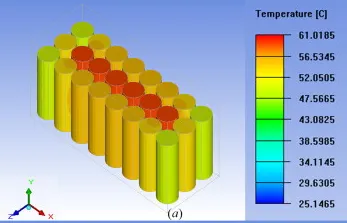
- Certain considerations can be derived through these figures that need to be taken into account when designing multiple battery modules connected together
- It is vital to note that the center of the battery pack will always be hotter than the rest of the pack. This is due to two reasons.
- Firstly, most other cells will be exposed to natural convection from the air, making heat dissipation much more effective. The cells in the center, however, need to dissipate their heat to the other cells since they are not exposed to the open air directly (as seen in the figure on the right). This makes the process slower and not as effective. So, at any point in time, the cells in the centre will be the cells with the highest temperature.
- Secondly, the cells in the center are surrounded on all sides by other cells, which in comparison have at least one end free where they are not in contact with another cell. This increased surface area of contact for those center-placed cells allows for greater heat transfer by conduction and convection.
- These factors have been incorporated into the thermal modelling of the pack for greater accuracy.
MODULE 1: CELLS 1 - 5
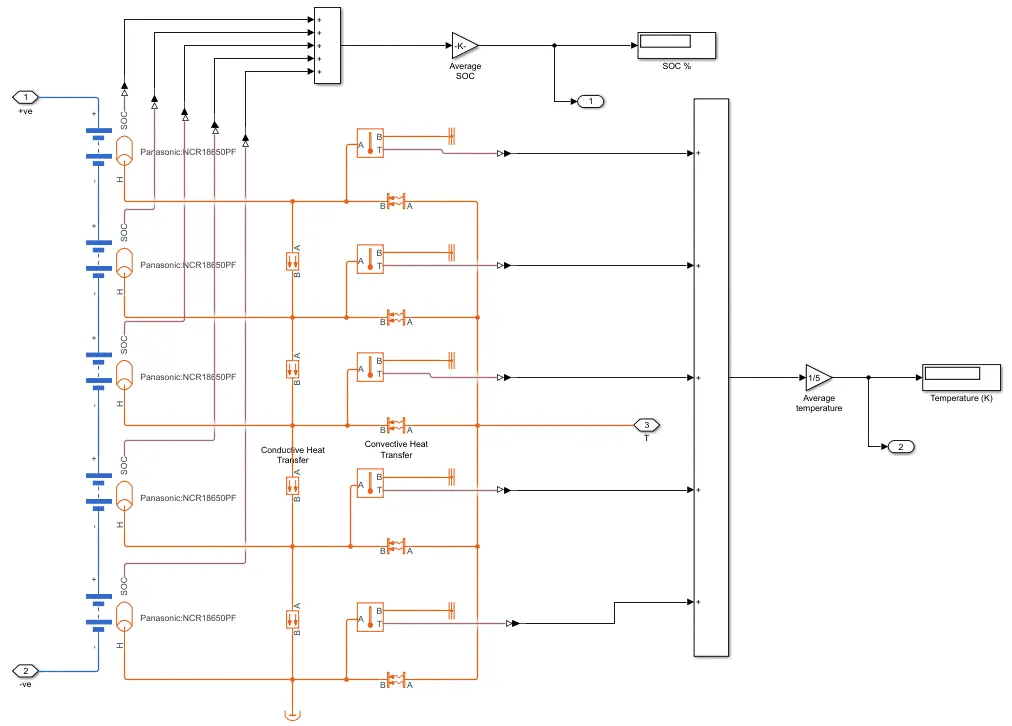
MODULE 2: CELL 6 (FAULTY) - an external resistor of 5 Ohms has been added
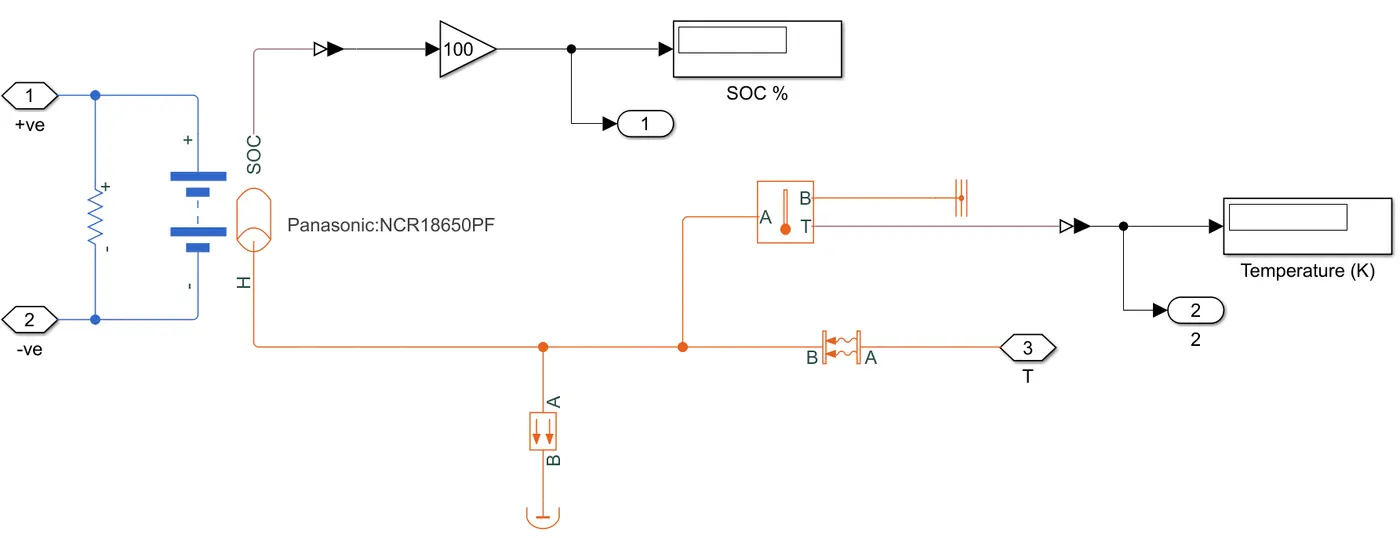
To incorporate for the positioning of this cell (center of the pack), certain changes have been made:
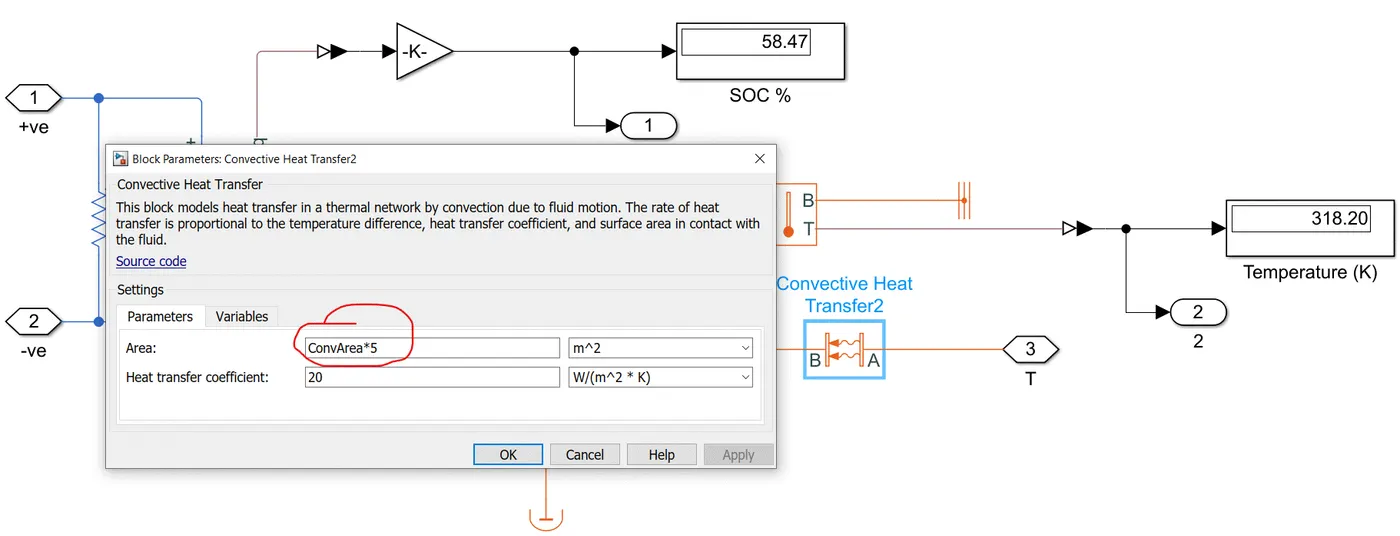
- The convective area is 1`m^2` for the remaining 9 cells, but has been increased to 5`m^2` here.
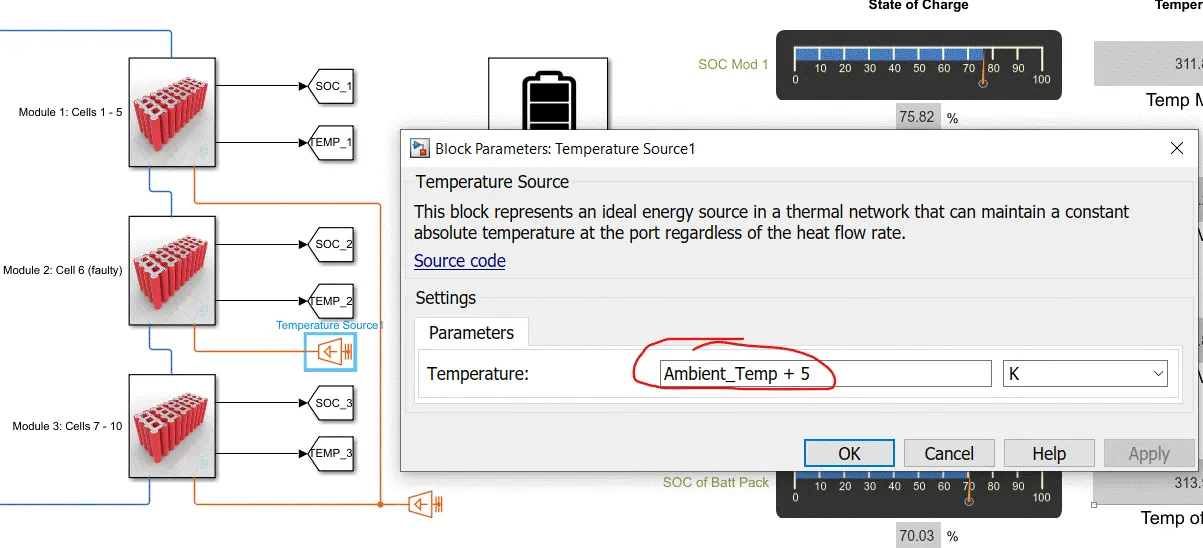
- The ambient temperatures provided to the remaining 9 cells are the same, but has an increment of 5 degrees for this cell
MODULE 3: CELLS 7 - 10
SIMULATING AT EXTREME HOT TEMPERATURE (318K or 45 DEGREE C): heat flows from temperature source to batteries
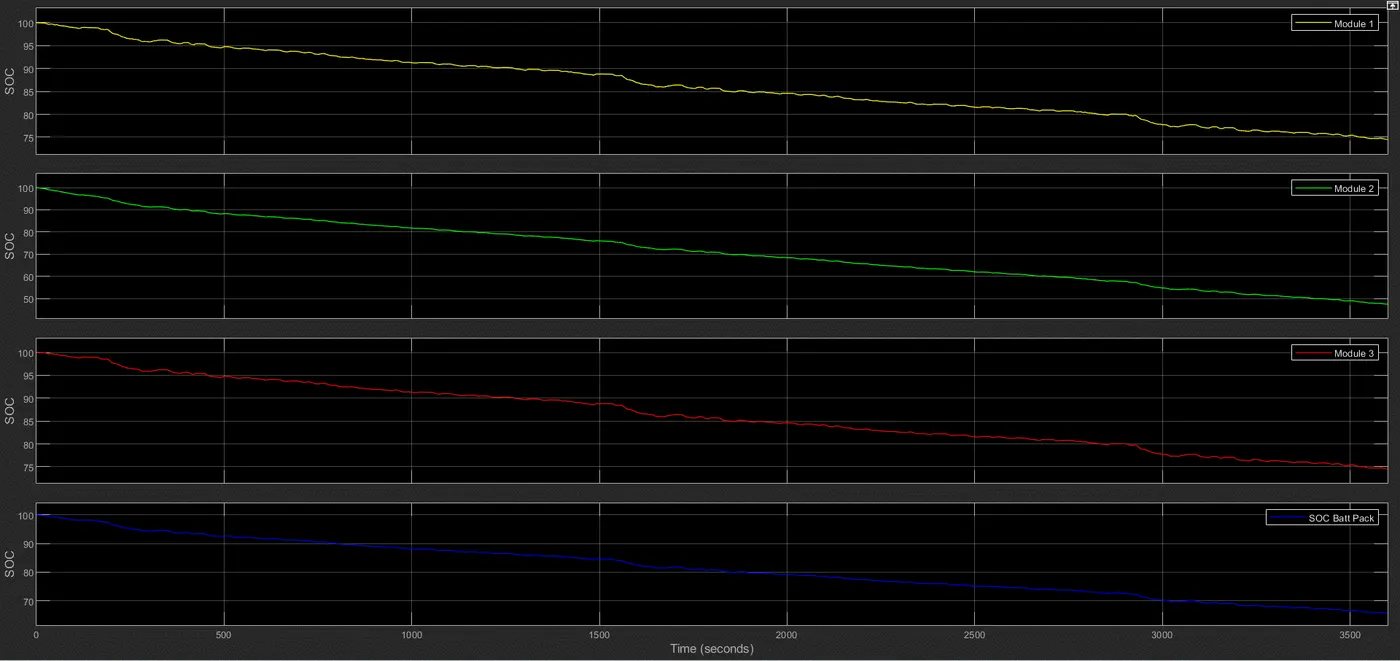
- Mod 2 has a much steeper slope than the others because of added ohmic resistance. A load (in the form of a resistor) with a resistance of just 5 Ohms will draw in more current compared to no added load, which means greater rate of discharge, and hence more drainage of SOC.
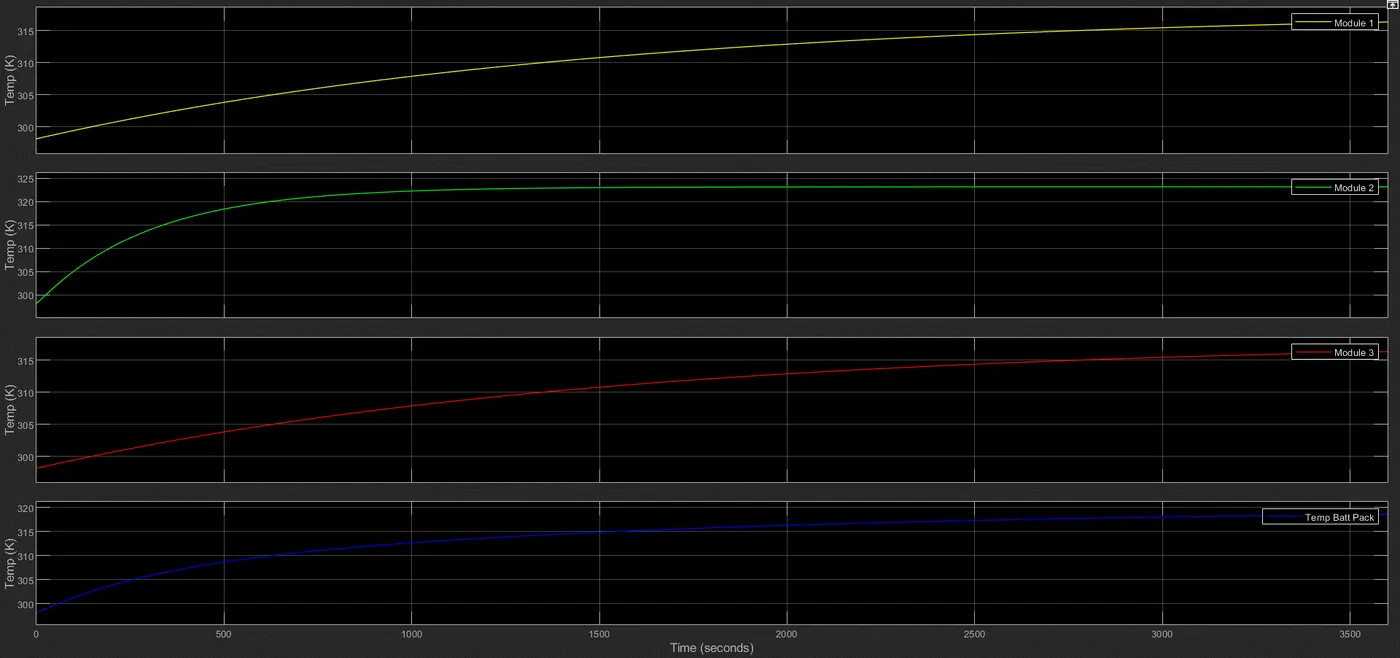
- Much steeper rise in temperature of Mod 2 compared to others due to increased surface area contact and its position being in the center of the battery pack
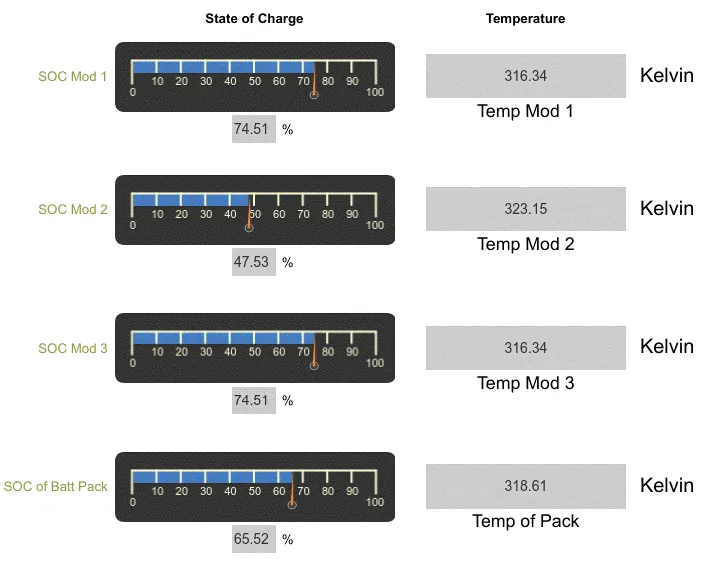
- Although ambient temperature supplied is 318K, Mod 2 reaches 323K (while the other cells are at 316K) for the aforementioned two reasons in addition to the fact that there is also added resistance in Mod 2.
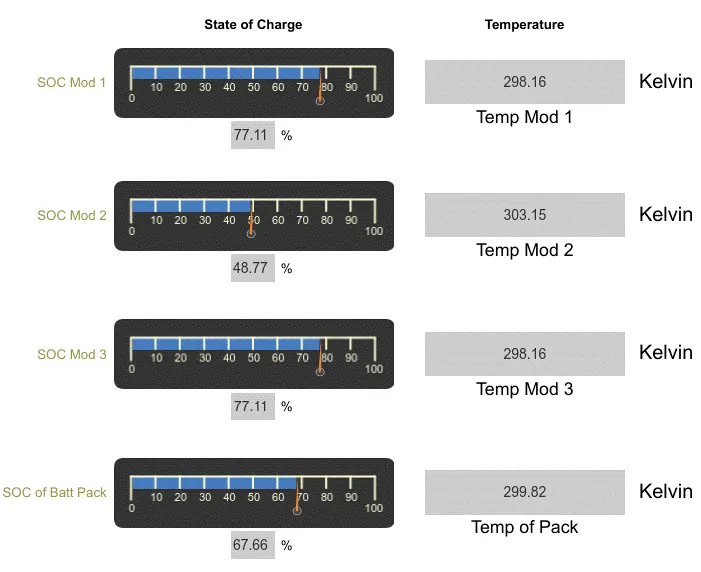
SIMULATING AT ROOM TEMPERATURE (298K or 25 DEGREE C): heat flows from temperature source to batteries
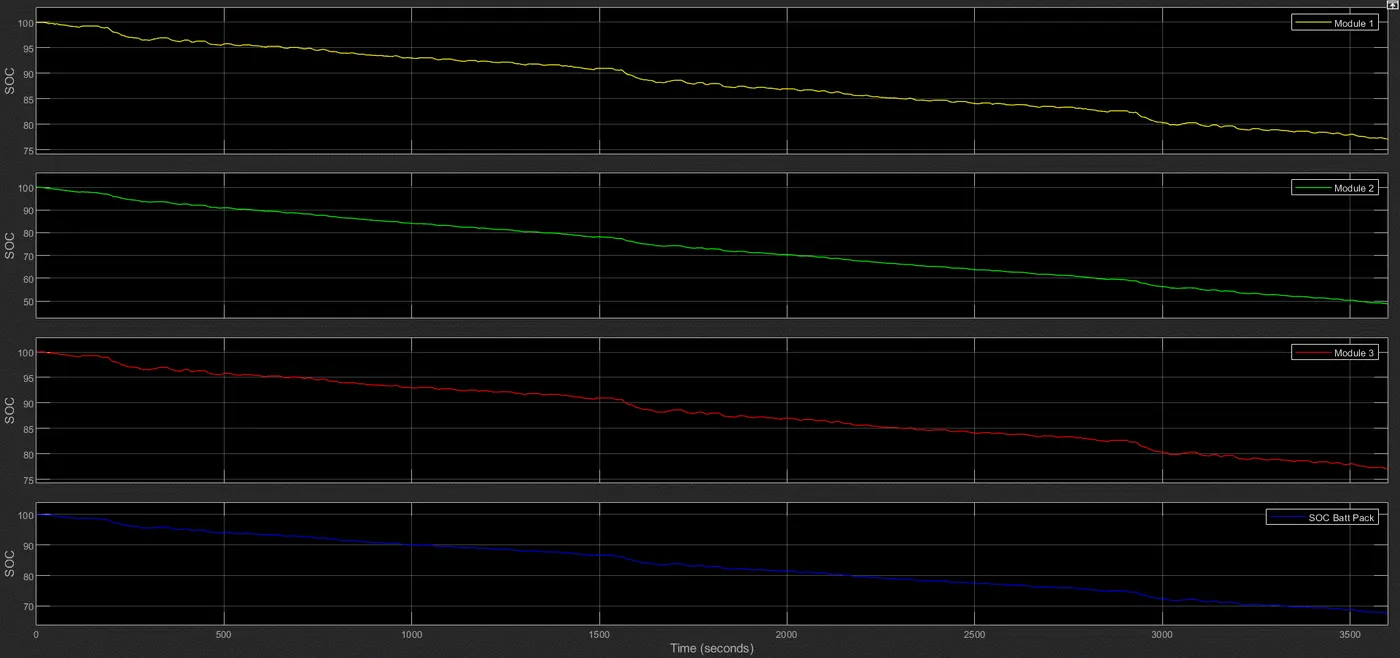
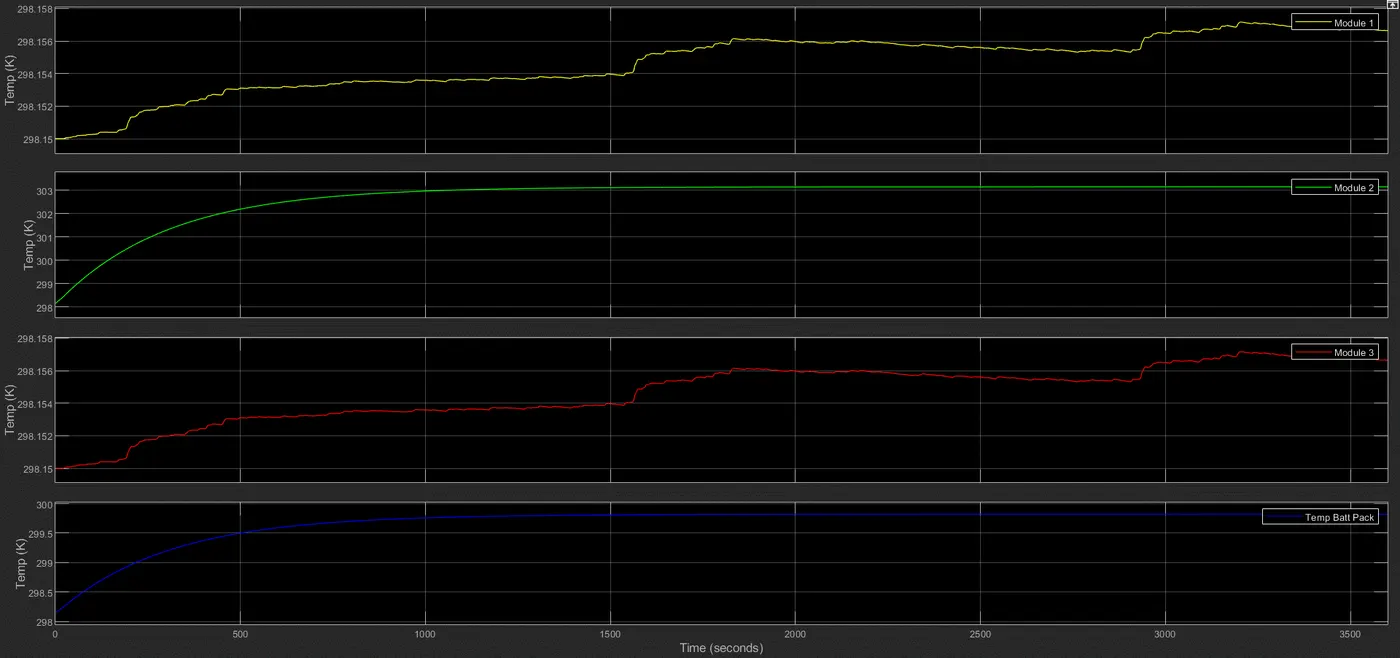
- Since temperature source and battery are at the same temperature (298.15), there should not be in any flow of heat energy according to the law of thermodynamics. Any minimal temperature increase in Mods 1 and 3 can be attributed to the heat produced due to the flow of current
- As for Mod 2, it has been explained why it will be at a higher temperature than the other cells.
SIMULATING AT COLD TEMPERATURE (273K or 0 DEGREE C): the battery is at 298K, so heat flow is reversed
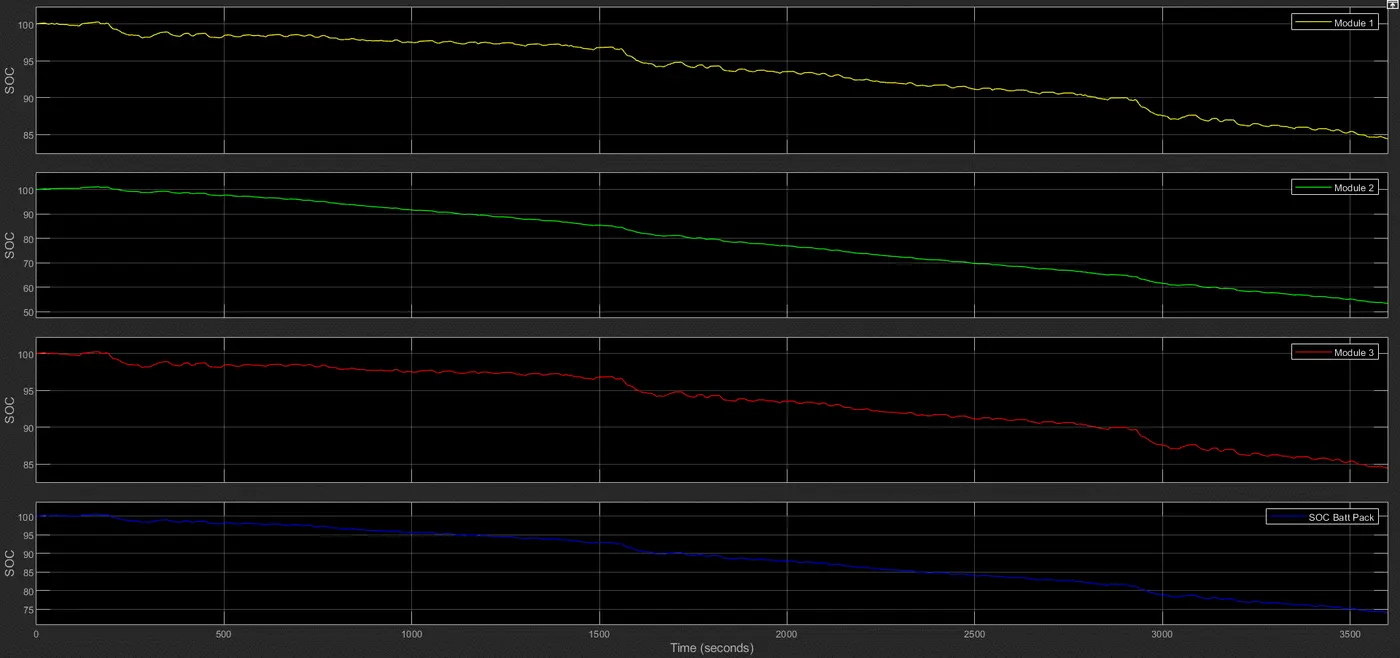
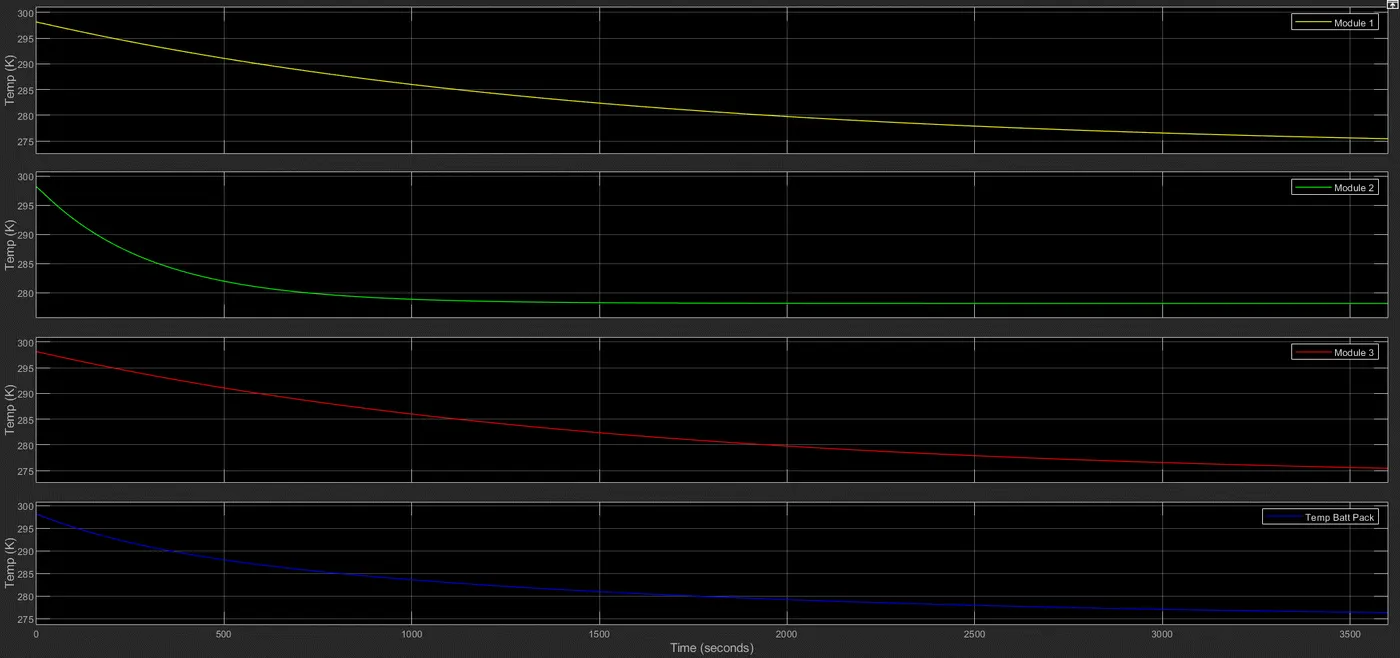
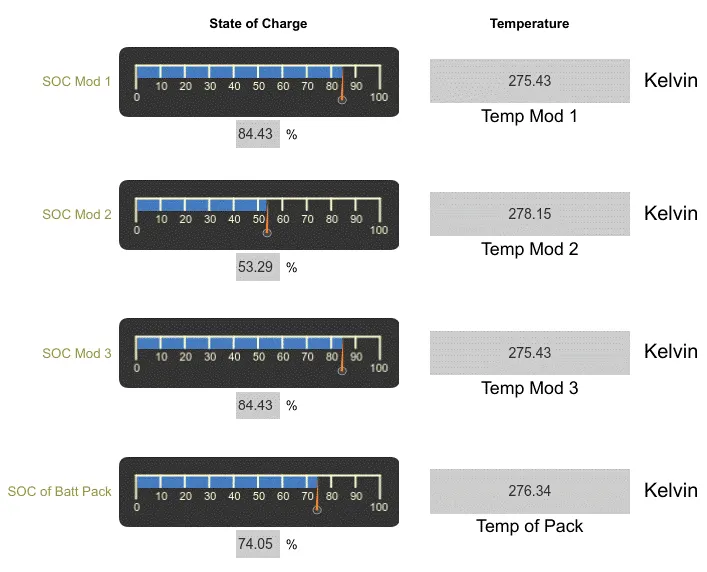
- Same reasoning applies to results at 0 degree C and -10 degree C: look at figures below for an explanation of how the model behaves at low temperatures
SIMULATING AT EXTREME COLD TEMPERATURE (263K or -10 DEGREE C): the battery is at 298K, so heat flow is reversed
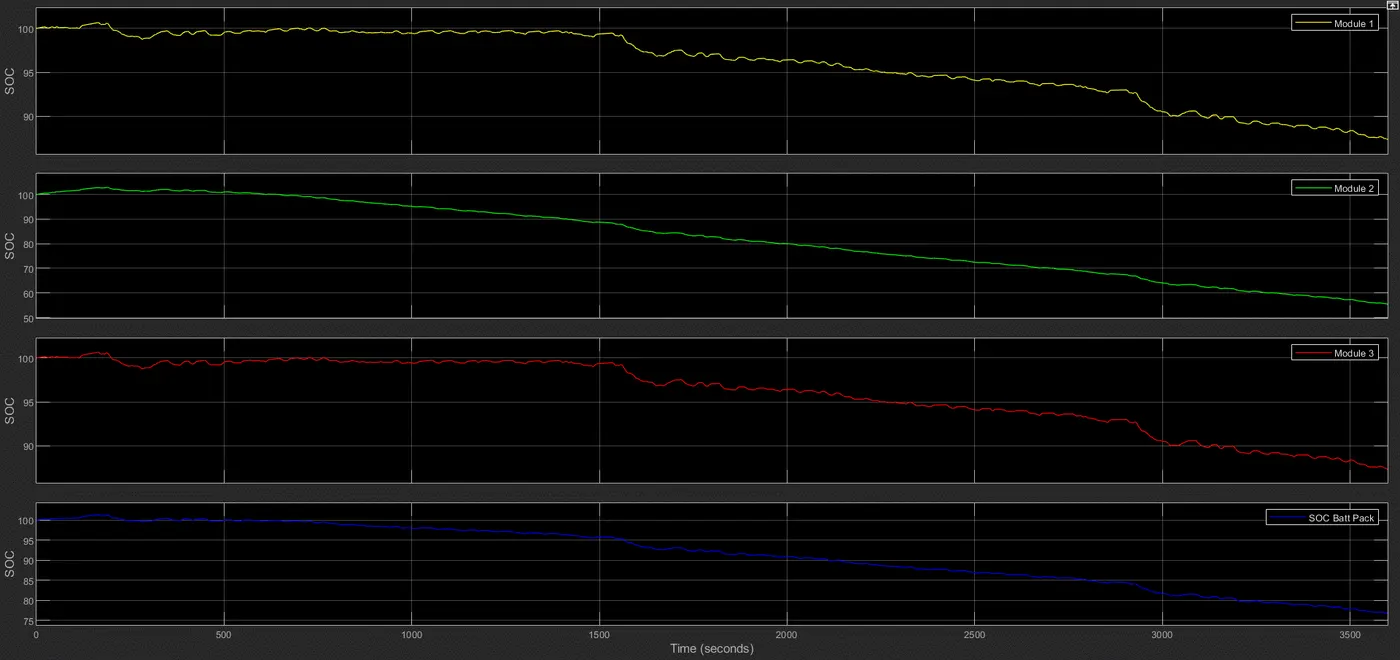
- At -10 degree C, the above graph demonstrates the difficulty in initial discharge. This is true in reality too - when its extremely cold it can be difficult to extract power from the battery because chemical flow within the battery becomes challenging.
- In Mod 1 and Mod 3, SOC remains at 100% until about 100 seconds, while in Mod 2 (faulty cell) SOC remains at 100% until about 500 seconds. Ohmic resistance has been added in Mod 2, which restricts current flow in addition to how difficult it is to discharge at this kind of temperature, and that's why it's behaviour is different than the other two modules.
- Since SOC limit has not been set at 1, it is exceeding the limit initially since the drive cycle demands negative current flow, hence charging the battery.
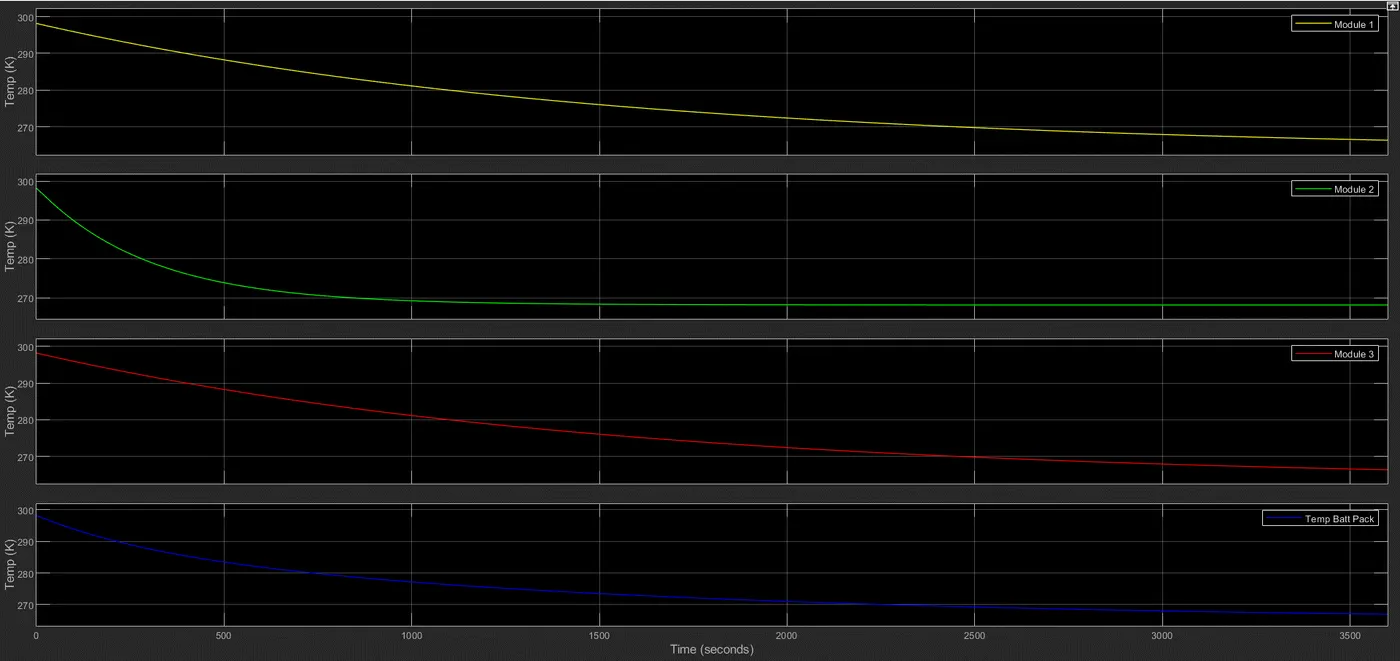
- Temperature slope of Mod 2 is much steeper as expected due to increased surface area of contact. So although it goes from 298K to 270K much more quickly than the other cells, it still stabilizes at 268K while the other cells can go down to 266K because the other cells are able to transfer more heat away into the atmosphere as they are more exposed to the free air.
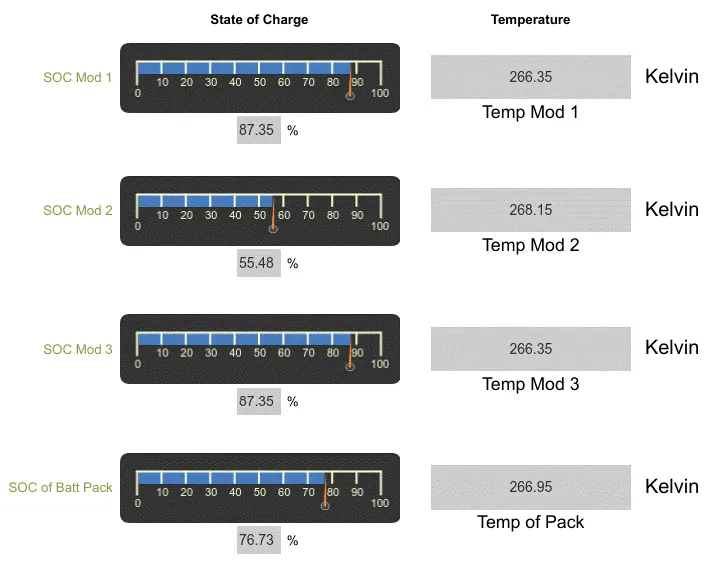
SUMMARY AND EVALUATION OF RESULTS:
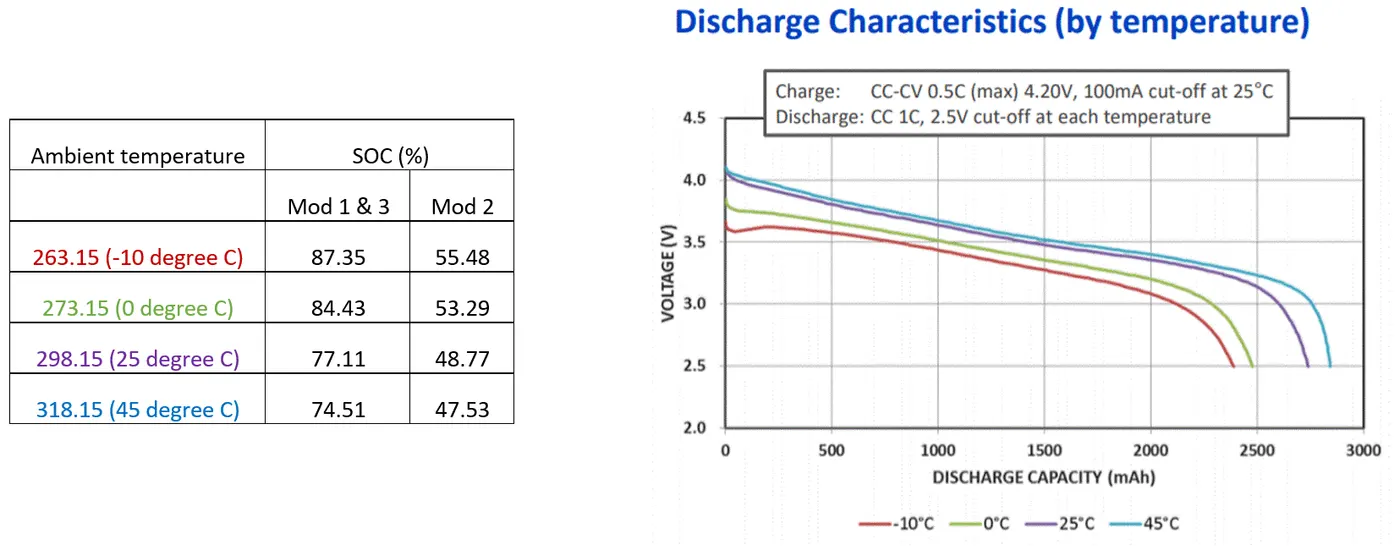
The figure on the right shows the characteristics of the Lithium-ion NCR18650PF batteries used in this model.
It demonstrates the effect of temperature on OCV and capacity. As temperature is reduced, ion kinetics are reduced and chemical reactions are exponentially slowed. In addition, charge transfer resistance also significantly increases at lower temperatures, which takes a lot more energy to discharge/charge the battery, hence reducing OCV and total capacity.
What this would also mean is increase in SOC as temperature reduces, as more usable capacity will be available. This is evident with the figure on the right.
However, the summarized results of this model on the left would present a different story if not understood correctly with reference to this model.
The results show that as temperature is increasing, SOC is reducing, which would directly go against Arhennius' Law of `k=Ae^(-E_a/(RT))` (where k = rate of reaction, T = temperature). This law states that the rate of reaction increases exponentially with an increase in temperature. Higher temperature enables higher mobility of the electrons and the chemicals reacting, allowing more power to be extracted and thus increasing the capacity that the cell can provide. Higher temperature should be improving SOC, but why do the results show otherwise?
There are certain limitations to this model. Firstly, just basing conclusions on SOC alone would be incorrect. Although at 263K SOC is at 87%, it does not mean that it provided the same energy density and power density as what the cells provided at 318K when their SOC was depleted to 87%. How much power density and energy density was provided in that 13% reduction in SOC is a massive factor that is not incorporated in this model. The performance of lithium-ion cells will degrade at lower temperatures, and they will only provide a fraction of the performance compared to what they would at higher temperatures. Having power and energy densities calculations would mean being able to display parameters like top speed, acceleration and range. This would have validated the results very well.
Secondly, SOC was not capped at 100%. From the SOC graphs above at 263K and 273K it is evident that SOC was increasing beyond 100% for almost the first 500 seconds. This points to how difficult it can be to discharge cells at cold temperatures. In addition, considering the drive cycle used for this model (below), there was continuous charging due to regenerative braking, making it rather easy for the cell to go beyond 100% SOC when it's having trouble discharging due to cold temperatures.
This could be solved by either having a drive cycle that has very little regenerative braking, or a simple purely discharge cycle with no current flow in the negative direction since we are purely interested in the effect of temperature on battery discharge here. That would ensure that SOC will not increase above 100%.
Another way this model could be explored further would be through building a CCCV charger and a DC fast charger to see the thermal effects of charging at various temperatures. Overall, this model has a lot of potential to be built further for much more accurate and detailed results.