Project 2 Thermal modeling of battery pack
Project 2 : Thermal modeling of battery pack
Aim: To simulate the thermal effects and compare life cycle performance at various temperatures, charge & discharge rates, for a 10 cell series lithium ion battery model ,using MATLAB.
Introduction:
In the recent years , battery powered transports have gained more popularity in common people and it is still growing. The battery electric vehicles (BEV), Hybrid EV, E-bikes, E-scooter etc. are widely seen in the current markets . The most important of this mode of transports is the Li-ion battery pack.
The lithium ion battery characteristics is very much depends on the temperature. It effects the safety, efficiency, capacity and overall performance of the Li-ion cells. The ageing of the battery accelerates with high temperature. So, managing temperature of the cells is a important aspect to frown upon. Thermal modelling is essential for predicting longevity and safe operation.
Reference description:
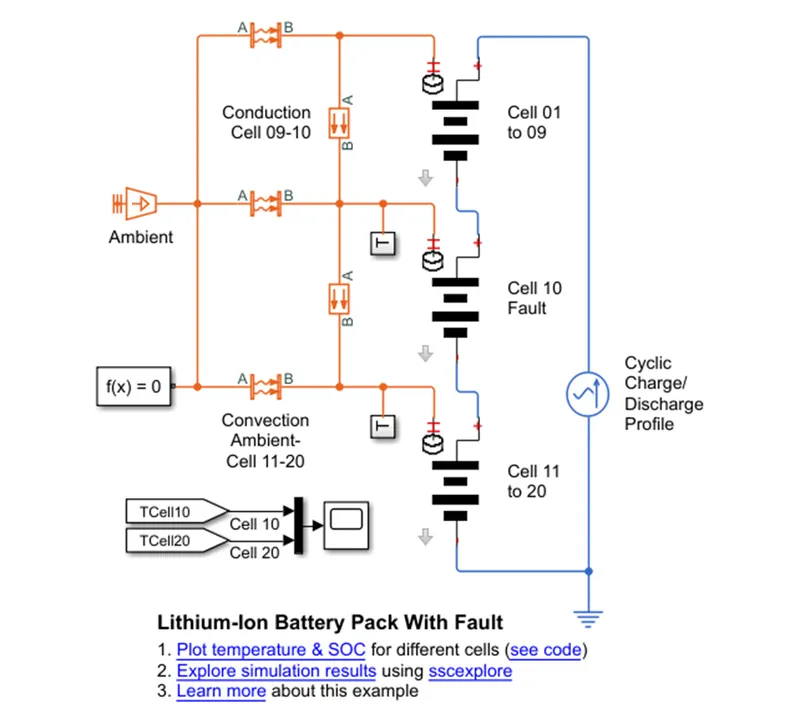
To attain the desired objective we took reference from the model developed by the Mathworks namely ’Lithium Ion Battery Pack with Fault’. This model simulates a battery pack with 20 cells connected in series to observe the performance, soc and cell temperature in different conditions including faults.
This model is edited out to simulate for 10 cells and study the results.
Model description:
The block diagram of the model under study is given below-
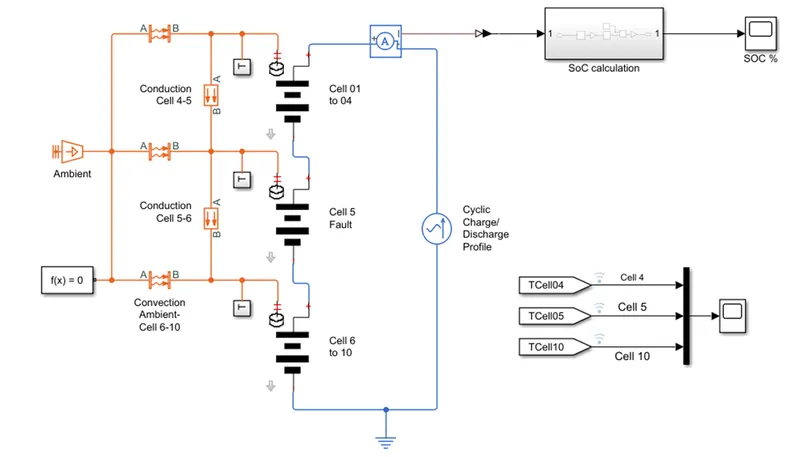
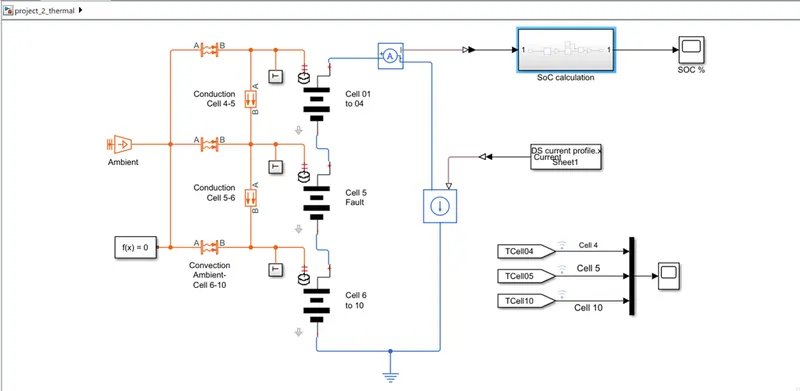
In the model, the 10 Li-ion cells are are connected in series with an AC source that provides cyclic charge and discharge profile. A current sensor is connected to calculate the overall soc of the battery pack. The 10 cells are divided into 3 groups – from cell 1 to 4 ; cell 5 and from cell 6 to 10.
- The subsystem for cell 1 to 4 is given below –
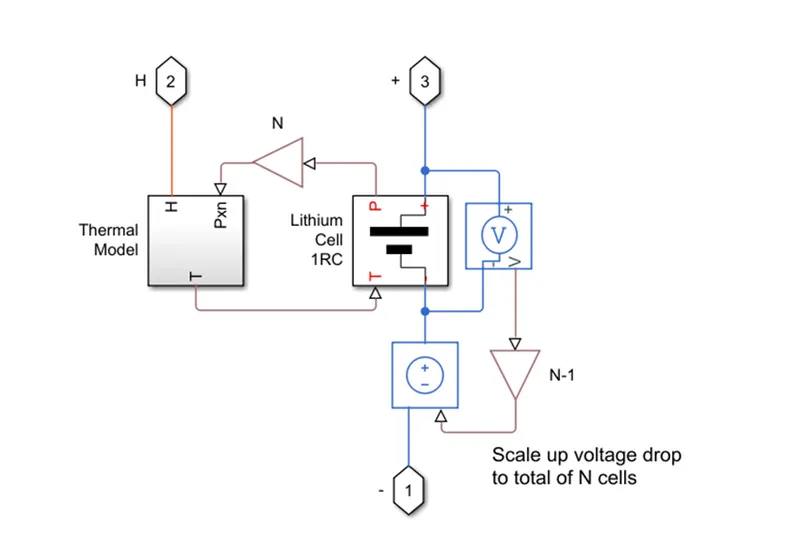
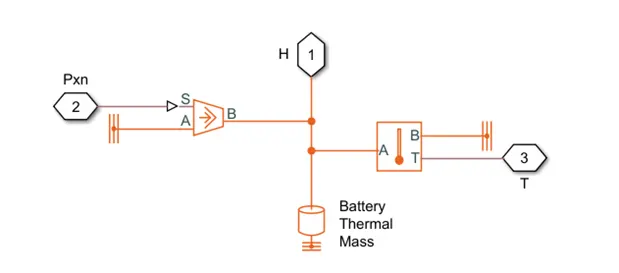
- The subsystem comprises of a thermal model , a Lithium cell 1RC block , a voltage sensor, a controlled voltage source and a gain block . The thermal model gives the temperature and the thermal effects of the cell. The thermal model is created as the figure given-
- The Lithium cell 1RC block represents a li-ion cell and the gain block is used to scale up the voltage of 4 cells; which essentially makes lithium cell to exhibits characteristics of 4 cells.The voltage sensor used represents an ideal voltage sensor, that is, a device that converts voltage measured between any electrical connections into a physical signal proportional to the voltage.
The Lithium cell 1RC block is made as shown in the image.
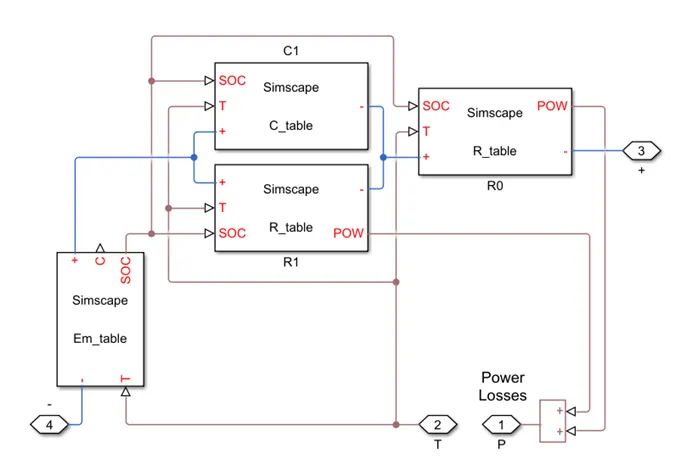
Similar blocks are seen in the other two groups of the cells (i.e. cell 5 and cell 6-10).
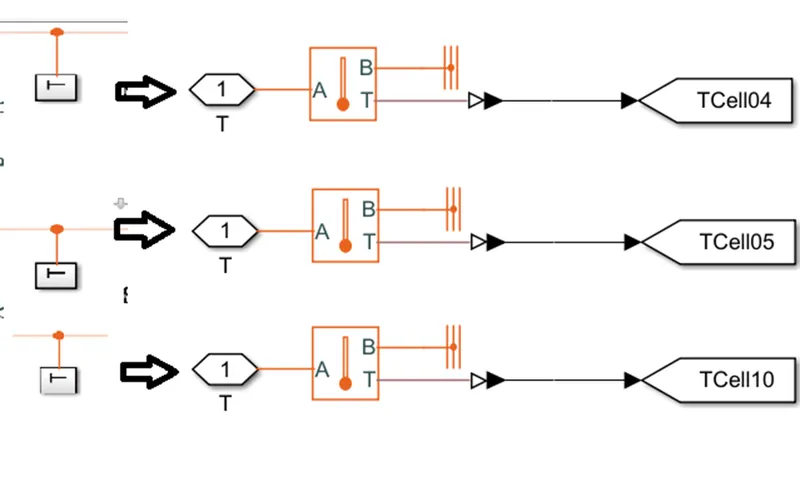
- To monitor the cells temperature , thermal sensors are connected in each group of cells. The temperatures are tagged and then connected to a scope outside the subsystem. The figures below shows the same.
- Now, to replicate heat transfer between surrounding environment and the battery pack, conduction and convection blocks are brought to use. The ambient temperature is given by the ideal temperature source labelled as ‘Ambient’. The heat is transferred to the cells via convection, this phenomenon is replicated by adding 3 ‘convective heat transfer’ blocks with each of the cell groups. Also, heat will transfer from cell to cell inside the battery pack by conduction which is represented by adding ‘conductive heat transfer ‘ blocks.
The convective heat transfer block is used between- (i) Ambient and cell 1-4 ; (ii) Ambient and cell 5; (iii) Ambient and cell 6-10.
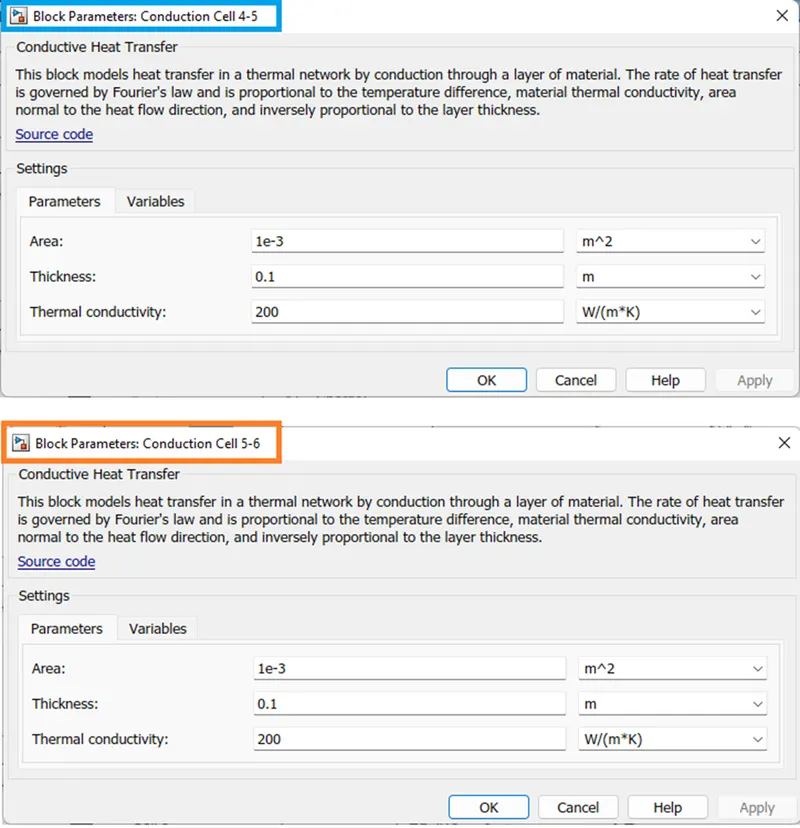
The conduction heat transfer block is used in between – (i) cell 4 and 5 ;(ii) cell 5 and 6 .
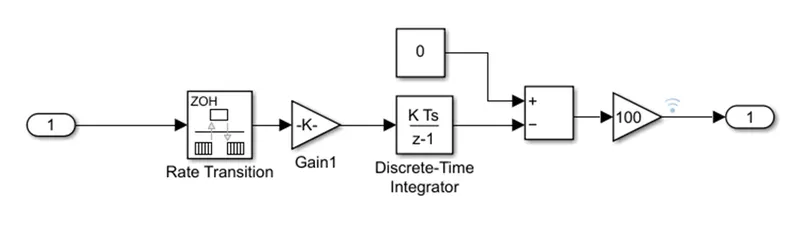
- SoC calculation : The SoC of the pack is calculated by integrating the current values over the time of simulation period. The subsystem created is given below.
Block Configurations and Parameters:
(a)Battery pack settings-
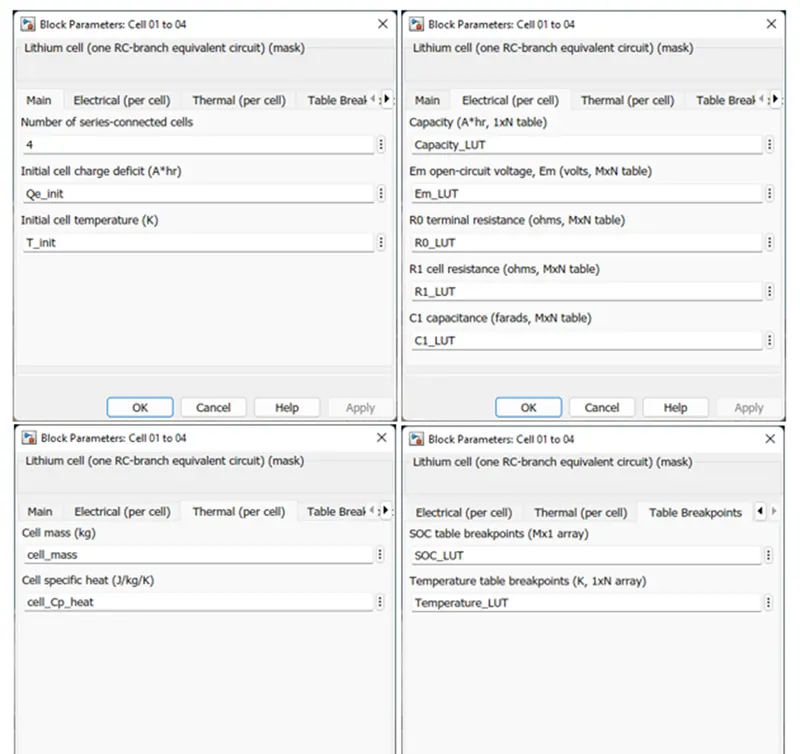
- Cell 1 to 4: The cells 1 to 4 are grouped together and are configured as shown by the figures-
- Cell 5: Cell 5 is configured as to show high temperatures as the cell in the middle gets heated more, which also effects its electrical capacity. The figure is given below-
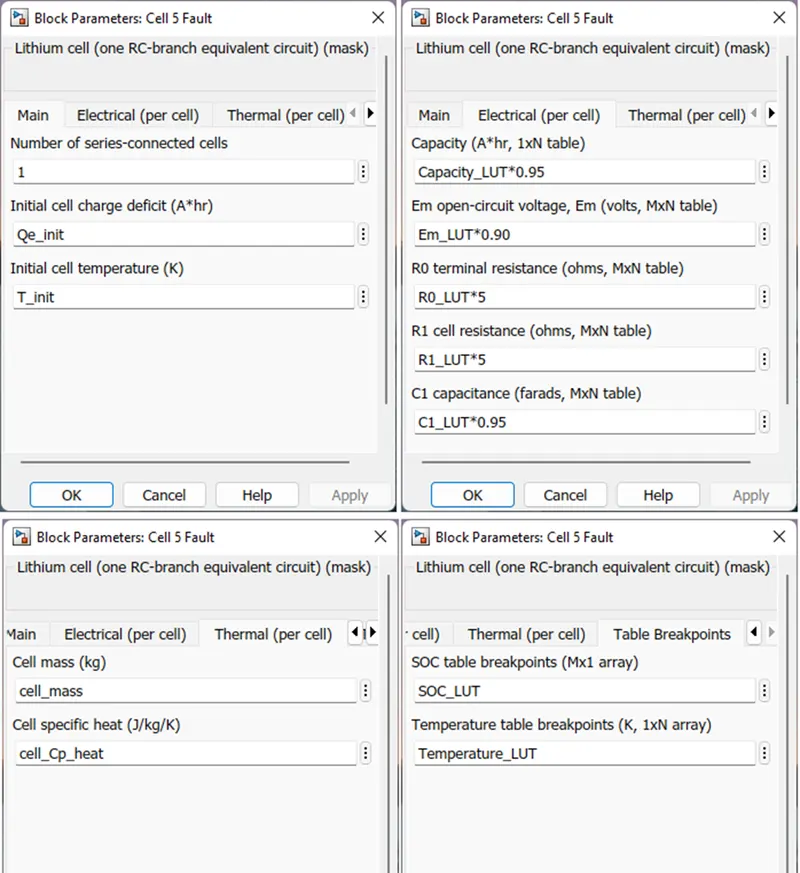
- Cell 6-10 : This 5 cells are configured similarly as cell 1-4, only exception is the no. of series connected cells which is 5 in this case.
(b.) Convective Heat Transfer Blocks:
Ambient to cell 1:- This convection block is configured as shown below.
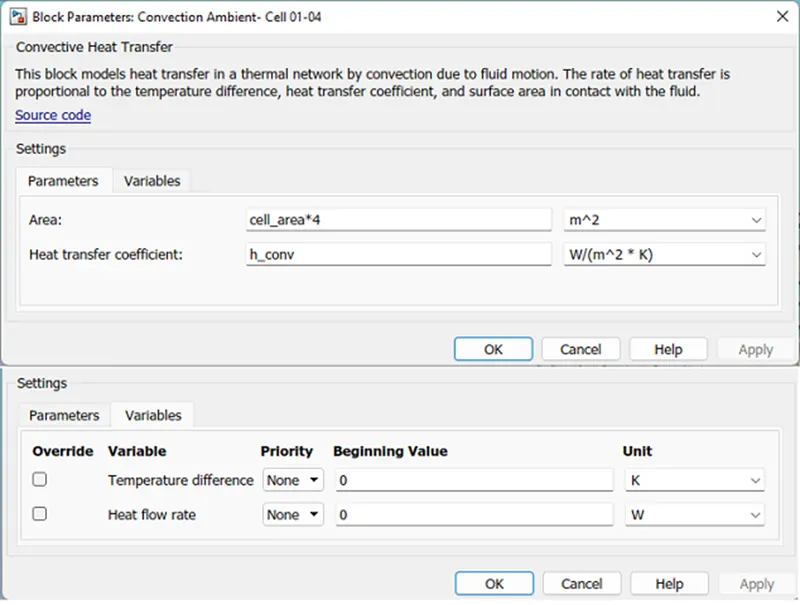
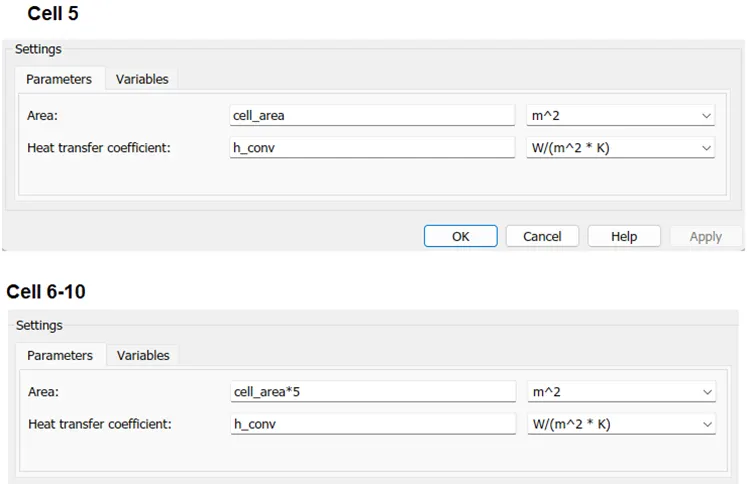
Similarly the other two blocks i.e. ambient to cell 5 is configured with cell area of one and the convective block between ambient and cell 6 is configured with cell area of five times. The variables tab is left at default value.
(c) Conduction heat transfer block : The conduction heat blocks models heat transfer in a thermal network by conduction through a layer of material. They are configured as below-
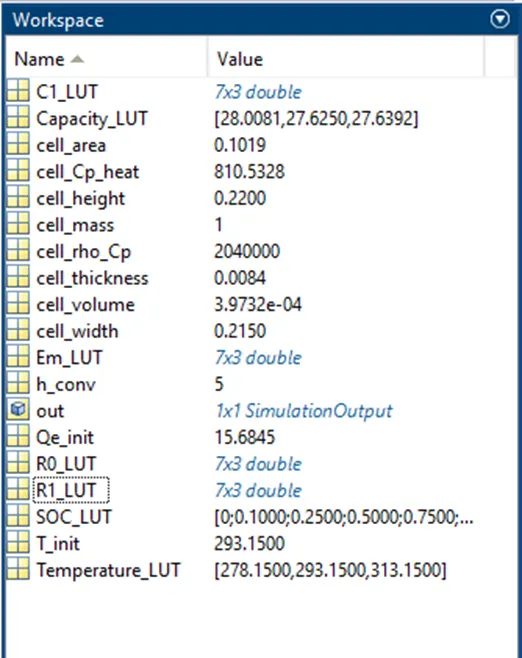
(d) Workspace variables: The variables used in the model are initialized in the workspace from the .mat file. The parameters are shown here-
Simulation Condition and Results:
- Cyclic charge and discharge :
At the first test the ambient temperature is kept at 293.15 K. the battery pack is subjected to cyclic and discharge for a period of 7200 secs. The charging and discharging happens at current 50 A. The model is simulated and the results obtained are discussed below.
(i)Cell temperatures:
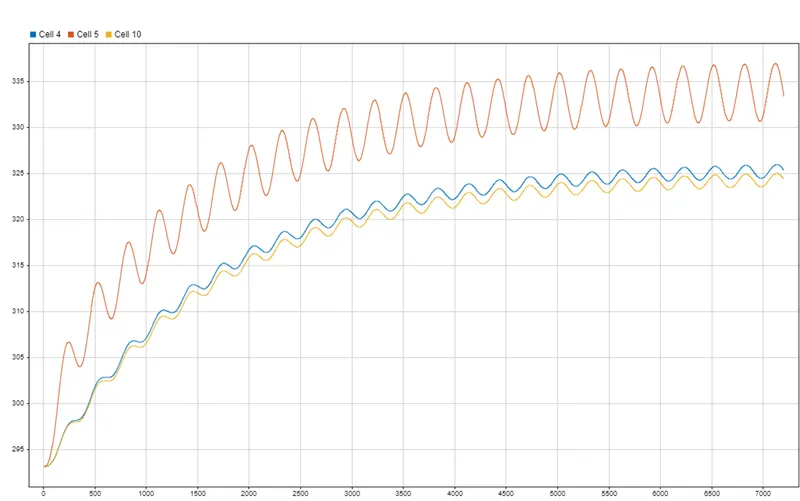
This plot shows the temperature variation of the cells 4, 5 and 10. As we can see, all cells start with same temperatures of 293.15 K. With increase of time, cells are subjected to numerous charge and discharge cycles. The cells at the edges doesn’t experience much high temperatures as of the middle. The cell 4 sees maximum temperature of 326 K, whereas the cell 10 experiences 325 K . However, the cell 5 which is in the middle, gets heated up more. The temperature rises from 293 K to 336 K at the end of the simulation. This cell 5 sees the highest temperature of all cells.
(ii)SoC:
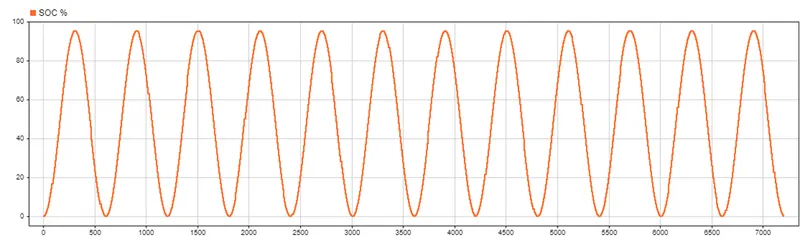
The SOC plot shows the overall state of charge of the battery pack. The battery pack is charged till 95% because the cell no 5 is kept at 0.95 capacity and that cell is also having highest temperatures. Cell 5 is basically filling the role of weak cell here. The SOC plot also exhibits a sinusoidal nature .
(iii)Heat Conduction :
- Cell 4 to 5:
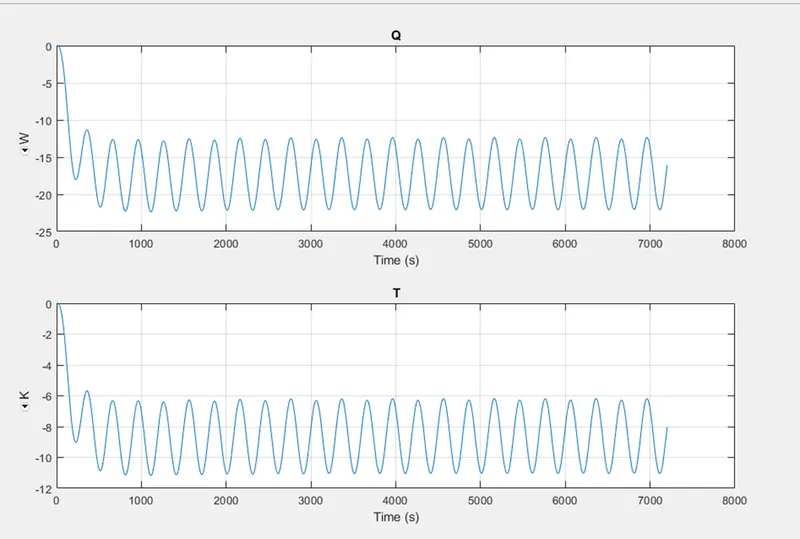
This plot shows the heat conducted from cell 4 to cell 5. We can observe that at the beginning it 0 watts, as time elapsed negative values are recorded. This is primarily because the heat is going from cell 5 to cell 4 ; as cell 5 was hottest during the simulation. The highest heat conduction seen is around 22 W. The second plot shows the temperature difference of the cells. This makes a clear resemblance with the temperature plot seen above. The maximum difference recorded is 11 Kelvin.
- Cell 5 to cell 6:
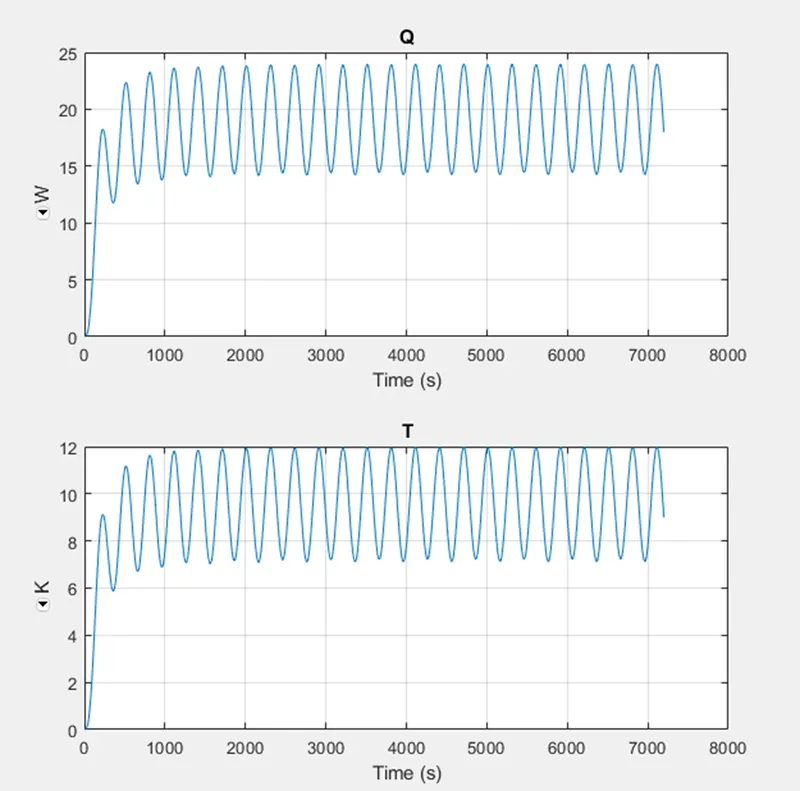
This plot shows heat conduction and temperature difference between Cell 5 and cell 6. The heat from the cell 5 is conducted to its nearby cell 6. The highest amount transfer recorded is around 24 W. The cell 5 and 6 , has a tremendous temperature gap also. The Cell 6 runs around 10-12 K cooler than cell 5 during charging most of the simulation time. However, in discharging this value comes down to a minimum 7 K.
(iv)Heat convection:
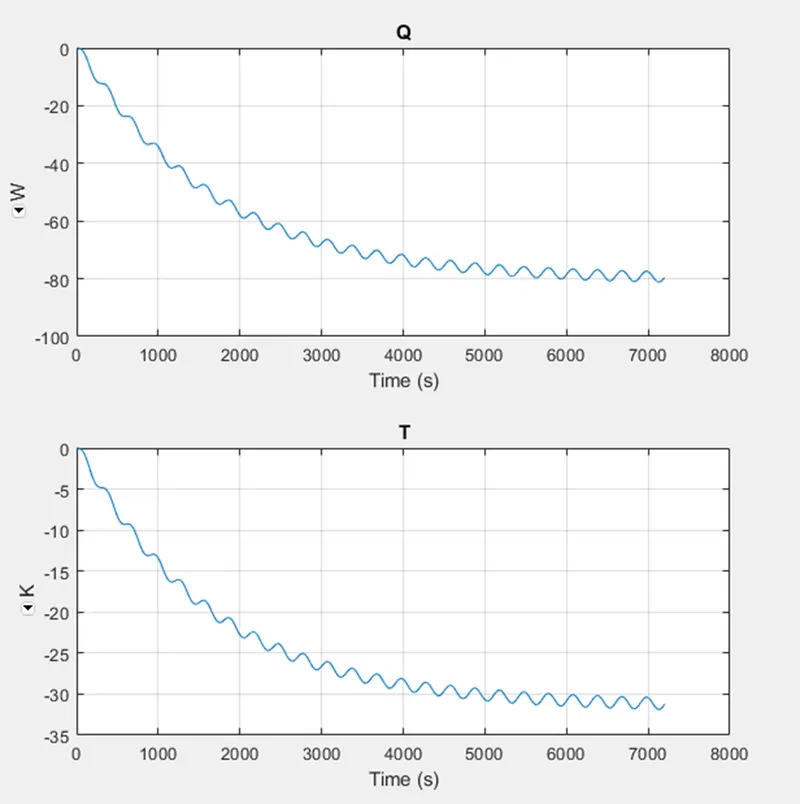
This is section of results generally tells how much heat is exchanged between cells and the ambient. The ambient temperature is at 293.15. As the model is subjected to charge and discharge cycles , the cells get heated up. Some of this heat is realeased in the surroundings via convection. The plot below shows the heat convection wrt. time and also temperature difference is wrt. time for cells 1-4, cell 5 and cells 6-10.
- Cell 1-4 : We can see a gradual temperature difference and heat transfer.
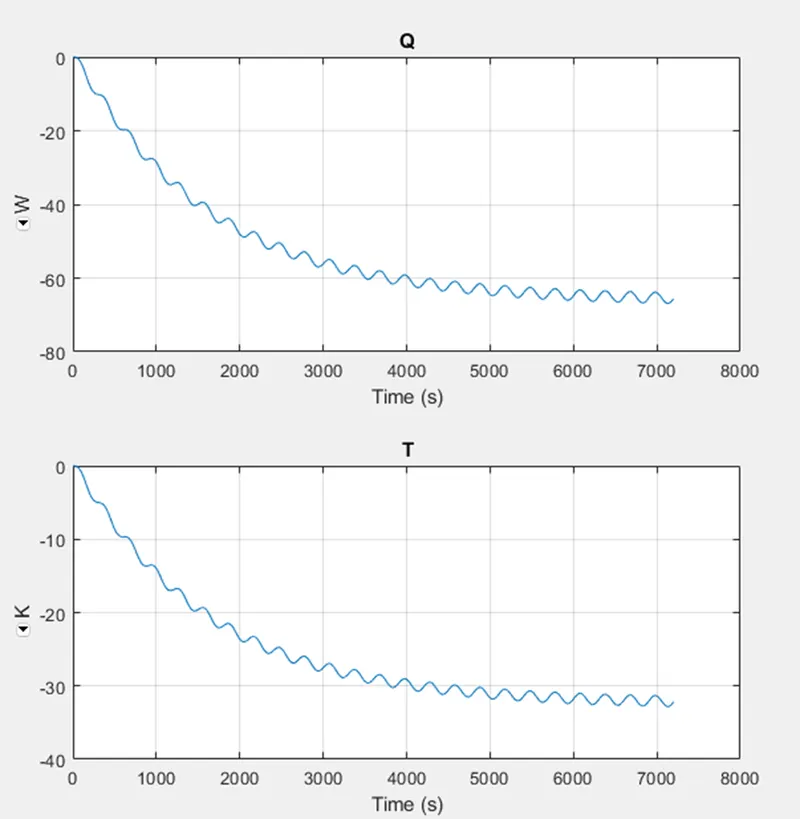
- Cell 5: The temperature difference is highest in this case compared with the other two cell groups.
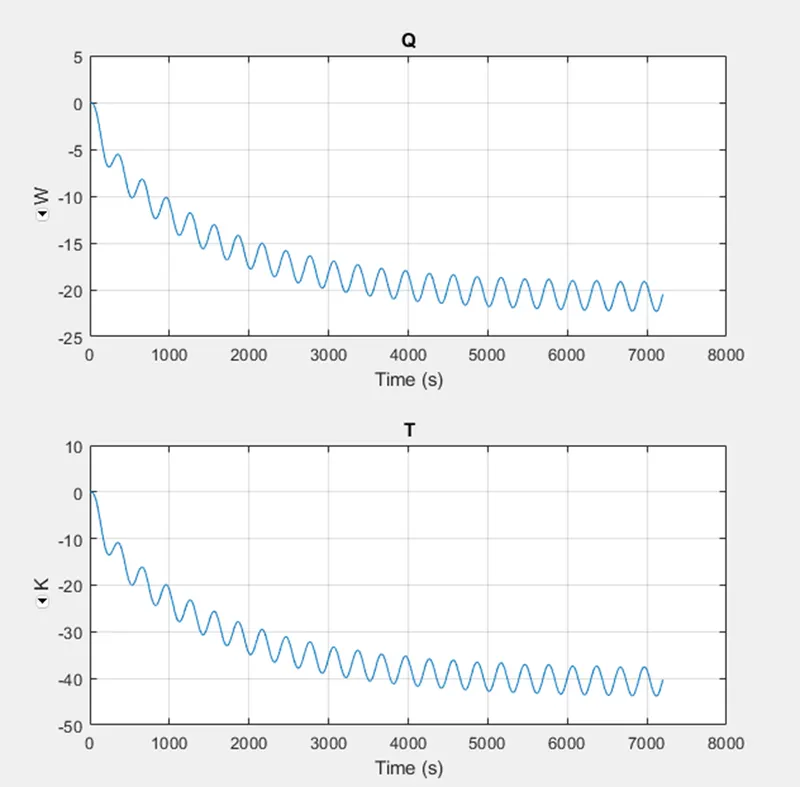
- Cells 6-10:
(v) The cyclic charge and the discharge cycle :
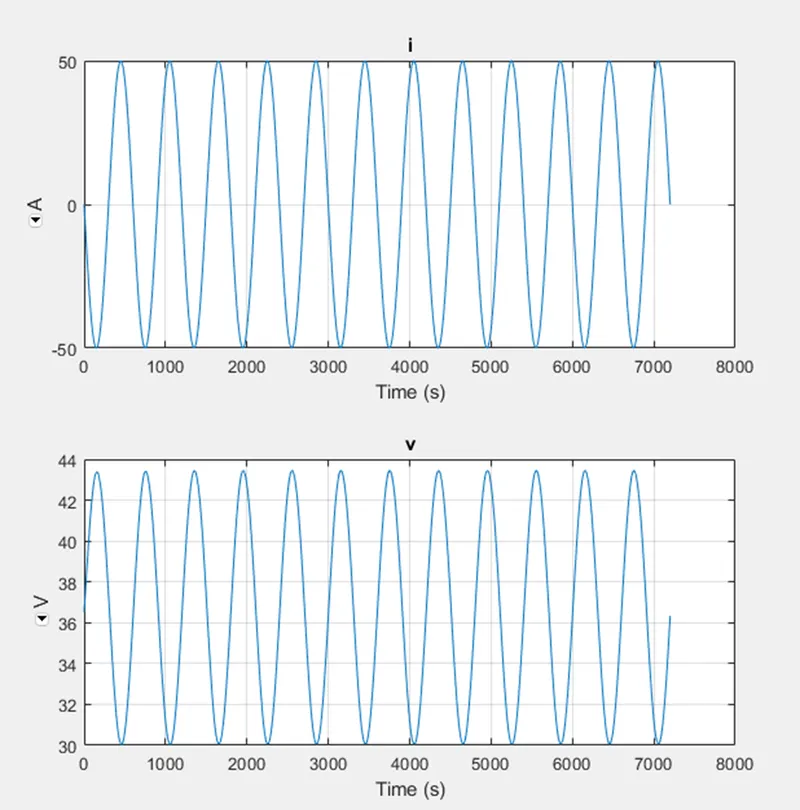
The battery pack is test for this cycle over the course of 2 hrs or 7200 secs. The negative value of current implies charging , while positive value represents discharging of the battery pack. The second plot shows the voltage variations during the process.
2. Test-2 with cyclic charge and discharge:
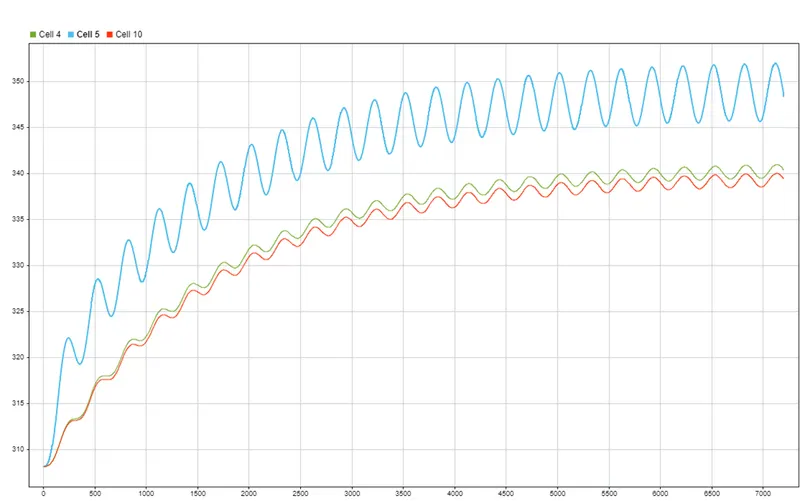
In the second test to see the effects when tried to charge a the battery in hot environment the ambient temperature is kept at 308.15 K or 35 degC .The cells are started as fully charged. The cells 1 to 4, cell 5 and cells 6-10 are kept at 308, 313 and 318 K respectively at the beginning of the simulation. The model is again tested for cyclic charge and discharge profile for 7200 seconds. The resultant plots are given below.
(i)The cell temperatures:
This plot shows the temperature differences of the cells 4,5 and 10. The plot shows that at starting all 3 cells are at ambient temperature. For all the 3 cells, the temperature increases highly during charge process , and drops by few kelvins during discharging. The cell 5 shows highest temperatures at around 352 K; whereas highest points for cell 4 and 10 are 341 K and 340 K respectively.
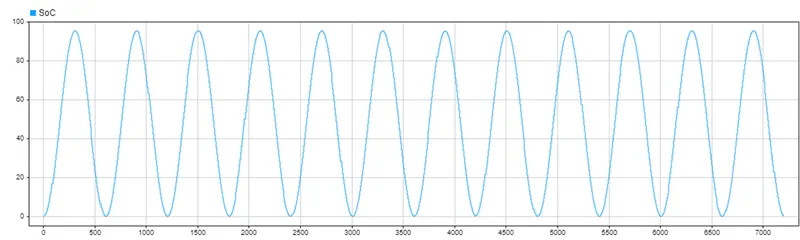
(ii)SOC : This plot shows the overall state of charge of the battery pack. The rise in the curve depicts charging and fall depicts discharging process. It takes around 600 seconds to complete 1 charge and discharge cycle. It takes around 600 seconds to complete 1 charge and discharge cycle.
(iii)Heat conduction: Inside the battery pack heat is conducted from cell to cell over time. Primarily heat is transferred from the hot cell to relatively cold cell . So heat will flow from cell 5 to cell 4 and cell 6. The plots for heat conduction is shown below for both cases.
- Cell 4 to cell 5: This plot shows the transfer of heat from cell 4 to cell 5. We did see the negative values because cell 4 is receiving heat from cell 5 ; so heat flow direction is opposite of the direction of the measurement. We observe maximum temperature difference of 11 K and minimum being 5.9 K.
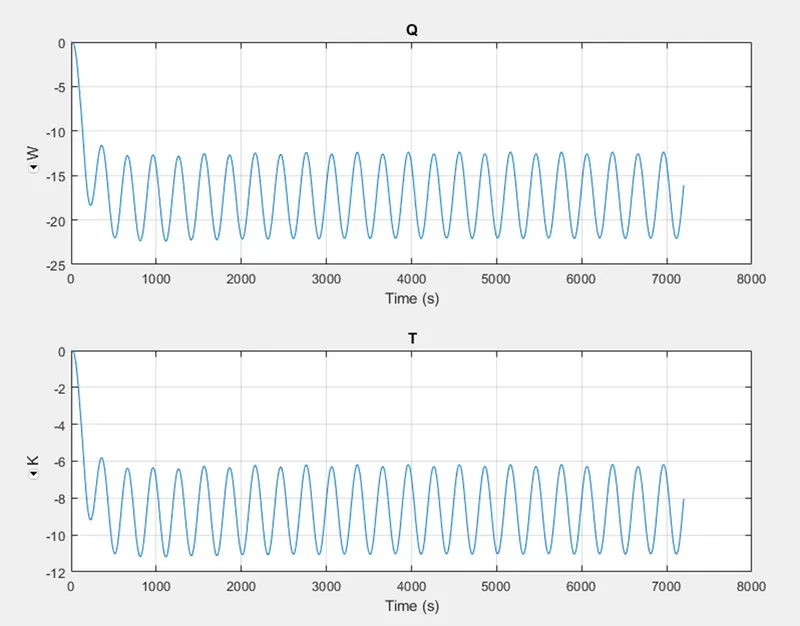
- Cell 5 to Cell 6:The heat conducted from cell 5 to cell 6 is shown in the plot below. The heat transferred has max. values around 24 W whereas temperature difference is seen to be 12 K maximum.
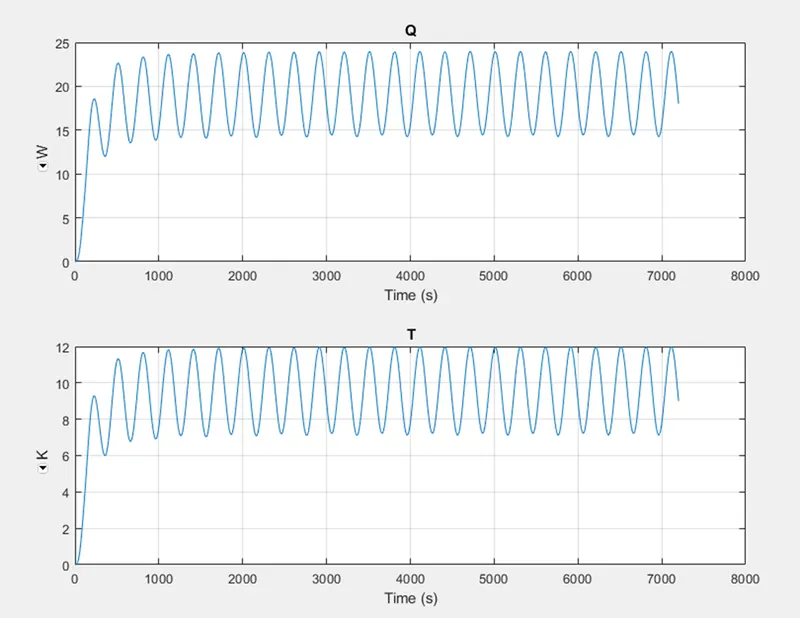
(iv)Heat convection : The heat that is convected from ambient to all the cells are given in this plot.
- Ambient to Cell 1 to 4:
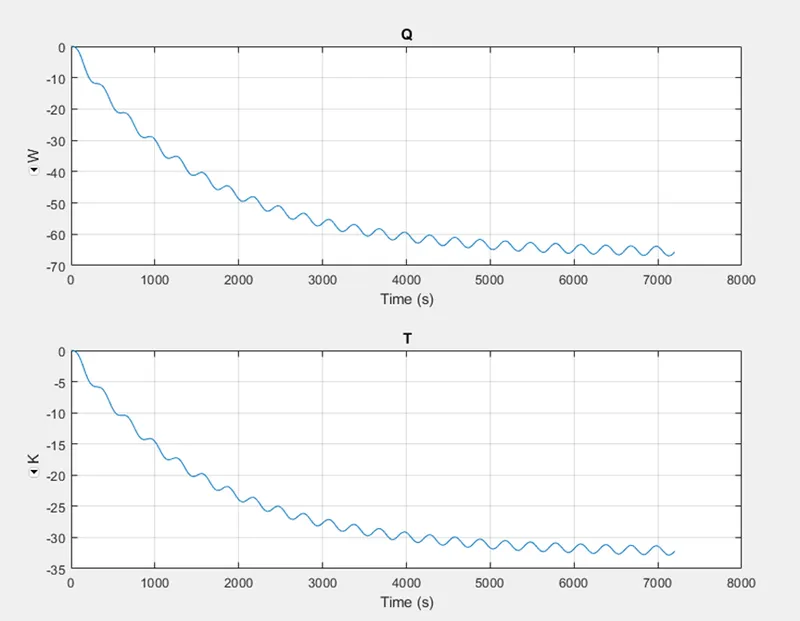
- Here temperature difference peaks between 30-32 K.
- Heat transfer shows somewhat exponential characteristics.
(b)Ambient to Cell 5:
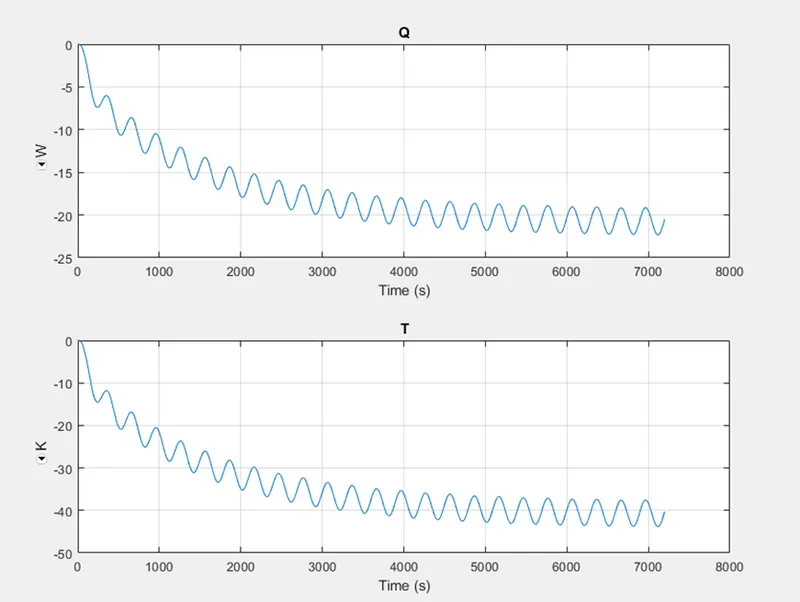
- The temperature difference increases over time . By the end of simulation the final difference becomes around 42 K.
(c)Ambient to Cell 6 to 10:
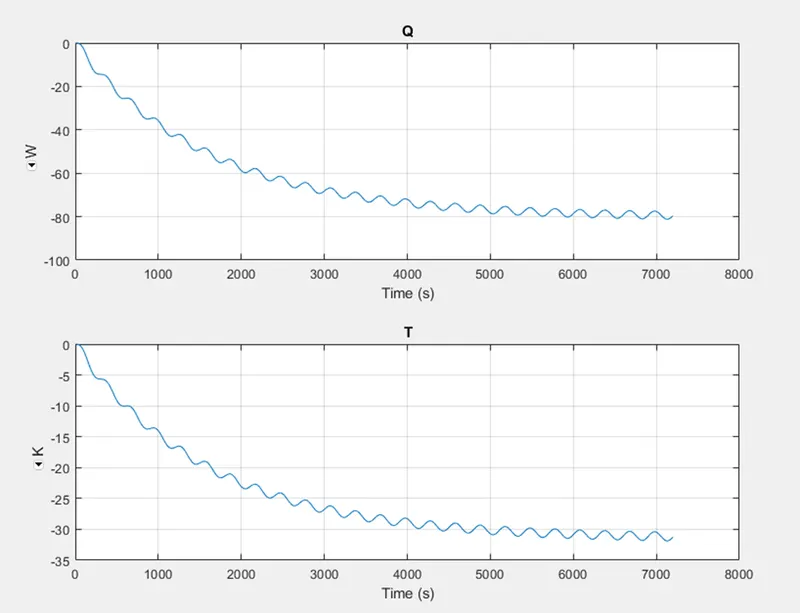
- The temperature difference seen here is in the thirties at the end of simulation.
3. Test 3 – Discharge with Drive cycle:
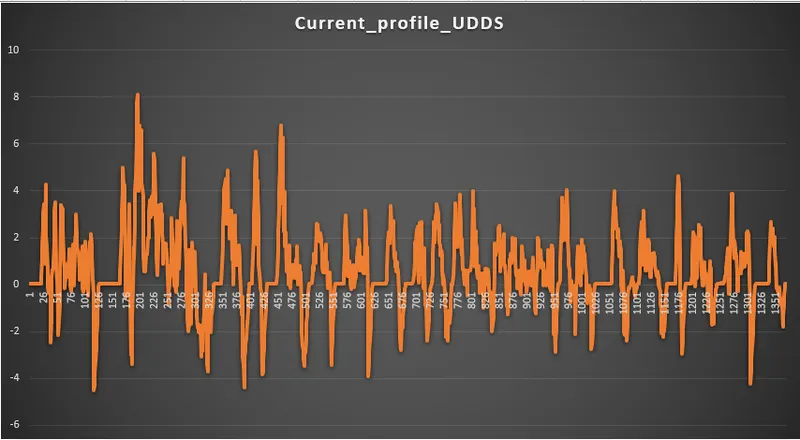
To test with a drive cycle input few modifications is made to the model. The cyclic charge discharge profile is replaced with a controlled current source configured to discharge the battery pack. The UDDS drive cycle (current profile) is inputted to the controlled current source block by using from spreadsheet block and Simulink to Ps converter. The block diagram of the model now looks like following-
The UDDS drive cycle is 1370 seconds long , so simulation time is adjust to 1370 seconds.
In the SOC calculation subsystem, the gain value is changed to 1/1000 for proper SOC estimation.
The model is run at ambient temperature of 298.15 K and all the cells are also kept at default temperatures which is previously defined in the workspace. The model is simulated and output plots are attached below.
- Cell Temperatures:
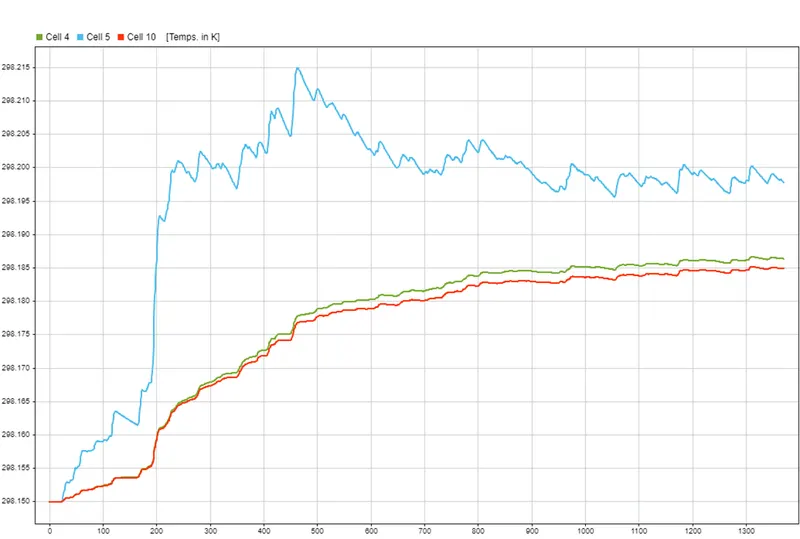
The plot shows the cell temperatures of 4,5 and 10 th cell. They all start from same point. However, cell 5 shows a spikes of increasing temps. The other two cells also sees variation in temperature but it is quite small compared to cell 5.
- SoC:
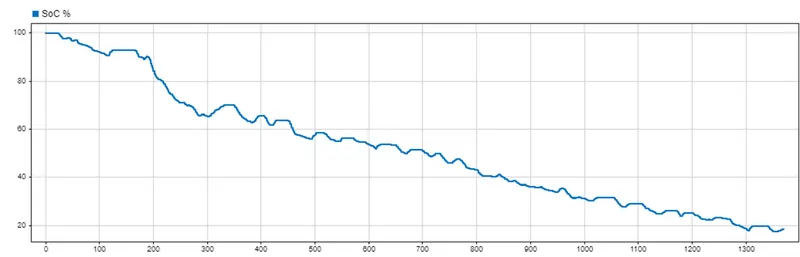
The SOC of the pack decrease as we cover the simulation time. We started with 100 % , and by the end of the simulation only 19% SoC remained.
Conclusion: So the battery pack made of 10 series cell is put to various testing conditions and their temperature behaviors, soc etc. are studied.