Week-3 Challenge: ADVISOR Tool
Week-3 Challenge: ADVISOR Tool
Q1. For EV_defaults_in file, if cargo mass is 500 kg with all other default conditions, can the vehicle travel
for 45 km with FTP drive cycle? Conclude your observations.
Soln:
Advisor tool: The Advisor tool or Advance Vehicle Simulator is developed by NREL & Dept. of energy , USA. It’s a tool for
rapid analysis of the performance and fuel economy of conventional and hybrid vehicles. It’s a popular utility tool. The
vehicle models in the advisor tool are experimental , relying on the drivetrain and the results obtained from the tool are
similar to laboratory experiments.
Now, The advisor tool is loaded into the Matlab and run by typing the command ‘advsior’ in the command window. The tool
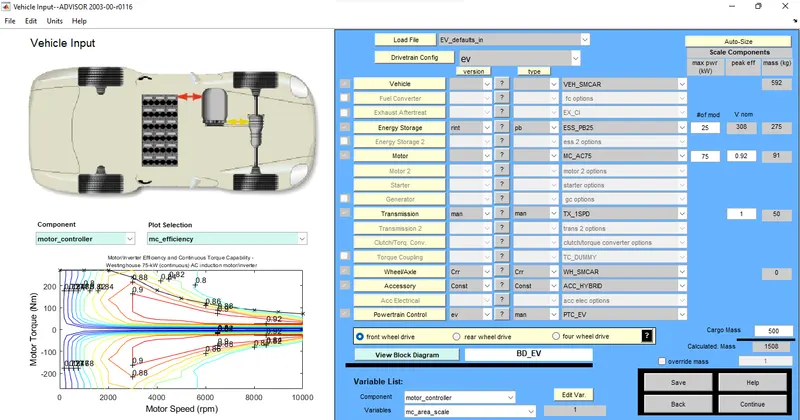
is started with metric units. In the vehicle input window, EV_defaults_in is selected from the drop down menu. The cargo mass
is adjusted 500 kg and continued to the next window.
- In the next window, FTP drive cycle is chosen from the selection menu. This drive cycle is 2477 seconds long with 22 stops and
360 seconds of idle time. The cycle stretches for 17.77 kms with max speed of 91.25 kmph and avg. speed of 25.82 kmph.
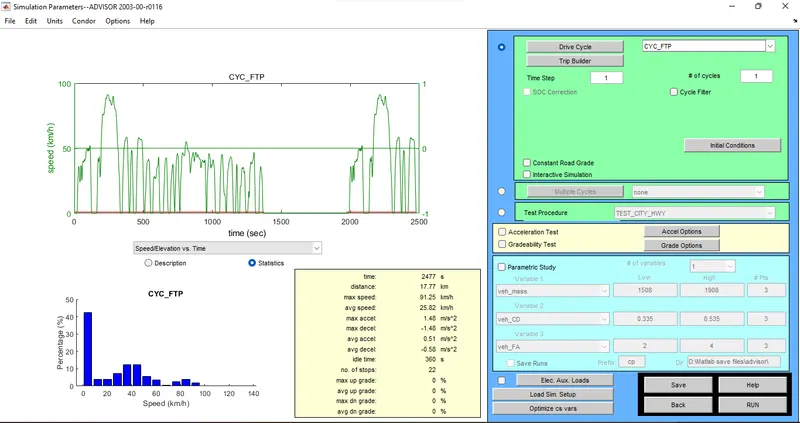
- A single cycle is selected and everything else are kept at their default values. After running the simulation, here are the results.
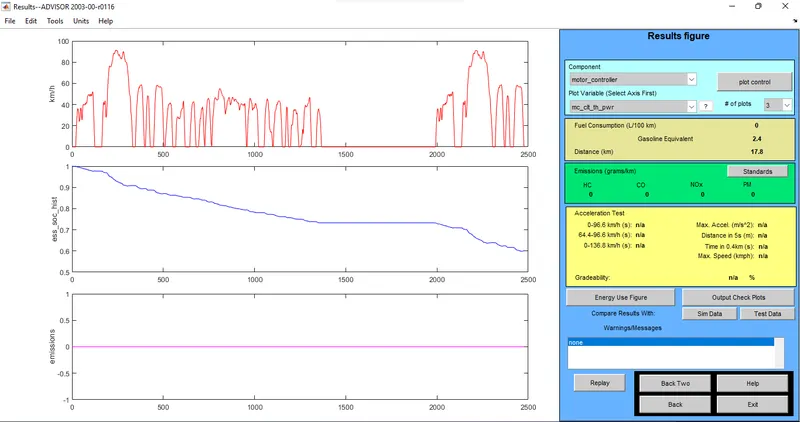
After a single cycle of FTP with cargo mass 500 kg, the vehicle completes the trip of distance 17.77 km and consumed 40% of charge.
So to reach the goal of 45 km , we run the simulations again for 3 drive cycles of FTP. After the simulation completed, here are the results observed-
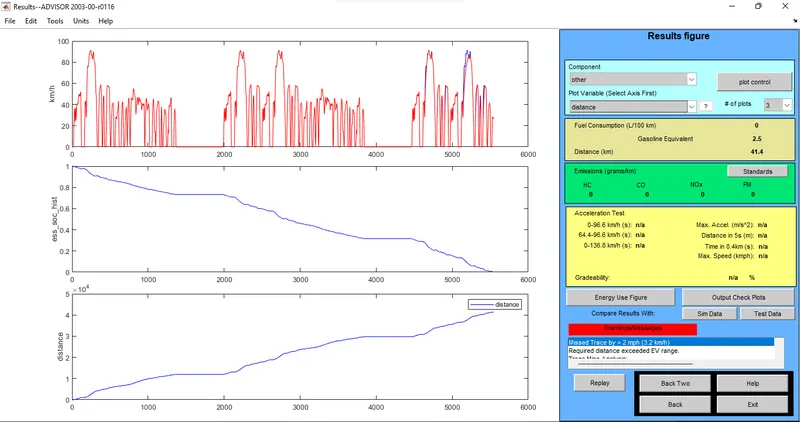
The vehicle successfully completed the first 2 cycles but it ran out charge in the 3rd cycle, completing a total distance of 41.4 km.
Hence , the EV_default cannot travel 45 km in FTP drive cycle with 500 kg cargo mass, in a single charge.
Q2. In the above case, try changing the battery capacity and repeat the simulation.
Soln:
The above model is rerun to achieve the 45 km mark. This time more battery capacity is increased with more modules is added for more energy.
(A) 1st run : In this iteration, the vehicle is give to have 26 battery modules resulting a nominal voltage of 321 Volts. The simulation is run for
3 FTP drive cycles. The results are as follows-

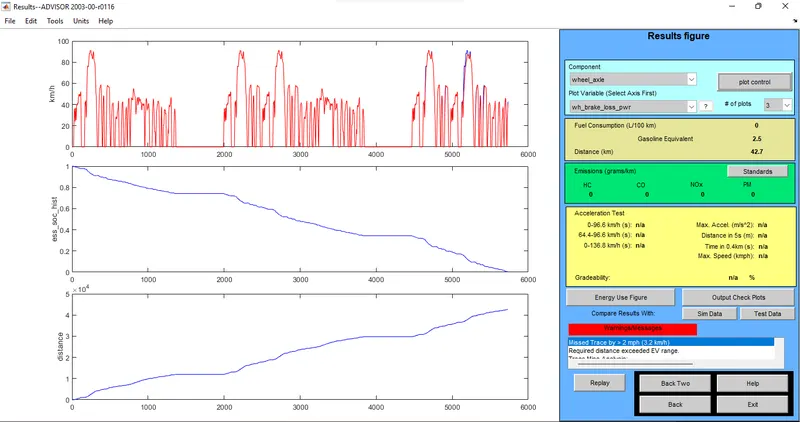
So, with 26 battery the total distance travelled is 42.7 km. The extra battery module added a 1.3 km to the total.
(B) 2nd run: This time simulation is run with an increased capacity of 27 battery modules resulting a nominal voltage of 333 V.
The simulation is run and here are the results-

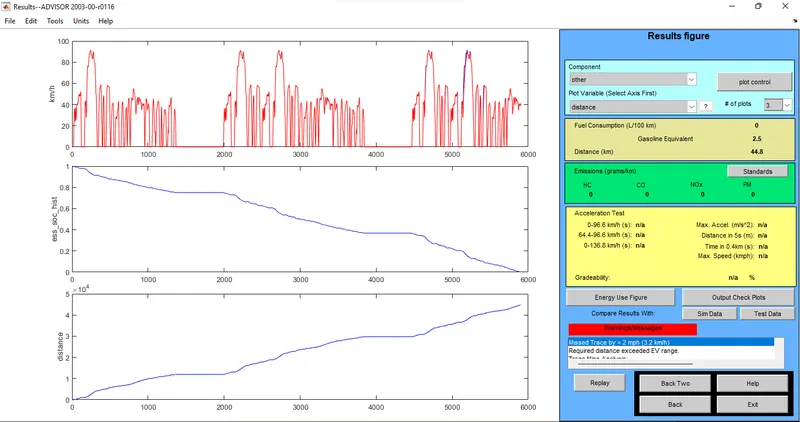
After the simulation completed, the vehicle runs for 44.8 km in around 5900 seconds or 98.33 mins. So, with 27 battery modules
the vehicle just fells short of 45 km .
(C) 3rd run: In this iteration we added another module , making it to a total of 28 battery modules. This gives a total voltage
of 345 V. Now the simulation is run and results are added below.

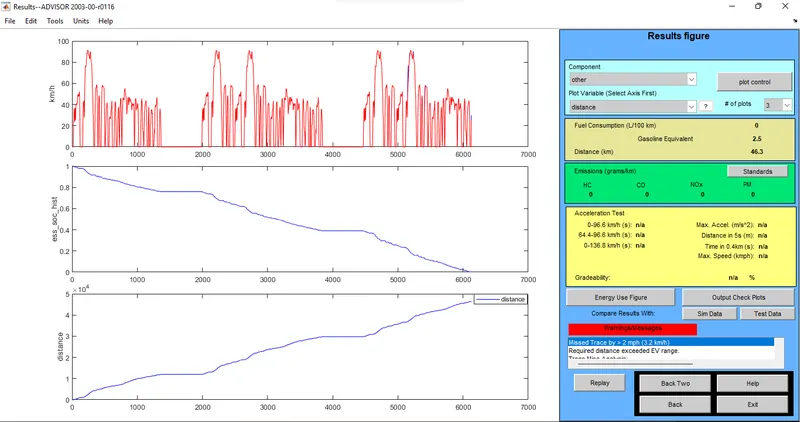
So,with 28 batteries the vehicle has passed the 45 km barrier. The total distance covered in this run is 46.3 km in around 6120 sec or 102 mins.
Hence , to achieve 45 km travel we just need to add 3 more battery modules to the vehicle.
Q3. Perform gradeability test with PRIUS_Jpn_defaults_in file. Compare your results in table and conclude.
Soln:
To perform the gradeability test the vehicle model Prius_Jpn_defaults_in fileis loaded in the advisor tool. The vehicle parameters in the input window
are left at their default values. In the simulation parameters window we selected the FTP drive cycle for a span of 3 cycles and performed the gradeability
test at different speed of the vehicle.
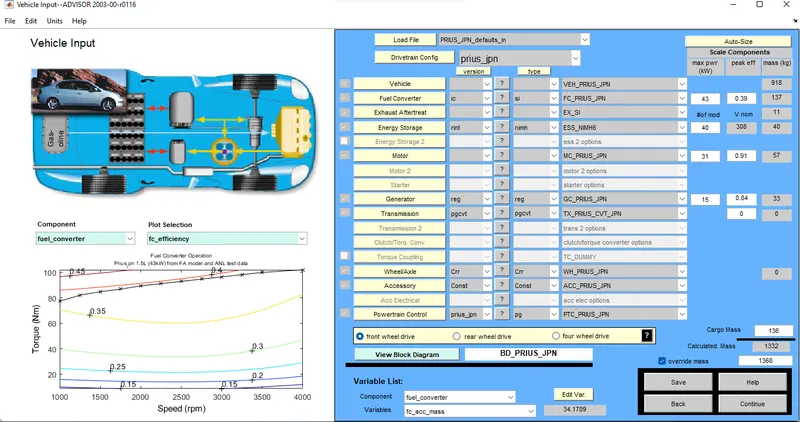
(a) Gradeability Test @ 25 mph or 40.25 kmph: In the simulation parameter window, after selecting the drive cycle ,we enter the grade test menu, where we
set the test speed to be 25 mph (40.25 kmph) and checked all systems enabled. Then Simulation is conducted.
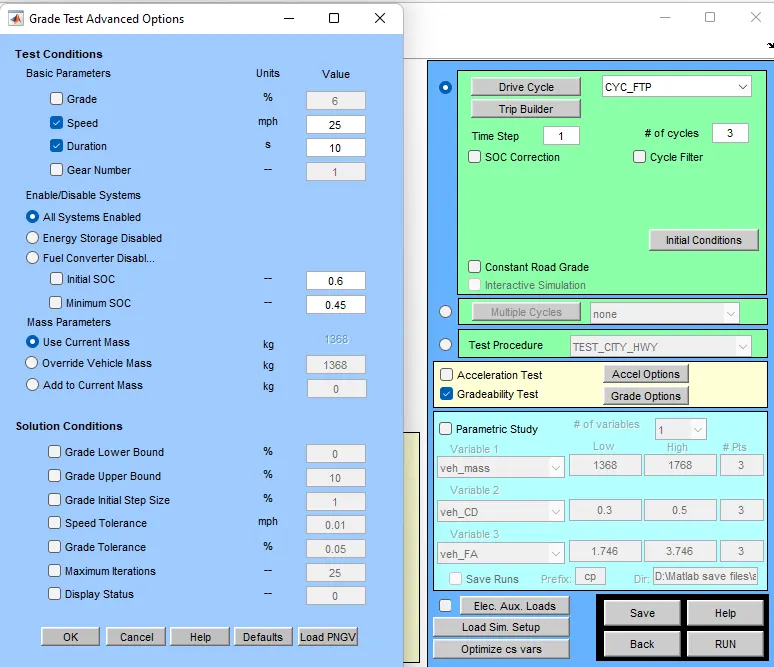
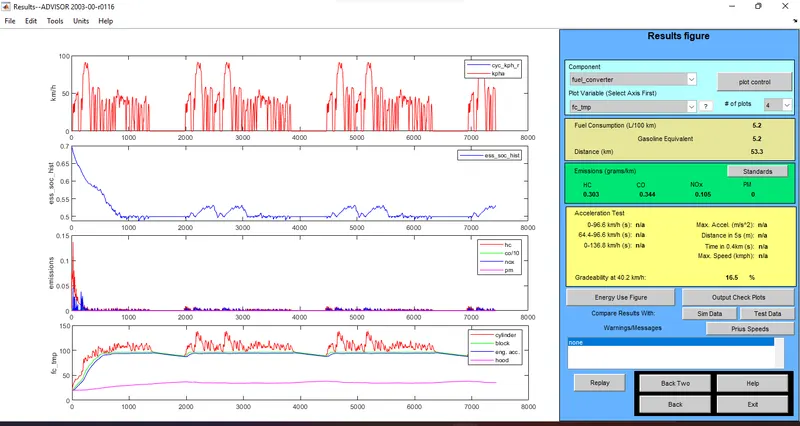
So, from the gradeability at 25 mph or 40.25 kmph is 16.5%.
(B) Gradeability Test @ 30 mph or 48.3 kmph : In the gradeability test window the speed is changed to 30 mph or 48.3 kmph and test is conducted.
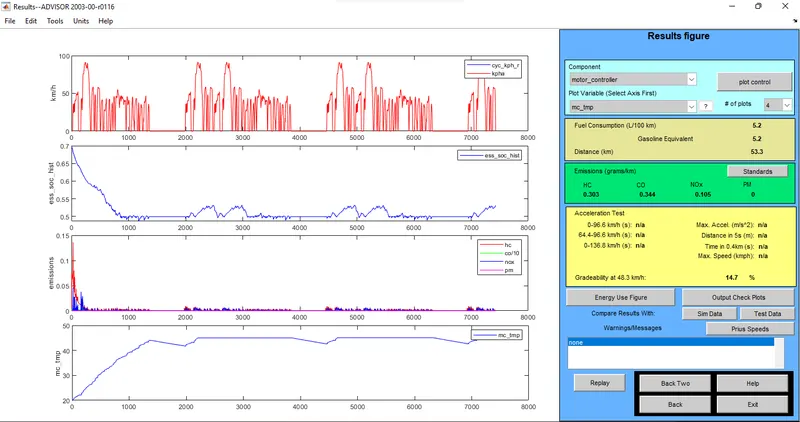
It can be observed that at gradebility at 30 mph is 14.7%. It has decreased from the previous value.
(C) Gradeability Test @ 40 mph or (64.4 kmph) : The test speed is set to 40 mph and simulation is run.
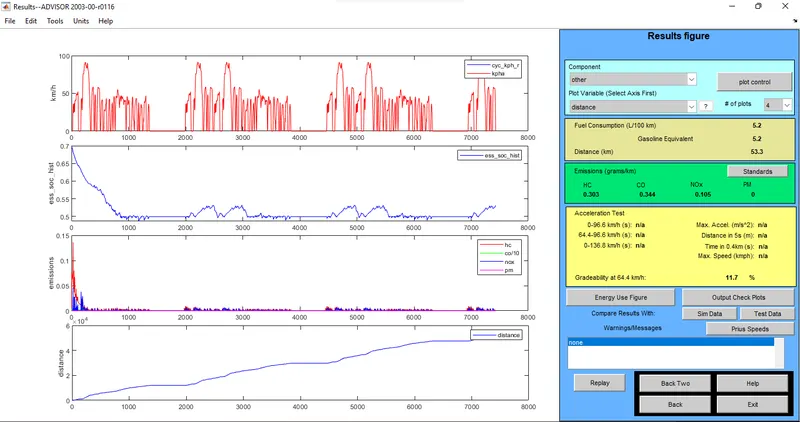
The gradeability at 40 mph or 64.4 kmph is 11.7% .
(D) Gradeability Test @ 45 mph or (72.4 kmph) : The test speed for the Prius is set to a new value of 45 mph or 72.4 kmph and simulation is conducted.
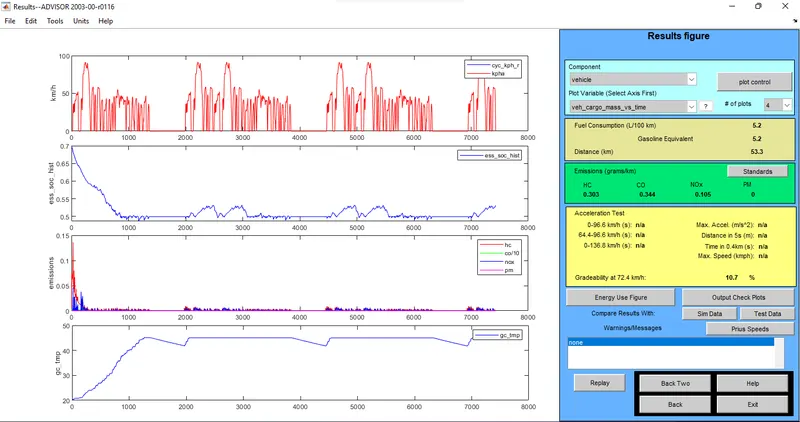
Hence, gradeability at 45 mph or 72.4 kmph is 10.7%.
(E) Gradeability Test @ 50 mph or (80.5 kmph) : A new speed value of 50 mph (80.5 kmph) is set for the test and it is simulated . Heres the result--
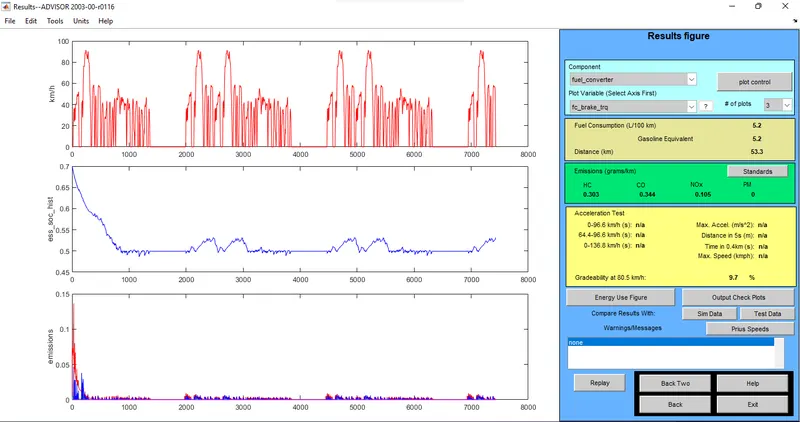
The gradeability at 50 mph or 80.5 kmph is 9.7%.
(F) Gradeability Test @ 55 mph or (88.5 kmph) : The speed is set to 55 mph for the test condition and simulation is run.
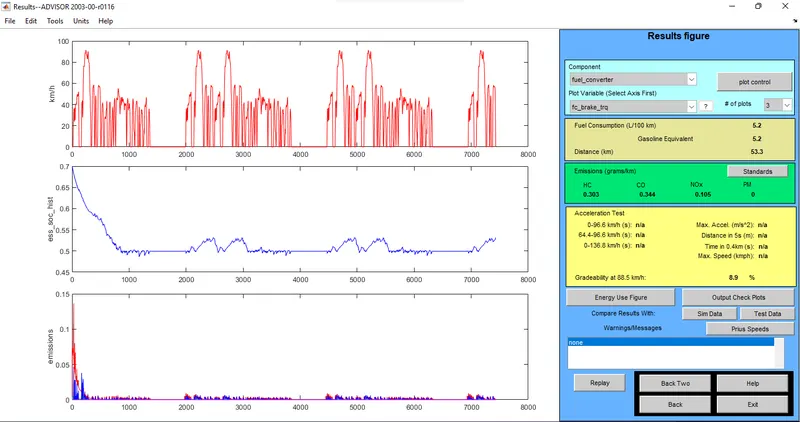
The resulted gradeability at 55 mph or 88.5 kmph is 8.9%.
Therefore, we have conducted the gradeability test at 6 different speed condition and observed a decreasing trend in gradeability %. Below is a table attached.
| Sl No. | Speed (mph) | Speed(kmph) | Gradeability (%) |
| 1 | 25 | 40.25 | 16.5 |
| 2 | 30 | 48.3 | 14.7 |
| 3 | 40 | 64.4 | 11.7 |
| 4 | 45 | 72.4 | 10.7 |
| 5 | 50 | 80.5 | 9.7 |
| 6 | 55 | 88.5 | 8.7 |
Hence, Gradeablity decreases with increase in vehivle speed.