Week-4 Challenge WOT Condition Part-2
Week 4 Challenge WOT Condition -2
1.What is the difference between mapped and dynamic model of engine, motor and generator? How can you change model type?
Soln:
In Powertrain blockset applications there exist two models for engine , motor and generator ; they are Mapped and Dynamic Model.
The differences between the two are sired below-
|
Mapped Model |
Dynamic Model |
|
In mapped model the input-output values are predefined in using lookup tables. |
In dynamic model , the outputs from individual components are combined to generate the block output. |
|
Mapped model produces output from lookup tables and does not use real time factors. |
In dynamic model output is generated in real-time depending on the inputs to various components and subsystems. |
|
The accuracy is comparatively less in mapped models. |
Accuracy in dynamic model is very high as it considers real-time data. |
|
Simulation time is less. |
Simulation time is more as more calculation is needed to be done . |
To change model type from mapped to dynamic there are two ways. Now the process of changing the model type is same for engine,
generator and motor. Here only motor is demonstrated.
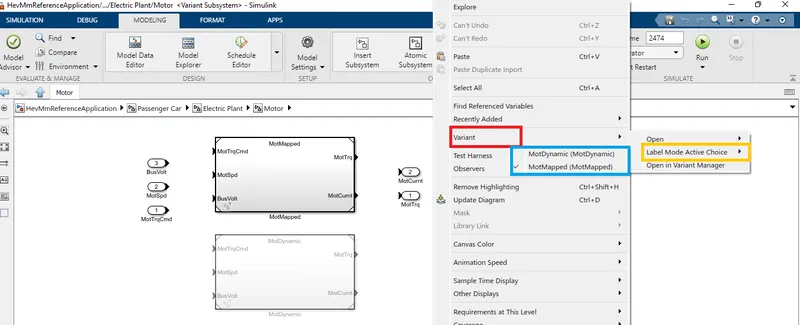
(i) Method 1: First we load the model into Simulink.
- Go to Passenger car block and find the Electric plant.
- Inside the Electric plant, select the Motmapped block and go inside.
- After getting inside path will look like HevMmReferenceApplication/Passenger Car/Electric Plant/Motor.
- Now right click in the screen and select variant from the context menu.
- Select Label Mode Active Choice and click on the MotDynamic to select the Dynamic model for motor.
(ii) Method 2: Load the model into Simulink.
- Open model explorer
- Navigate through Passenger Car/Electric Plant/Motor.
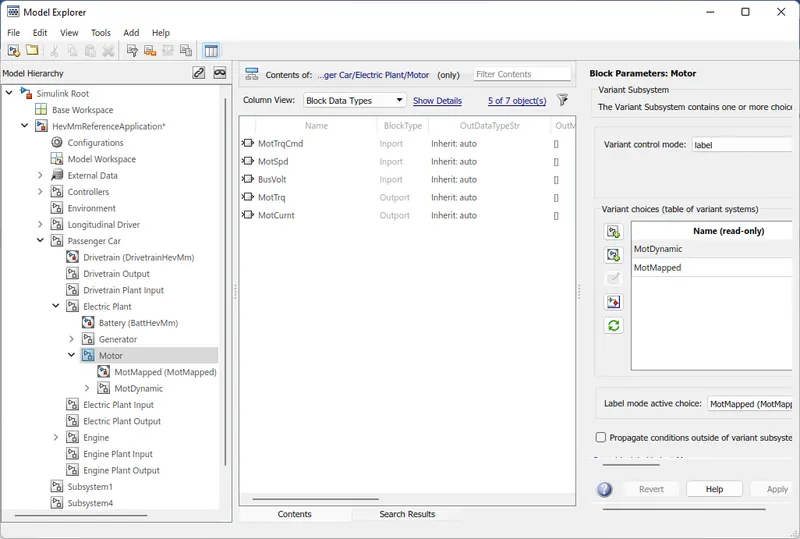
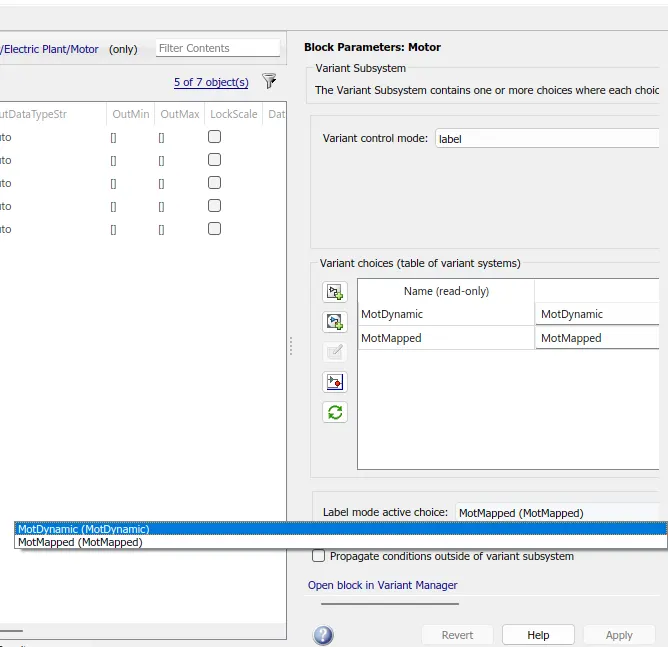
- Click on the ‘Label mode active choice’ ; select ‘MotDynamic’ and hit Apply to save the selection.
2.How does the model calculate miles per gallon? Which factors are considered to model fuel flow?
Soln:
Miles per gallon: MPG or miles per gallon is the distance in miles that the vehicle can travel in per gallon of fuel. Its a primary
measurement of fuel efficiency. Higher the mpg, higher the fuel economy of the vehicle. The term Gallon can be confusing for sometimes
as it has two different versions : US and UK(imperical).
1 gallon in US = 3.785 litre
1 gallon in UK = 4.546 litre
In the powertrain model, the MPG value calculated in US terms. Following is block diagram of how it is calculated – [note:EV reference model is considered]
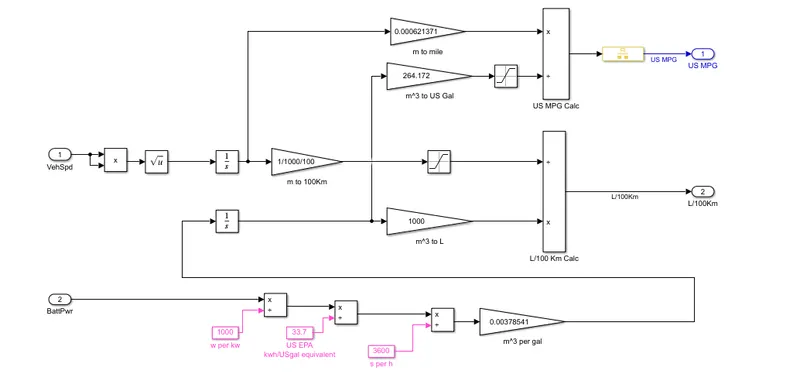
- For EV’s 7 KWh energy is considered for 1 Gallon (US) equivalent fuel. Hence, the battery power is converted to gallons and is fed to MPG calculator block.
For HEV models, both the fuel and battery power is converted into gallons .
- The velocity of the vehicle is squared and then taken square root. Then its integrated to get distance in meters (m). The distance is then converted to miles
and then divided by gallon amount of fuel to get the MPG(US) value.
Factors to be considered to model fuel flow --
- Driving condition -- quick accelaration, sudden stops, driving inconsistancy.
- Weight of the vehicle -- the more the vehicle weight the more the fuel consumption.
- Weather condition -- Winter condition demands more fuel.
3. Run the HEV ReferenceApplication with WOT drive cycle. Change the grade and wind velocity in the environment block.
Comment on the results.
Soln:
Using the help files in Matlab documentation , the HEV Multimode Referrence model is opened from the button . The same can also be done
by typing command ‘autoblkHevStart’ in matlab window.
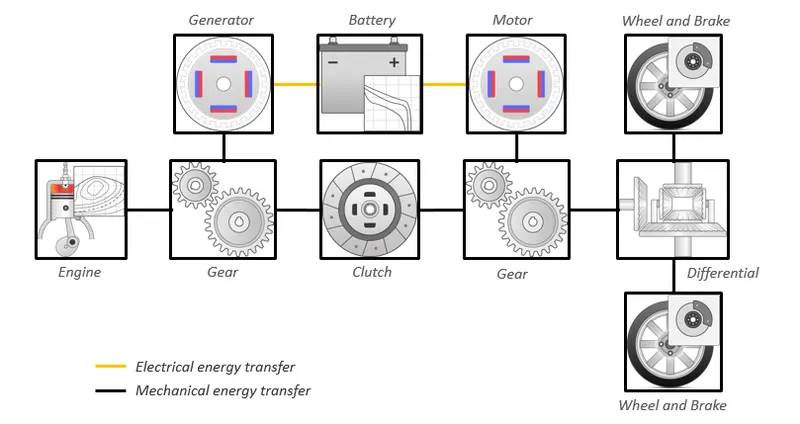
By default, the HEV multimode reference application is configured with:
- Mapped motor and generator
- 5–L spark-ignition (SI) dynamic engine
This diagram shows the powertrain configuration.
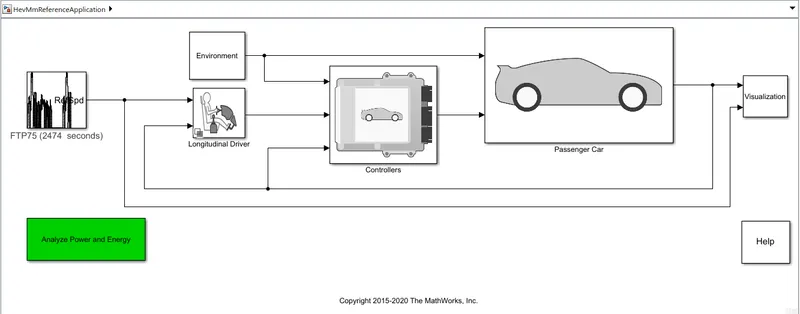
The block diagram of the HEV model is shown below-
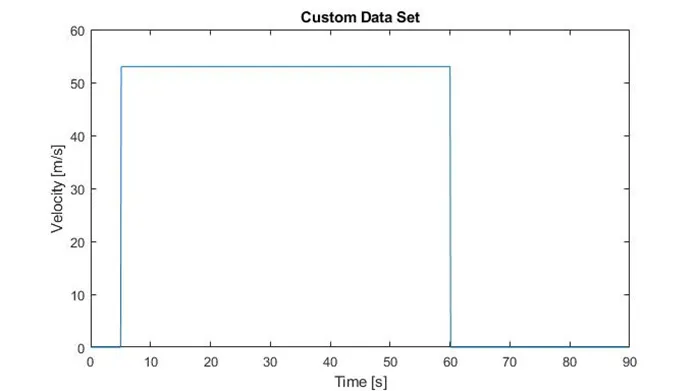
At the beginning, the model is run at WOT drive cycle attempting to achieve 120 mph or 53 m/s speed at default condition i.e. 0% grade, no wind.
The drive cycle has a length of 90 sec. Full Throttle is given at 5 sec and removed after 60 sec.
After simulating the model, here are the results found-
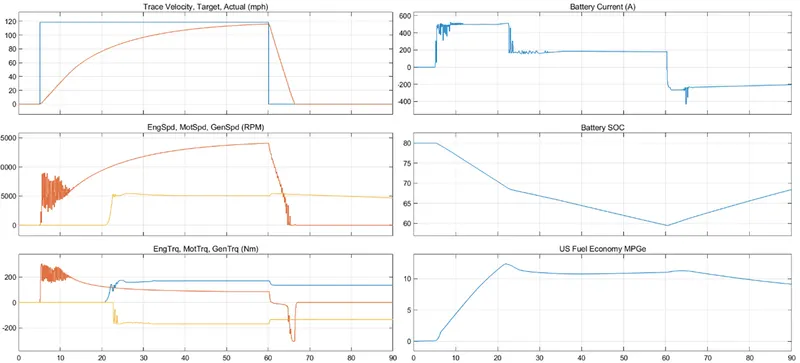
- Although we attempted to reach 120 mph, but it is not achieved. A top speed of 116.138 mph is reached at the end of 60 seconds. The simulation
was started 80% SOC in the battery, after 60 seconds it depleted to 59.51%. So, 20.49% battery is consumed during acceleration.When the throttle
is removed the motor goes into regenerative mode, 8.95% SOC is gained by the battery reaching the final value of 68.46% at the end of the simulation.
- After removing the throttle the car decelerated to 0 mph at 66.5 secs. It only took 6.5 sec to come to halt.
- Here we can see that after the throttle is given, the car required a huge amount of current 523.7 A to start and pick up the speed. As the car passes through
the 80 mph speed, the current demand decreases to lower value of 185 A and stays in the likes of 184 A during the rest of the throttling time. After throttle
is removed, we see a negative values of current and the battery gets charged.
- While the car accelerates we get a maximum MPG of 12.36 . As we get through the top speed and throttle is removed, MPG decreases to a final value of 9.10.
Now, these ideal environment conditions are not found in the real world. We added a 5% grade and a typical wind velocity of 18 kmph or 5 m/s to the environment
block and re-run the above test again.
After the simulation is completed with new conditions, here are the results achieved—
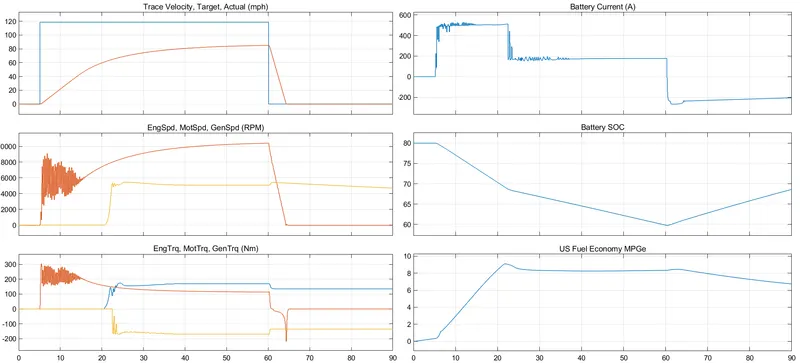
- With new conditions, it is hard to reach the desired speed in time. It is observed that , after 60 seconds we achieved a speed of 85.1 mph.
The added grade and wind velocity, we lost around 31 mph.
- When decelerating the car reached 0 mph at 64.3 secs, meaning it took 4.3 seconds to come to halt, which is 2.2 sec faster than the previous run.
- The battery SOC depleted from 80% to 59.74% in the first 60 seconds. However, during braking it did got charged by 8.86%, reaching a final value of 68.6% SOC.
- In both cases, Battery SOC are at nearly same level at the end of 90 seconds.
- This time the SI engine and motor has to overcome an increased amount of tractive force, so we lose a significant amount of performance as compared to previous run.
- The fuel economy also degraded. The maximum MPG (US) recorded is 9.097 , whereas the minimum is 6.74.
So, its clear that with different environment the performance and economy of the vehicle varies. Gradeability, wind speed, air temperature and pressure effects the vehicle a lot.
This things are to be given importance while designing.
4.Keeping all other parameters same, compare the simulated results of hybrid and pure electric powertrains.
Soln:
The EV reference model is loaded into Matlab from the examples tab. The same can be achieved by typing the command ’autoblkEvStart’ in the
command window without having to find the model from examples.
The electric vehicle reference application is configured with a mapped motor and battery. This diagram shows the powertrain configuration.
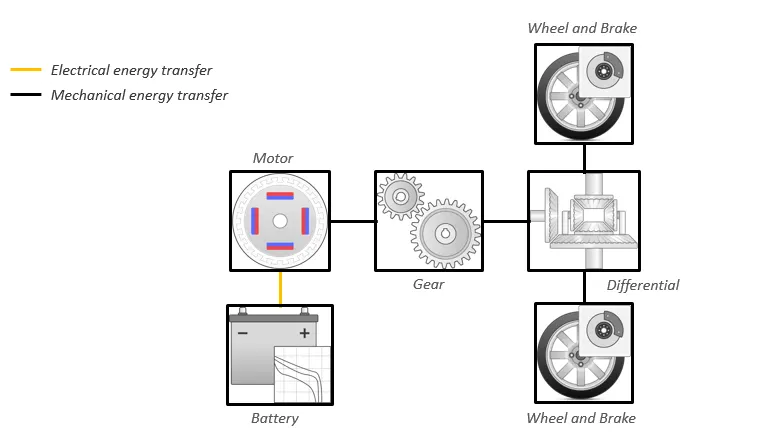
The Simulink model block diagram is given below-
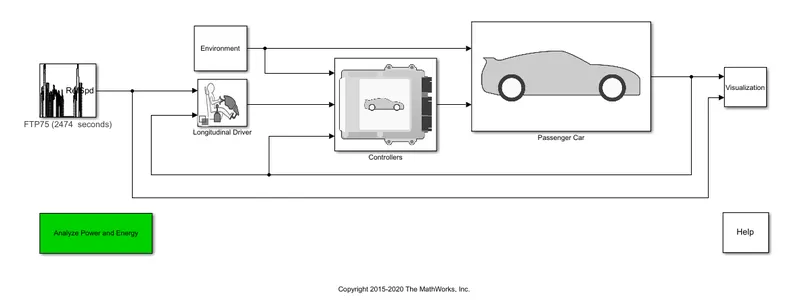
After the model is loaded in Simulink, the drive cycle and environment conditions are entered as per the previous test discussed in the above question.
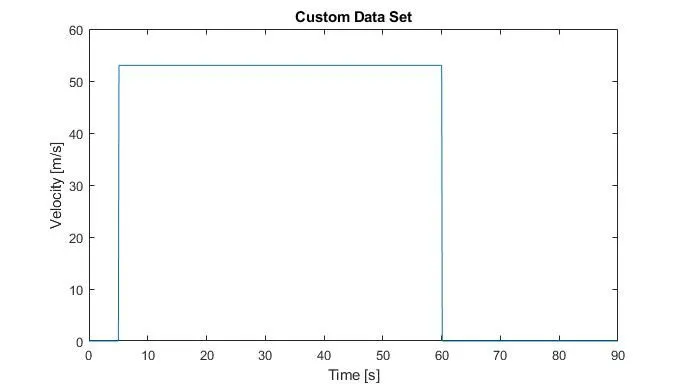
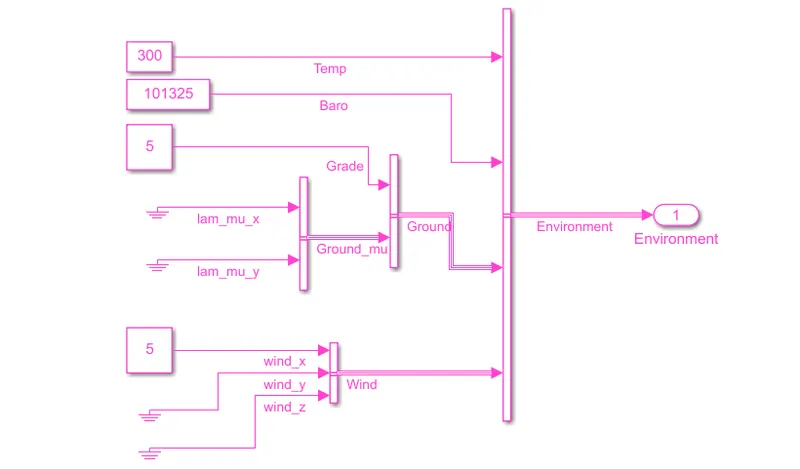
The simulation time is adjusted and model is run. The results are fetched from the visualization block and attached below.
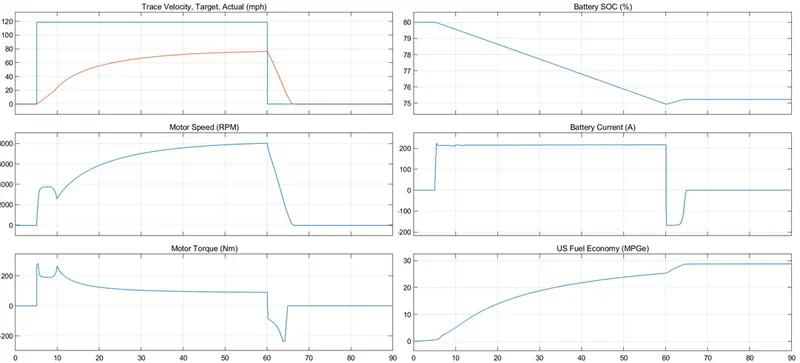
- It is observed that after 60 seconds, upon giving full throttle the car only able to achieve a top speed of 76.26 mph. Which is quite low from the target speed
of 120 mph. And it is 8.84 mph slower than the HEV counter part.
- On removal of throttle the car touches 0 speed at 66.3 sec . It takes 6.3 sec to come to a halt.
- The battery current used in the starting is 225 A, and hovers in the range of 210 - 215 A as we pick up acceleration. As we cross 40 mph, the current steadily
rises to 217.37 A at 60 second mark.
- Upon removal of throttle , we see current goes negative as motor works in regenerative region.
- The peak motor speed achieved is 8038 rpm.
- The test started with 80% Battery SOC. As the test progresses battery gets depleted. At 60 second mark, we are left with 74.94 % battery, meaning that
during the acceleration period only 5.06 % battery is consumed.
- When the throttle is removed car goes into regenerative mode and we gain some charge to reach a final value of 75.23 % SOC.
- At starting the torque required is 280 NM. As the car accelerated the torque steadily decreases to 90 NM at the end of 60 sec. After the removal of throttle
we observe negative values of torque peaking at -236 NM. When the car comes to hold the torque also becomes zero.
- Talking about fuel economy, during 0-60 seconds a steady rise in MPG curve is observed reaching to a final value of 25.3 . In the next 30 seconds, the MPG
value rises again and peaks at 28.72 MPG.
So, the Pure EV is outperformed by its HEV counterpart in terms of speed. If we get higher battery current, we can get more torque during the starting, eventually getting
more speed at the test. Although we lose some speed but the battery consumption is way lesser than the HEV model. The fuel econmoy on EV is very impressive and will cut
transportation cost by a big margin. Overall performance is ok, but can be improved by using other battery of high current capacity.