Week - 4
Answer to the Q.no-1:
Aim : To implement control logic of a Washing Machine with Stateflow.
Given conditions-
- If the power supply available, system gets activated
- When water supply is not available , the process stops and indicates with an LED
- Soaking time is 200 seconds followed by washing time of 100 seconds.
- Then rinsing happens for next 20 seconds and dryer runs for 50 seconds.
- On completion of all process an LED turns on.
Model:
To design the model we will be using Simulink and Stateflow . In Stateflow the control logic will be formulated.
- At first , one constant block is taken to give Power Supply and is connected with a toggle switch to change ON and OFF state. A lamp block is connected to indicate the states and configured as green being the ON state and Red being OFF state.
- Similar setup is done for Water supply also.
- In the next step, the logic is formulated in a Stateflow Chart.
- In the chart, at the beginning state the power supply is checked. If the power supply is found, system gets activated and moves to the next step , otherwise Stops.
- In the next state the water supply is checked. When water supply is not available the system stops and indicates with an LED lamp.
- When the water supply is found, the system moves to the next state of Soaking for 200 seconds.
- Then Washing happens for 100 seconds and proceeds to Rinsing state. Rinsing time is 20 seconds.
- After Rinsing, Dryer runs for 50 seconds completing the entire process.
- LED’s are connected to show the completion of the process.
Thus, the model is ready for simulation.
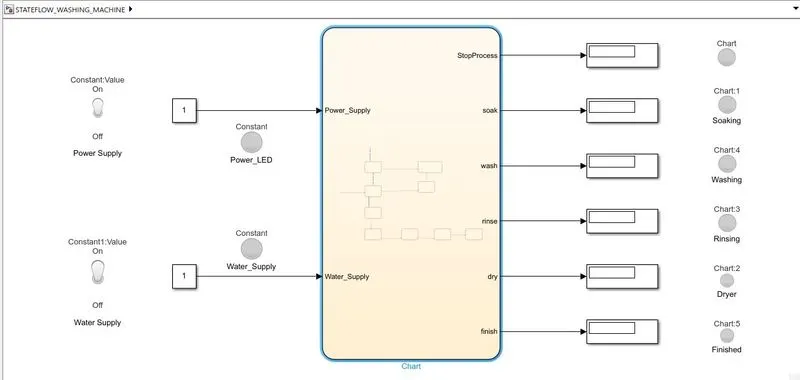
Fig. Block Diagram of Washing Machine Model
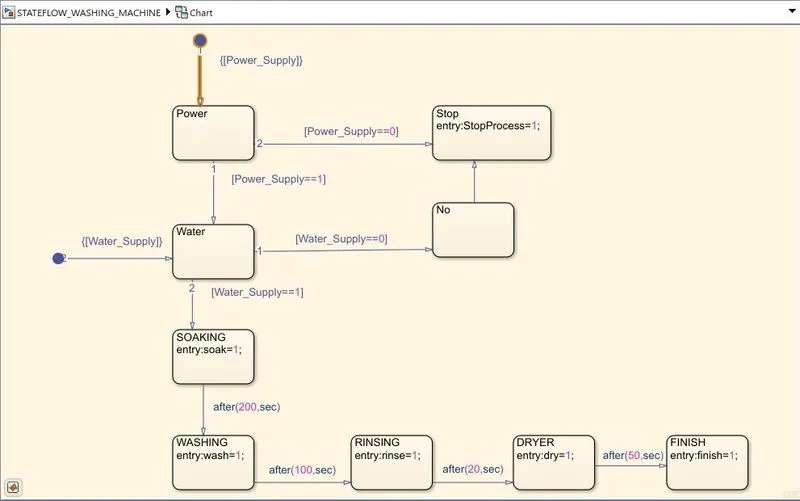
Fig. Stateflow Logic (Flowchart)
Results:
The wash process requires about 370 seconds. The model is simulated for 400 seconds because it takes few seconds to check for the supplies (power & water).
The results of the simulations are as follows-
- Both Power Supply and Water Supply ON —
In this case where both power and water supply available, we see that the washing machine is running and cleaning process is executed. After finishing the process the LED is lit green indicating that it has successfully completed the job. (in the fig. green led= On; red led= Off.)
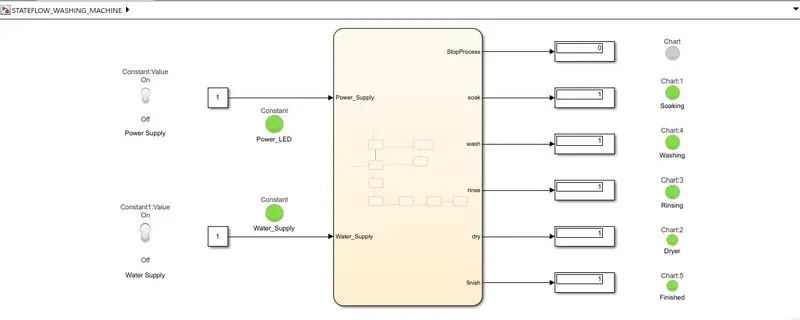
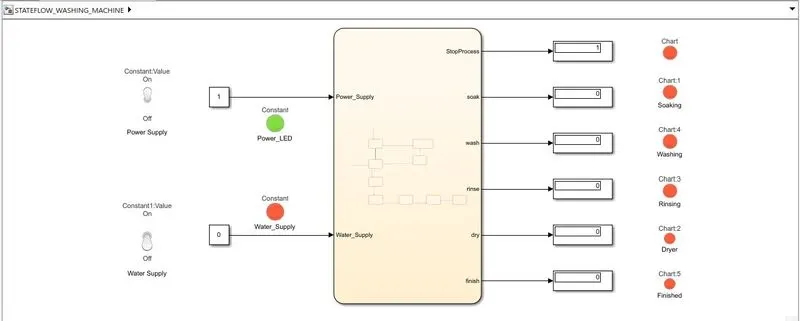
- With Power Supply ON and Water Supply OFF —
In this case the power supply is available but water supply is not, as a result the system will stop and wont proceed to the following states of washing the clothes. The following figure shows exactly the same scenario. Red led at the top right half indicates the stoppage of process.
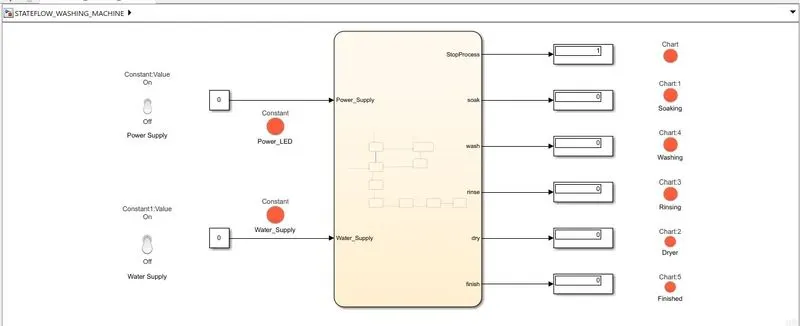
- Both Power Supply and Water Supply OFF—
In this case, when the model is run with both power and water supply off, the system stops and doesn't work.
Answer to the Q. No-2:
Aim: To make a Simulink chart for Gear Shift logic .
Given conditions-
| Speed (kmph) | Gear |
| 0-15 | 1 |
| 16-25 | 2 |
| 26-40 | 3 |
| 41-60 | 4 |
| Above 61 | 5 |
Model :
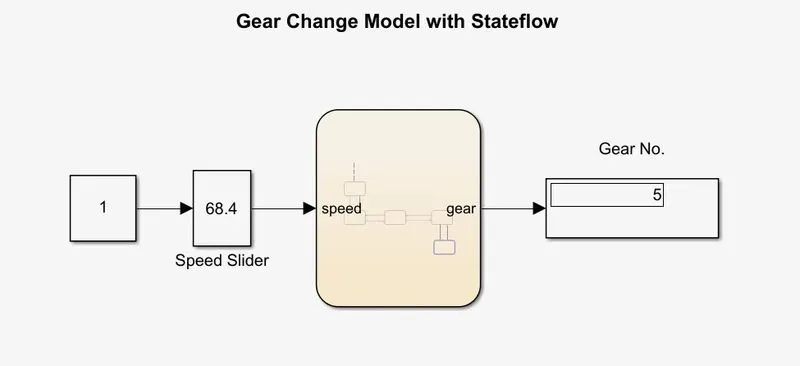
- At first, to give the speed input a slider gain block is used along with a constant.
- The gear shift logic is built in the stateflow chart.
- The input speed in connected to the chart and to view the output a display block is connected on the other end .
- In the chart, when the speed is fed, the first state will show ‘gear 1’. As the speed increases it above 16 , the system will move to the next step and display ‘gear 2’ in the output display.
- If speed decreases below 15 on the next moment, system will come back at the 1st state and show ‘Gear 1’ in the display.
- When the speed exceeds 26 , system moves to 3rd state and will show Gear 3 in the output. But if the speed drops below 25 on the next moment, it will move to the previous state and display 2nd gear in the output.
- Similarly the speed ranges for the 4th and 5th gear is configured in the flowchart as shown below.
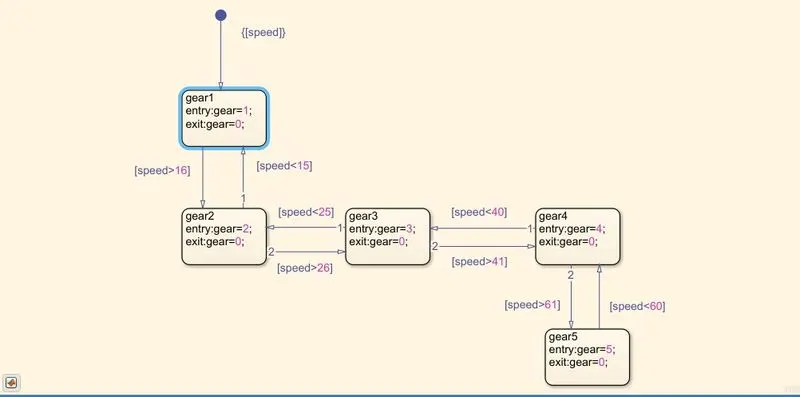
Fig. Flowchart of gear-shift logic.
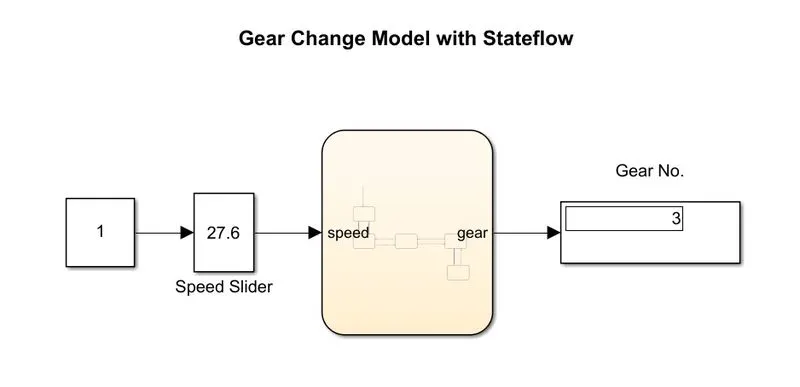
With the output display connected to chart , the model is ready for simulation.
Results:
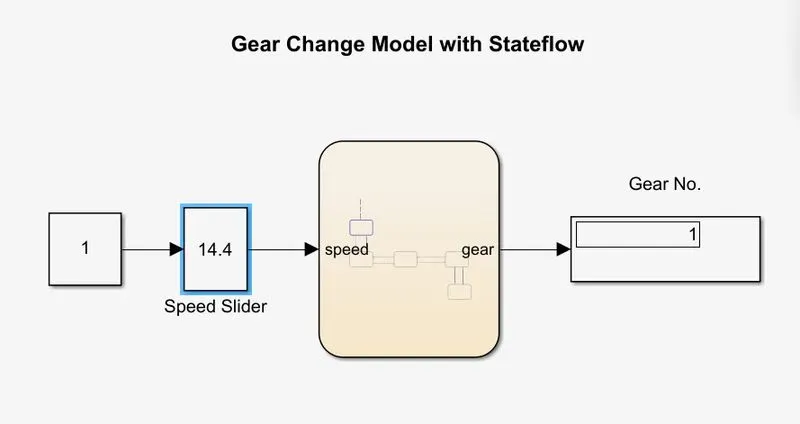
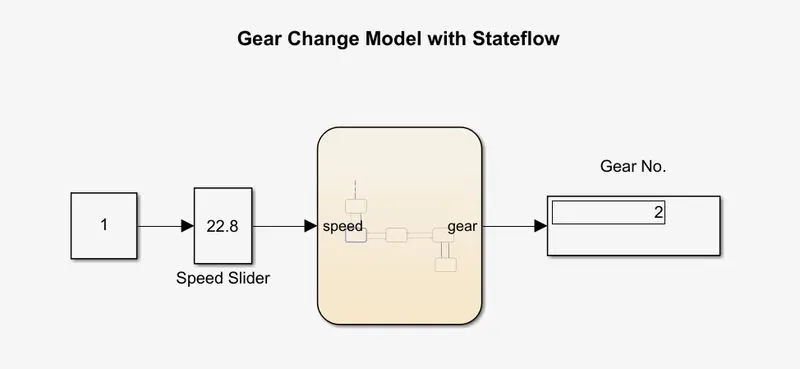
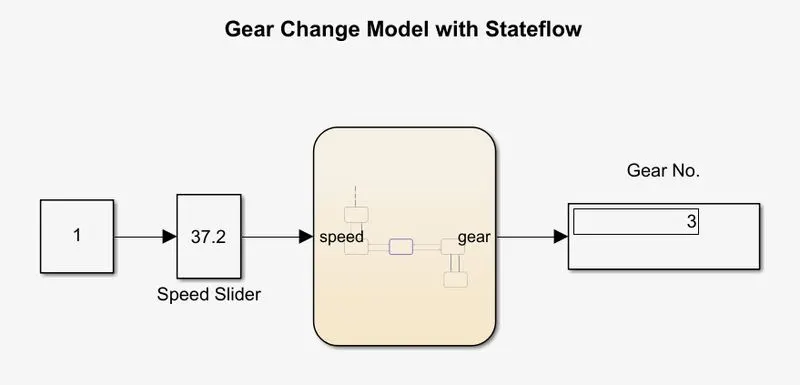
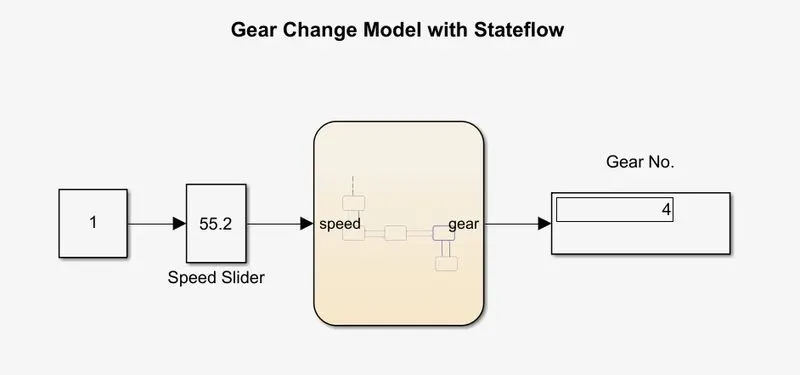
The model is run with infinite simulation time so that input can be provided during simulation. The speed slider is configured to have values between 0 to 120 km. After hitting the Run button, the slider is moved to various position and results are observed. The output display signal was logged and the plot is fetched from 'data inpector'.
- Gear 1
- Gear 2
- Gear 3
- Gear 4
- Gear 5
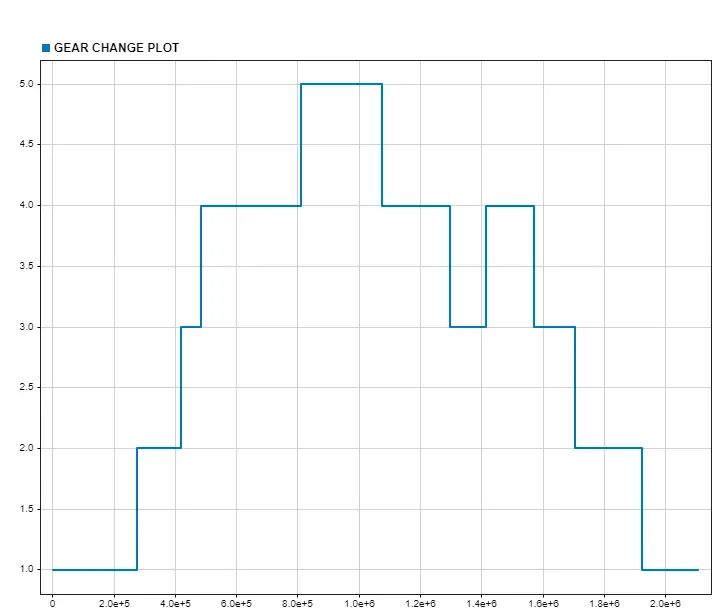
- Plot: Gear Vs Time
In X-axis= Time
In Y-axis=Gear