Project-1: Powertrain for aircraft in runways
- Search and list out the total weight of various types of aircrafts.
Type MTOW [kg] MLW [tonnes] TOR [m] LR [m] ICAO category FAA category Antonov An-225 640,000 591.7 3500 Heavy Super Scaled Composites Model 351 Stratolaunch 589,670 3660 Heavy Super Airbus A380-800[1][2][3] 575,000 394 3100 1930 Super Super Boeing 747-8F 447,700 346.091 3100 1800 Heavy Heavy Boeing 747-8 443,613 306.175 3100 Heavy Heavy Boeing 747-400ER 412,770 295.742 3090 Heavy Heavy Antonov An-124-100M 405,060 330 2520 900 Heavy Heavy Boeing 747-400 396,900 295.742 3018 2179 Heavy Heavy Lockheed C-5 Galaxy[4][5][6] 381,000 288.417 2530 1494 Heavy Heavy Boeing 747-200[7] 377,840 285.700 3338 2109 Heavy Heavy Boeing 747-300[7] 377,840 260.320 3222 1905 Heavy Heavy Airbus A340-500[8] 371,950 240 3050 2010 Heavy Heavy Airbus A340-600[8] 367,400 256 3100 2100 Heavy Heavy Boeing 777F 347,800 260.816 2830 Heavy Heavy Boeing 777-300ER 351,800 251.29 3100 Heavy Heavy Boeing 777-200LR 347,450 223.168 3000 Heavy Heavy Boeing 747-100[7] 340,200 265.300 Heavy Heavy Airbus A350-1000 308,000 233.5 Heavy Heavy Boeing 777-300 299,370 237.683 3380 Heavy Heavy Boeing 777-200ER 297,550 213.00 3380 1550 Heavy Heavy Airbus A340-300[8][9] 276,700 190 3000 1926 Heavy Heavy McDonnell Douglas MD-11 273,300 185 2990 1890 Heavy Heavy Airbus A350-900 270,000 175 2670 1860 Heavy Heavy Ilyushin Il-96M 270,000 195.04 3115 2118 Heavy Heavy McDonnell Douglas DC-10 256,280 183 2990 1890 Heavy Heavy Boeing 787-9[10] 254,000 192.777 2900 Heavy Heavy Boeing 787-10[10] 254,000 201.849 Heavy Heavy Airbus A340-200[8][11] 253,500 181 2990 Heavy Heavy Ilyushin IL-96-300 250,000 175 2600 1980 Heavy Heavy Airbus A330-300[12][13] 242,000 185 2500 1750 Heavy Heavy Airbus A330-200[12][13] 242,000 180 2220 1750 Heavy Heavy Lockheed L-1011-500 231,300 166.92 2636 Heavy Heavy Boeing 787-8[10] 228,000 172.365 3300 1695 Heavy Heavy Lockheed L-1011-200 211,400 Heavy Heavy Ilyushin IL-86 208,000 175 Heavy Heavy Boeing 767-400ER 204,000 158.758 3414 Heavy Heavy Airbus A300-600R[14] 192,000 140 2385 1555 Heavy Heavy Boeing 767-300ER 187,000 136.08 2713 1676 Heavy Heavy Concorde 185,000 111.1 3440 2220 Heavy Heavy Airbus A300-600[14] 163,000 138 2324 1536 Heavy Heavy Boeing 767-300 159,000 136.078 2713 1676 Heavy Heavy Airbus A310-300[14] 157,000 124 2290 1490 Heavy Heavy Vickers VC10 152,000 151.9 Heavy Heavy Boeing 707-320B[15] 151,000 97.5 Heavy Heavy Boeing 707-320C[15] 151,000 112.1 Heavy Heavy Douglas DC-8-61 147,000 Heavy Heavy Airbus A310-200[14] 142,000 123 1860 1480 Heavy Heavy Airbus A400M 141,000 122 980 770 Heavy Heavy Douglas DC-8-32 140,000 Heavy Heavy Douglas DC-8-51 125,000 Medium Large Boeing 757-300 124,000 101.6 2550 1750 Medium Large Boeing 707-120B[15] 117,000 86.3 Medium Large Boeing 757-200 116,000 89.9 2347 1555 Medium Large Boeing 720B[16] 106,000 79.5 Medium Large Boeing 720[16] 104,000 79.5 Medium Large Tupolev Tu-154M 104,000 80 Medium Large Tupolev Tu-204SM 104,000 87.5 2250 Medium Large Convair 880 87,500 Medium Large Boeing 737-900 85,000 66.36 2500 1704 Medium Large Boeing 737-900ER 85,000 71.35 2804 1829 Medium Large Boeing 727-200 Advanced[17] 84,000 70.1 Medium Large Airbus A321-100[18] 83,000 77.8 2200 1540 Medium Large Boeing 737-800 79,000 65.32 2308 1634 Medium Large Boeing 727-200[17] 78,000 68.1 Medium Large McDonnell-Douglas MD-83 73,000 63.28 Medium Large Boeing 727-100[17] 72,500 62.4 Medium Large Boeing 727-100C[17] 72,500 62.4 Medium Large McDonnell-Douglas MD-90-30 71,000 64.41 2165 1520 Medium Large de Havilland Comet 4 70,700 Medium Large Boeing 737-700 70,000 58.06 1921 1415 Medium Large Airbus A320-100[18] 68,000 66 1955 1490 Medium Large Boeing 737-400 68,000 54.9 2540 1540 Medium Large de Havilland Comet 3 68,000 Medium Large Boeing 377 67,000 Medium Large Boeing 737-600 66,000 54.66 1796 1340 Medium Large Airbus A220-300 65,000 57.61 1890 1494 Medium Large Hawker Siddeley Trident 2E 65,000 Medium Large Airbus A319[18] 64,000 62.5 1850 1470 Medium Large Boeing 737-300 63,000 51.7 1939 1396 Medium Large Boeing 737-500 60,000 49.9 1832 1360 Medium Large Airbus A220-100 59,000 50.80 1463 1356 Medium Large Airbus A318[18] 59,000 57.5 1375 1340 Medium Large Boeing 717-200HGW 55,000 47.174 1950 Medium Large Douglas DC-7 55,000 Medium Large de Havilland Comet 2 54,000 Medium Large Boeing 717-200BGW 50,000 46.265 1950 Medium Large de Havilland Comet 1 50,000 Medium Large Douglas DC-6A 48,600 Medium Large Douglas DC-6B 48,500 Medium Large Embraer 190[19] 48,000 43 2056 1323 Medium Large Caravelle III 46,000 Medium Large Fokker 100 46,000 39.95 1621 1350 Medium Large Douglas DC-6 44,000 Medium Large Avro RJ-85 42,000 36.74 Medium Large Handley Page Hermes 39,000 Medium Large Embraer 175[20] 37,500 32.8 2244 1304 Medium Large Bombardier CRJ900[21] 36,500 33.345 1778 1596 Medium Large Embraer 170[22] 36,000 32.8 1644 1274 Medium Large Bombardier CRJ700 33,000 30.39 1564 1478 Medium Large Douglas DC-4 33,000 Medium Large Vickers Viscount 800 30,400 Medium Large Bombardier Q400 28,000 28.01 1219 1295 Medium Large Bombardier CRJ200 23,000 21.319 1918 1479 Medium Large ATR 72-600 22,800 22.35 1333 914 Medium Large Saab 2000 22,800 21.5 1300 Medium Large Embraer ERJ 145 22,000 19.3 2270 1380 Medium Large ATR 42-500 18,600 18.3 1165 1126 Medium Small Saab 340 13,150 12.930 1300 1030 Medium Small Embraer 120 Brasilia 11,500 11.25 1560 1380 Medium Small BAe Jetstream 41 10,890 10.570 1493 826 Medium Small Learjet 75[23] 9,752 8.709 1353 811 Medium Small Pilatus PC-24[24] 8,300 7.665 893 724 Medium Small Embraer Phenom 300[25] 8,150 7.65 956 677 Medium Small Beechcraft 1900D 7,765 7.605 1036 853 Medium Small Cessna Citation CJ4[26] 7,761 7.103 1039 896 Medium Small de Havilland Hercules 7,000 Medium Small Embraer Phenom 100 4,800 4.43 975 741 Light Small - Is there any difference between ground speed and air speed?
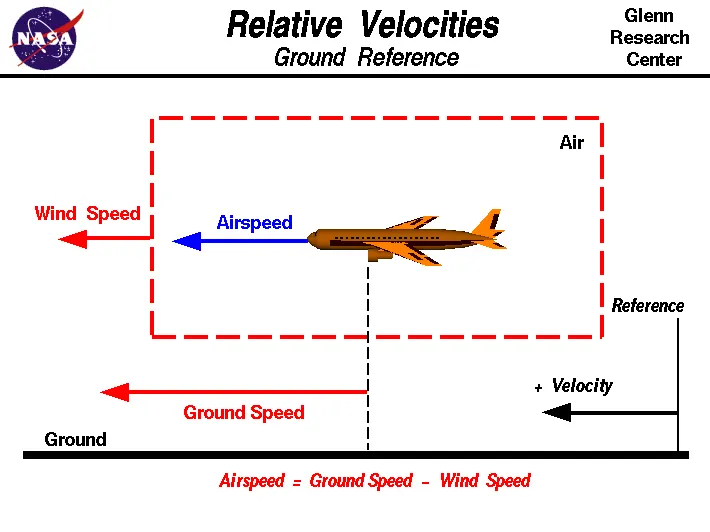
Fig: refernce from https://www.grc.nasa.gov/
Ground Speed
For a reference point picked on the ground, the aircraft moves relative to the reference point at the ground speed. Ground speed is also a vector quantity so a comparison of the ground speed to the wind speed must be done according to rules for vector comparisons.
Airspeed
The important quantity in the generation of lift is the relative velocity between the object and the air, which is called the airspeed. Airspeed cannot be directly measured from a ground position, but must be computed from the ground speed and the wind speed. Airspeed is the vector difference between the ground speed and the wind speed.
Airspeed = Ground Speed - Wind Speed
On a perfectly still day, the airspeed is equal to the ground speed. But if the wind is blowing in the same direction that the aircraft is moving, the airspeed will be less than the ground speed.
Examples
Suppose we had an airplane that could take off on a windless day at 100 mph (liftoff airspeed is 100 mph). We are at an airport with an east-west runway that is 1 mile long. The wind is blowing 20 mph towards the west and the airplane takes off going east. The wind is blowing towards the aircraft which we call a headwind. Since we have defined a positive velocity to be in the direction of the aircraft's motion, a headwind is a negative velocity. While the plane is sitting still on the runway, it has a ground speed of 0 and an airspeed of 20 mph:
Airspeed = Ground Speed (0) - Wind Speed (-20) = 20 mph
The airplane starts its take off roll and has a constant acceleration a. From Newton's second law of motion, the ground speed V at any time t is:
V = a * t
and the distance d down the runway at any time is:
d = 1/2 * a * t^2
For a fixed length runway, this specifies the time to be used in the velocity equation. Let's assume that at 5000 feet down the runway, the velocity is 80 mph. Then the airspeed is given by
Airspeed = Ground Speed (80) - Wind Speed (-20) = 100 mph
and the airplane begins to fly. Now another pilot, with exactly the same airplane decides to take off to the west. The wind is now in the same direction as the motion and this is called a tailwind. The sign on the wind speed is now positive, not negative as with the headwind. The acceleration along the ground is the same, so at 5000 feet down the runway, the ground speed is again 80 mph. The airspeed is then given by:
Airspeed = Ground Speed (80) - Wind Speed (20) = 60 mph
This airplane doesn't have enough airspeed to fly. It runs off the end of the runway!
3.Why is it not recommended to use aircraft engine power to move it on the ground at Airport?
"Taxiing" refers to the aircraft movement while on the ground under its own power. This term excludes the accelerating run before take-off and the decelerating run after landing.
To move an aircraft you need torque, lots of torque. A conventional car (even a Jeep) would be ultra underpowered to deliver so much amount of torque as needed to move a heavy jet. And that job is done by heavy vehicles having a high side wall ratio.
The jet engine used is generally not preferred as the primary thrust for taxiing because a large amount of fuel is wasted while the aircraft is still on the ground which could have been used for flying. Since the cost of fuel is one of the biggest expenses in the airline business, many companies are planning to switch to electric taxiing to save fuel and reduce emissions.There are 2 more important reasons,
i) If the high mounted engines are powered there is a huge risk of the jet blast which may affect the surrounding building and the environment.
ii) In case of low mounted engines are turned on there is a higher possibility of any gravel or other impurities lying in the ground may enter the engine and damage it.
Here is where Pushback trucks &Electric taxiing systems use electric motors fitted inside the wheels of the aircraft’s landing gear. Electric power is supplied to these motors by an on-board Auxiliary Power Unit (APU). This innovative new approach enables airplanes to move backward and forward solely under electric power. This way, aircraft can avoid reliance on main engines for traversing the airport taxiways while burning fuel unnecessarily.
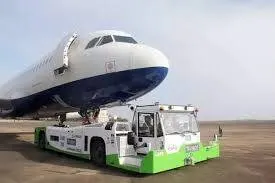
- How an aircraft is pushed to runway when its ready to take off? Taking aircraft till runway is called taxiing of aircraft and for the accelerating run along a runway prior to takeoff, or the
decelerating run immediately after landing, are called the takeoff roll and landing rollout, respectively.
So, taxiing is done by generating thrust to propel the aircraft forward, from its propellers or jet engines. Reverse thrust for
backing up can be generated by thrust reversers or reversible pitch propellers.
After lining up on runway and cleared for take-off, the pilot will start to advance thrust by propelling fans or by operating jet
engines. After spooling of engines it is safe to advance the thrust levers together to the position that will enable the engines to
deliver the amount of thrust required for take-off. The required thrust should be attained before the aeroplane’s indicated air
speed passes 80kts. The specified speed is typically 80 knots. Below this speed the take-off may be rejected for any reason.
Lifting up is done when the wings are lifting the weight of the airplane off the surface. In most airplanes, this is the result of the pilot rotating the nose up to increase the angle of attack (AOA). The nose is raised to a nominal 5°–15° nose up pitch attitude to increase lift from the wings and effect liftoff. For most aircraft, attempting a takeoff without a pitch-up would require cruise speeds while still on the runway.
5.Learn about take off power, tyre design, rolling resistance, tyre pressure, brake forces when landing.
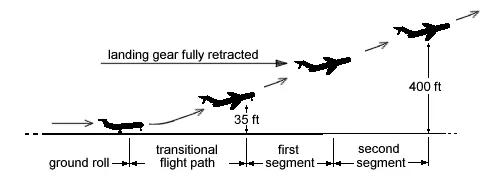
Take off power: Take off is the phase of flight that aircraft leaves the ground and become airborne. The power required to change the phase of aircraft is called take off power.
Stages of Power: During take-off condition the pilots first increase the engine power to 40–60% N1, low-pressure compressor RPM on Boeing
aircraft, and 50% N1 on Airbus aircraft. After setting the engine stability, the pilots then either press the TO/GA switch, causing the thrust levers to automatically advance themselves to the appropriate power setting on Boeings or manually advance the thrust levers to the TO/GA detent on Airbuses and the engine speeds then increase to provide the computed takeoff power. The advantage of having such a system is the ability to reduce wear and tear on the engines by using only as much power as is actually required to ensure the aircraft reaches safe take-off speed.
Tyre Design:
An aircraft tire or tyre is designed to withstand extremely heavy loads for short durations. The number of tires required for aircraft increases with the weight of the aircraft, as the weight of the airplane needs to be distributed more evenly. Aircraft tire tread patterns are designed to facilitate stability in high crosswind conditions, to channel water away to prevent hydroplaning, and for braking effect.
Design and Construction of Aircraft tyre
Carcass plies are used to form the tire. They are sometimes called casing plies. An aircraft tyre is constructed for the purpose it serves.
- They support the weight of an aircraft while it is on the ground.
- It also provides the necessary traction for braking and stopping of an aeroplane.
- Tyre also helps to absorb the shock of landing and provide cushioning the roughness of takeoff, roll-out, and taxi operations.
Unlike an automobile or truck tyre, it does not have to carry a load for a long period of continuous operation. However, an aircraft tyre absorbs the high impact loads of landing, and also it’s operating at high speeds for a short time when required.
Retreading – Retreading is methods of restoring a worn tyre by renewing the tread area or by renewing the tread area plus one or both sidewalls. Repairs are included in the tyre retreading process.
Ply Rating – Ply Rating is used to identify the maximum recommended load rating and inflation pressure for a specified tyre. It is an index of tyre strength.
Speed Rating – The speed rating is the maximum takeoff speed to which the tyre has been tested.
Skid Depth – Skid depth is the distance between the tread surface and the deepest groove as measured in the mould.
Aircraft tyres must have an approved speed and load rating and have sufficient clearance when retracted through landing gear to allow for tyre growth. Tyre growth is the increase in the size of the tyre due to centrifugal forces at high speed.
All commercial aircraft tyres approved under FAA Requirement Technical Standard Order (TSO) C62. A TSO is a minimum performance standard for specified materials, parts, and appliances used on civil aircraft.
Rolling Resistance: Rolling resistance, sometimes called rolling friction or rolling drag, is the force resisting the motion when a
body rolls on a surface. The primary cause of pneumatic tire rolling resistance is hysteresis: A characteristic of a deformable
material such that the energy of deformation is greater than the energy of recovery. The rubber compound in a tire exhibits
hysteresis.
The force that resists the motion of a body rolling on a surface is called the rolling resistance or the rolling friction.
The rolling resistance can be expressed as
Fr = cW………………………………. (1)
where
Fr = rolling resistance or rolling friction (N, lbf)
c = rolling resistance coefficient - dimensionless (coefficient of rolling friction - CRF)
W = mag
= normal force - or weight - of the body (N, lbf)
m = mass of body (kg, lb)
ag = acceleration of gravity (9.81 m/s2, 32.174 ft/s2)
The rolling resistance can alternatively be expressed as
Fr = clW / r…………………………. (2)
where
cl = rolling resistance coefficient - dimension length (coefficient of rolling friction) (mm, in)
r = radius of wheel (mm, in)
Tyre Pressure: Tyre Pressure is generally defined as the amount of air inside a tire An aircraft tyre is designed to withstand
extremely heavy loads for short durations. The number of tires required for aircraft increases with the weight of the aircraft, as
the weight of the aeroplane needs to be distributed more evenly. Aircraft tire tread patterns are designed to facilitate stability in
high crosswind conditions, to channel water away to prevent hydroplaning, and for braking effect.
Each of the twelve Boeing 777-300ER main tires is inflated to 220 psi (15 bar), weighs 120 kg (260 lb), has a diameter of 134 cm
(53 in) and is changed every 300 cycles while the brakes are changed every 2000 cycles.
Aircraft tires generally operate at high pressures, up to 200 psi (14 bar) for airliners, and even higher for business jets. The main
landing gear on the Concorde was typically inflated to 232 psi (16.0 bar), whilst its tail bumper gear tires were as high as 294 psi
(20.3 bar). The high pressure and weight load on the Concorde tyres were a significant factor in the loss of Air France Flight
4590.
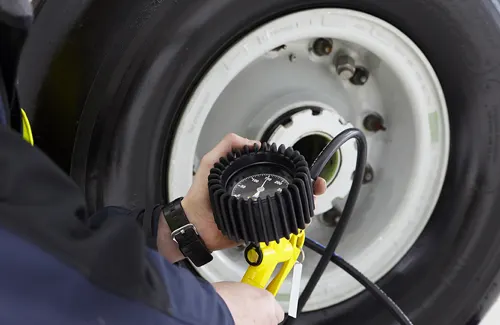
Brake Forces Landing: The brake unit is powered by the hydraulic system because stopping a 200-tonne aircraft landing at 180 mph (289.682 Kmph) requires a lot of braking force. During braking condition, an electrical signal is sent from the flight deck to hydraulic actuators near the main landing gear. Here, hydraulic fluid at 3,000 pounds per square inch is used to force the brake unit against the wheel, thus slowing it down.
- With necessary assumptions, calculate the force and power required to push / pull an aircraft by a towing vehicle.
The Figure shows the towing vehicle with aircraft. The forces acting in the towing vehicle during landing of aircraft is
F=Frr+Fad
where Frr : Rolling resistance force
Fad: Aerodrag force.
P=F*V. watts.
Aircraft details:
Kerb Weight (Kg) = 57600
Payload (Kg) (Only for Boeing 737 Passenger + Bags) = 10400
Total Weight (Kg) (Boeing 737) = 68000
Coefficient of rolling resistance (μrr) = 0.007
Gravitational Force g = (m s-2) = 9.81
Air Drag Calculation Data:
Air Density (Kg/m3) (rho) = 1.25
Width (m) = 4.01
Height (m) = 3.76
Frontal Area a (m2) = 15.0776
Drag Coefficient (cd) = 0.026
Speed Kmph = 8
Towing Vehicle details:
Kerb Weight (Kg) = 569
Payload (Kg) (Only Driver) = 55
Total Weight (Kg) (AP8360) = 624
Coefficient of rolling resistance (μrr) = 0.001
Gravitational Force g = (m s-2) = 9.81
Air Drag Calculation Data:
Air Density (Kg/m3) (rho) = 1.25
Width (m) = 0.8255
Height (m) = 1.26365
Frontal Area a (m2) = 1.043143075
Drag Coefficient (cd) = 0.96
Speed Kmph = 8
Forces required to pull an aircraft by a towing vehicle
The rolling resistance for the aircraft can be calculated as
Fr = c mr ag
where
Fr = rolling resistance (N, lbf)
c = rolling resistance coefficient
mr = rolling mass (kg, lbm)
ag = acceleration of gravity (9.81 m/s2)
The friction force for the towing machine can be calculated to
Ff = μ W
= μ mf ag
where
Ff = frictional force (N, lb)
μ = friction coefficient
W = weight (N, lbf)
mf = friction mass (kg)
excel calulcator for that
| S.No | Parameters | Aircraft | Towing vehicle |
| 1 | Total weight | 68000 | 624 |
| 2 | Rolling resistance coefficient | 0.007 | 0.001 |
| 3 | gravitational constant | 9.81 | 9.81 |
| 4 | Rolling resistance Force | 4669.56 | 6.12144 |
| 5 | Total Rolling resistance Force | 4675.68144 | |
| 6 | Air drag Force | ||
| 7 | Air Density (Kg/m3) (rho) | 1.25 | 1.25 |
| 8 | Frontal Area a (m2) | 15.0776 | 1.043143075 |
| 9 | Drag Coefficient (cd) = 0.026 | 0.026 | 0.96 |
| 10 | Speed Kmph | 8 | 8 |
| 11 | Speed conversion to m/s | 2.222 | 2.22 |
| 12 | Aerodynamic Drag | 1.20968889 | 3.084615798 |
| 13 | Total Aerodrag | 4.294304689 | |
| 14 | Total Force | 4679.975745 | |
| 15 | Total Power | 10398.9061 |
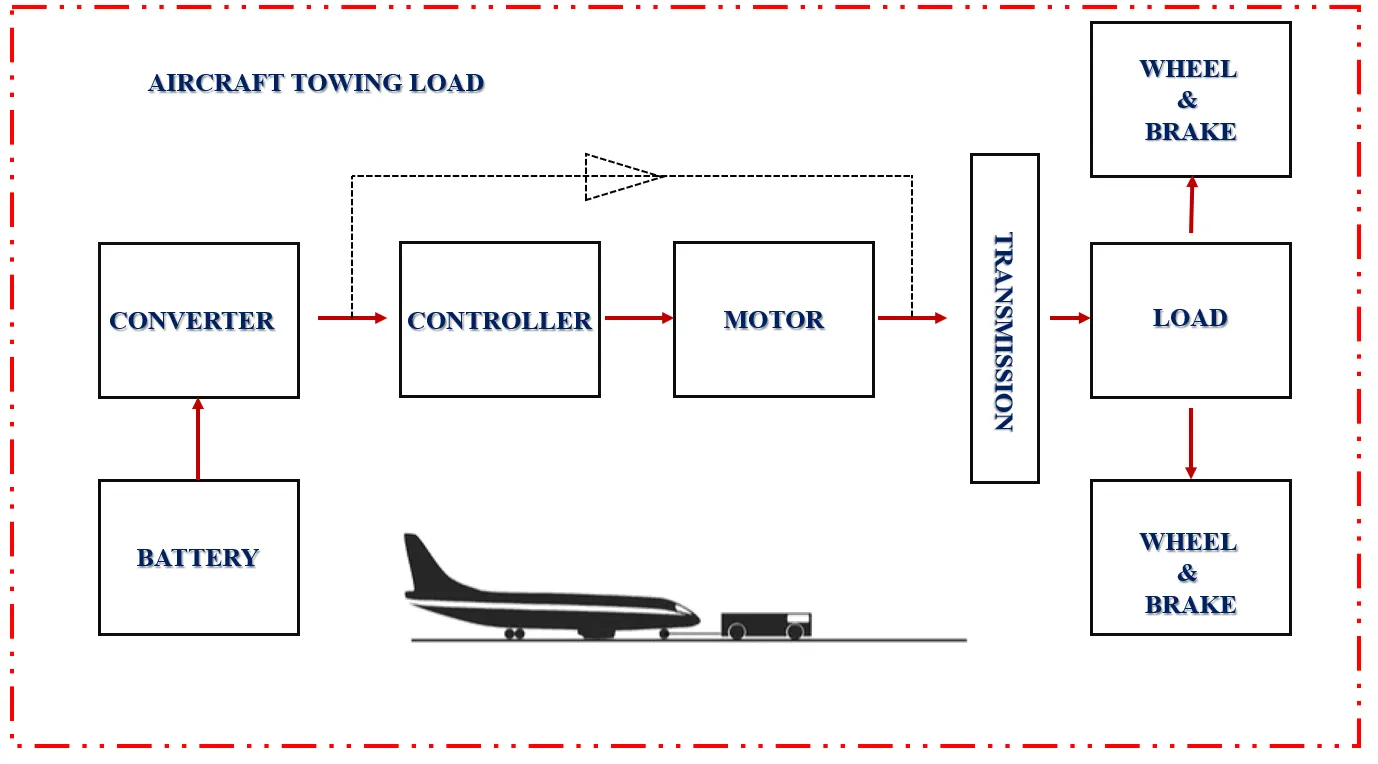
7.Design an electric powertrain with type of motor, it’s power rating, and energy requirement to fulfill aircraft towing application. Estimate the duty cycle range to control the aircraft speed from zero to highest. Make all required assumptions. Prepare a table of assumed parameters. Draw a block diagram of powertrain.
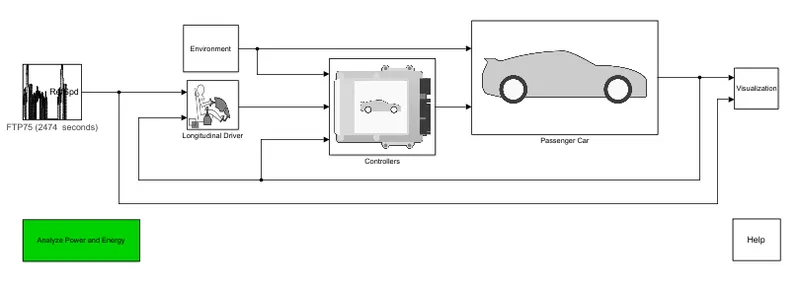
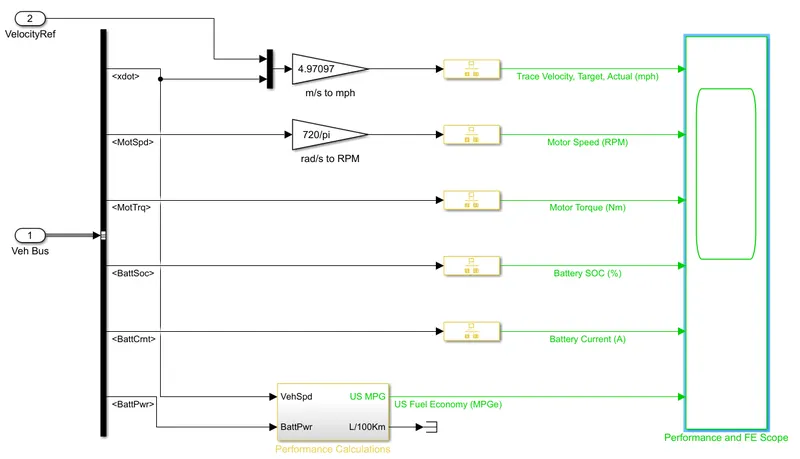
For calculation,
Change the velocity to 8 kmph or 4.97097 mph
Also enter motor input = 720 RPM
Drive Cycle Source block — FTP75 (2474 seconds)
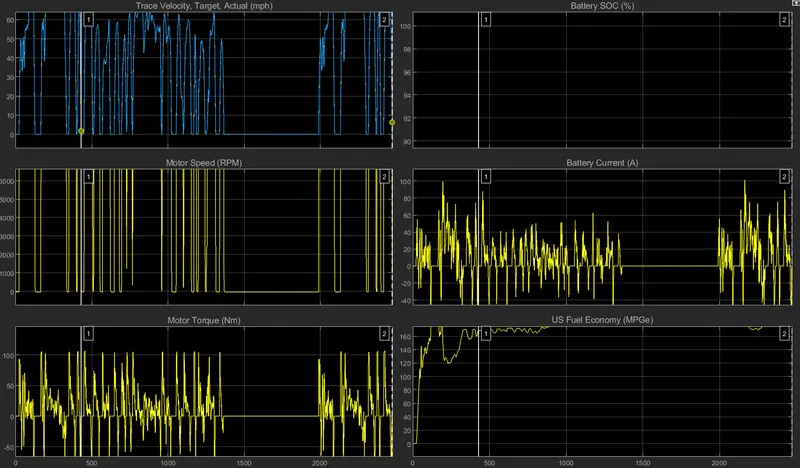
From the above Graph, we get the following details for the aircraft towing application based on assumption data.
Motor Torque: 3.714 N-m
Motor Speed: 3.086 /s
Battery SOC (%): 2.853 / ks
Battery Current (A): 2.13e-46 A/s
Assumed data,
Boeing 737 data as an assumed parameter
Total Weight (Kg) (Boeing 737) = 68000
Payload (Kg) (Only for Boeing 737 Passenger + Bags) = 10400
Total Weight (Kg) (AP8360) = 624
Width (m) = 01
Height (m) = 76
Towing Speed Kmph = 8 at towing
Total Tractive Force (N) = 769931
Total Power at given speed (kW) = 37948874 kW
Motor rated RPM for towing machine = 720
Rolling Resistance Force (N) = 56
Air Drag Force (N) = 209930864
Drag Coefficient (cd) = 026
For Duty cycle calculation
If the assumed consider losses will be 75 % (0.75) for the duty cycle at voltage armature 750
Then,
Motor voltage = Armature voltage x Duty cycle
= 750 x 0.75
= 562.5 V
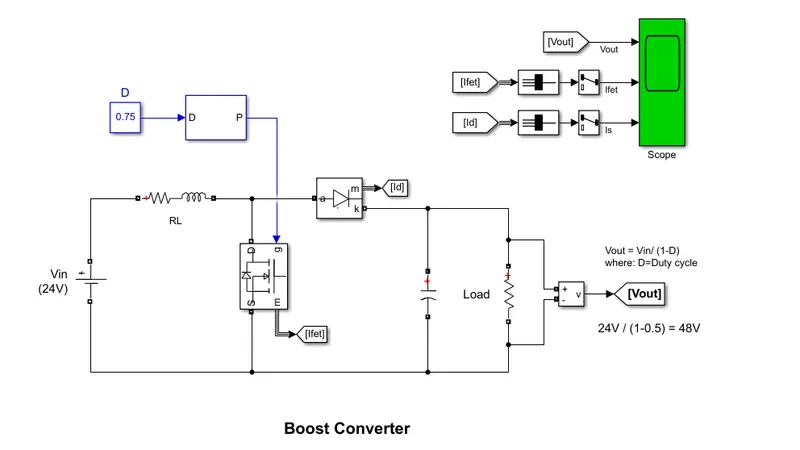
Therefore at 75% (0.75) duty cycle the voltage of motor terminal will be 562.5 V and here I used Boost Converter for plotting
Duty cycle by using assumed data.
Thus,
Input voltage amplitude is (Vin) = 562.5 V
Duty cycle (D) = 75% (0.75)
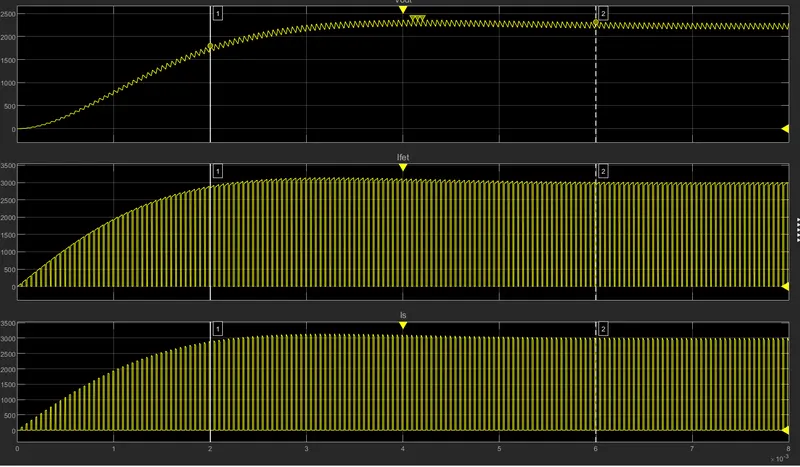
Voltage output (Vout)
128.849 / ms at 250.00 Hz
Slew Rate = 954.692 / ms