Project 1 - Parsing NASA thermodynamic data
PARSING NASA THERMODYNAMIC DATA
AIM-
To calculate thermodynamic properties of various gas species using MATLAB to parse the NASA Thermodynamic data file which is already provided.
OBJECTIVE-
- Write a function that extracts the 14 coefficients and calculates the Enthalpy, entropy, and specific heats for all the 53 species in the 'THERMO.dat' file.
The formulae given are shown below-

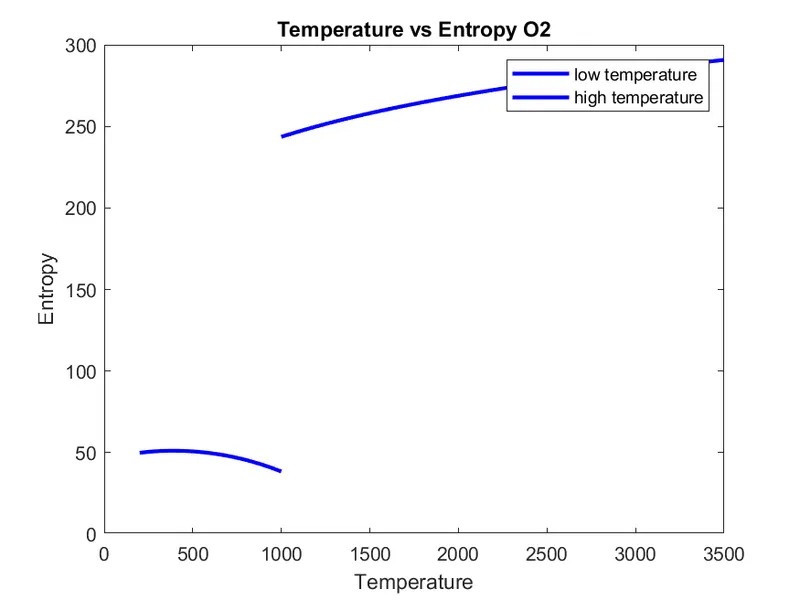
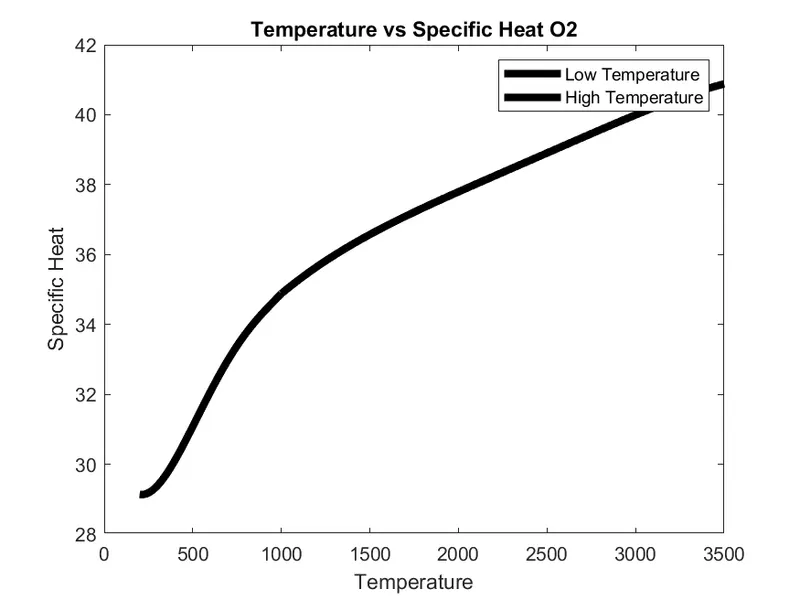
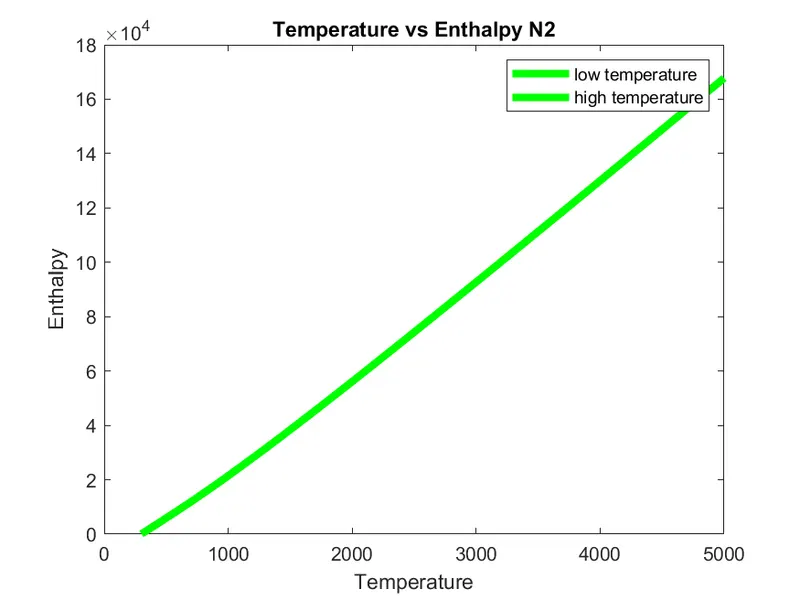
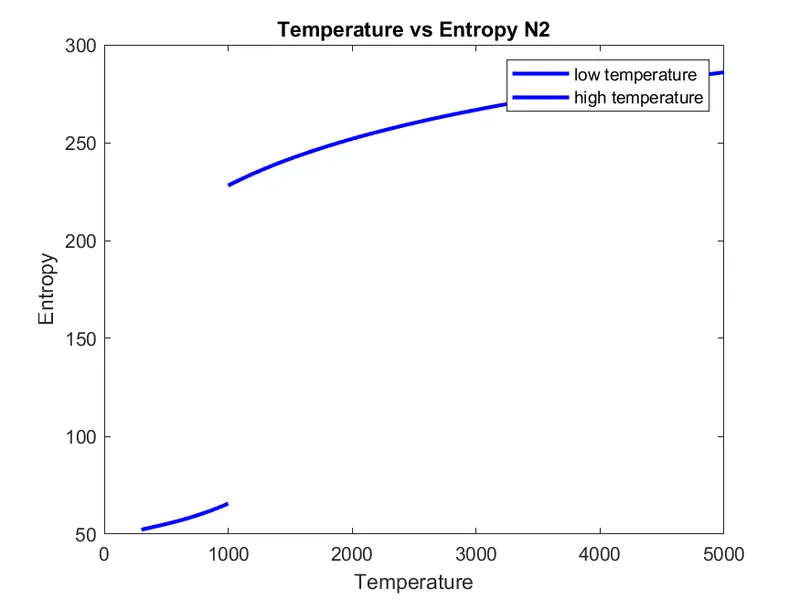
- Calculate the molecular weight of each species and plot the Cp, Enthalpy and Entropy for the local temperature range (low temperature : high temperature) specific for each species and also save the plots as images with their names in their respective folders.
MATLAB CODE FOR PLOTTING -
clear all
close all
clc

%to read the file and then read the line first line
f1= fopen('THERMO.dat','r')
fgetl(f1);

%defining the temperatutre values
temp1= str2num(fgetl(f1))
global_low_temp= temp1(1);
global_mid_temp= temp1(2);
global_high_temp= temp1(3);

%for skipping the unwanted lines in the data file
for i= 1:3
    fgetl(f1);
end

%for reading the lines for all the 53 species, the for loop is used
for i= 1:53

    line1= fgetl(f1)
    l= strsplit(line1," ");
    m= length(l);
    species= l{1};

    % Storing the values of the local temperature values
low_temp= str2double(l(m-3));
med_temp= str2double(l(m-1));
high_temp= str2double(l(m-2));

%storing the values of the second line of variables
line2= fgetl(f1);

%finding the position of E
a= strfind(line2,'E')

%reading all the other variables
a1= str2double(line2(1:(a(1)+3)));
a2= str2double(line2((a(1)+4):(a(2)+3)));
a3= str2double(line2((a(2)+4):(a(3)+3)));
a4= str2double(line2((a(3)+4):(a(4)+3)));
a5= str2double(line2((a(4)+4):(a(5)+3)));

%storing the values of line 3
line3= fgetl(f1);
%finding the position of E
b= strfind(line3,'E')

%storing the values of line three of variables
a6= str2double(line3(1:(b(1)+3)));
a7= str2double(line3((b(1)+4):(b(2)+3)));
a8= str2double(line3((b(2)+4):(b(3)+3)));
a9= str2double(line3((b(3)+4):(b(4)+3)));
a10= str2double(line3((b(4)+4):(b(5)+3)));

%storing the values of line 4
line4= fgetl(f1);
%finding the position of E
c= strfind(line4,'E')

%storing the values of line four of variables
a11= str2double(line4(1:(c(1)+3)));
a12= str2double(line4((c(1)+4):(c(2)+3)));
a13= str2double(line4((c(2)+4):(c(3)+3)));
a14= str2double(line4((c(3)+4):(c(4)+3)));

%creating temperatures for lower and higher temperatures
lower_temp= linspace(low_temp,med_temp,100);
higher_temp= linspace(med_temp,high_temp,100);

% Value of the universal gas constant in j/mol*K
R = 8.314; % Universal Gas Constant


% Calculating the values for cp, H and S using the given formulas
for k=1:100

% lower temperature values for cp,h,s calculations i.e  low to middle temp values
cp_low(k)= ((a8)+(a9*lower_temp(k))+(a10*(lower_temp(k)^2))+(a11*(lower_temp(k))^3)+(a12*(lower_temp(k))^4))*R;

h_low(k)= ((a8)+(((a9)*(lower_temp(k))/2))+((a10)*(lower_temp(k)^2)/3)+(((a11)*(lower_temp(k)^3))/4)+(((a12)*(lower_temp(k)^4))/5)+((a13)/(lower_temp(k))))*R*lower_temp(k);

s_low(k)= (((a8)*(log(lower_temp(k))))+((a9)*(lower_temp(k)))+(((a10)*(lower_temp(k)^2))/2)+(((a11)*((lower_temp(k)^3))/3)+(((a12)*(lower_temp(k)^4))/4)+(a14))*(R));

% higher temperature values for cp,h,s calculations i.e mid to high temp values
cp_high(k)=(a1+(a2*higher_temp(k))+(a3*(higher_temp(k)^2)+(a4*(higher_temp(k))^3)+a5*(higher_temp(k))^4))*R;

h_high(k)=((a1)+(((a2)*(higher_temp(k)))/2)+(((a3)*(higher_temp(k)^2))/3)+(((a4)*(higher_temp(k)^3))/4)+(((a5)*(higher_temp(k)^4))/5)+((a6)/(higher_temp(k))))*R*higher_temp(k);

s_high(k)=(((a1)*(log(higher_temp(k))))+((a2)*(higher_temp(k)))+(((a3)*(higher_temp(k)^2))/2)+(((a4)*(higher_temp(k)^3))/3)+(((a5)*(higher_temp(k)^4))/4)+(a7))*(R);

end

%making folders for saving the plots
nasa_graphs= species;
mkdir(nasa_graphs);
current= pwd;
cd(nasa_graphs);

%plotting the graphs

%for specific heat(Temperature vs Specific Heat)
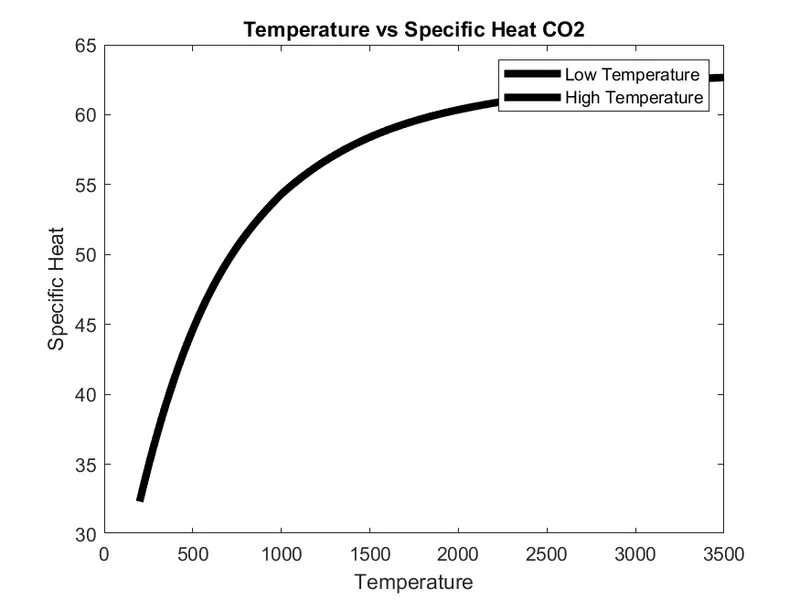
figure(1)
plot(lower_temp,cp_low,'linewidth',4,'color','k');
hold on
plot(higher_temp,cp_high,'linewidth',4,'color','k');
hold off
title(['Temperature vs Specific Heat ',species]);
xlabel('Temperature');
ylabel('Specific Heat');
legend('Low Temperature','High Temperature');
fig= sprintf('Specific Heat of %s.png',species);
saveas(gca,fig);

% For Enthalpy(Temperature vs Enthalpy)
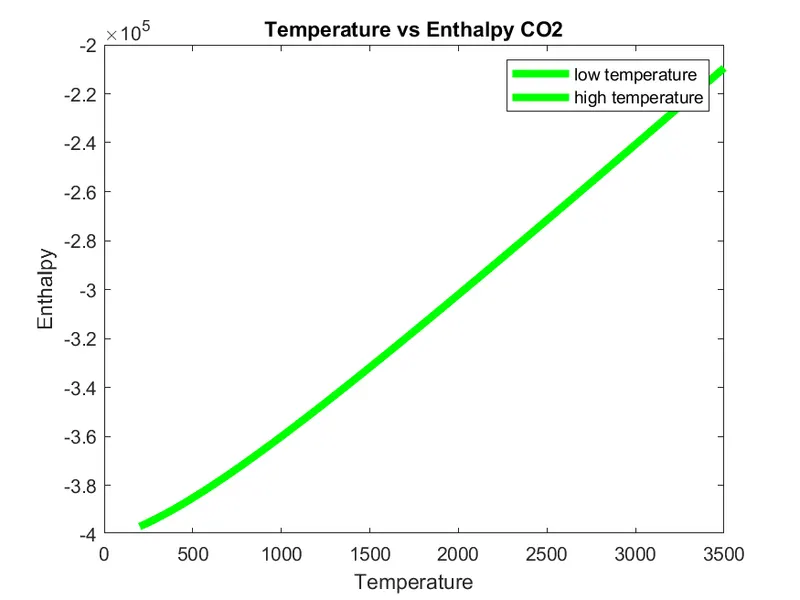
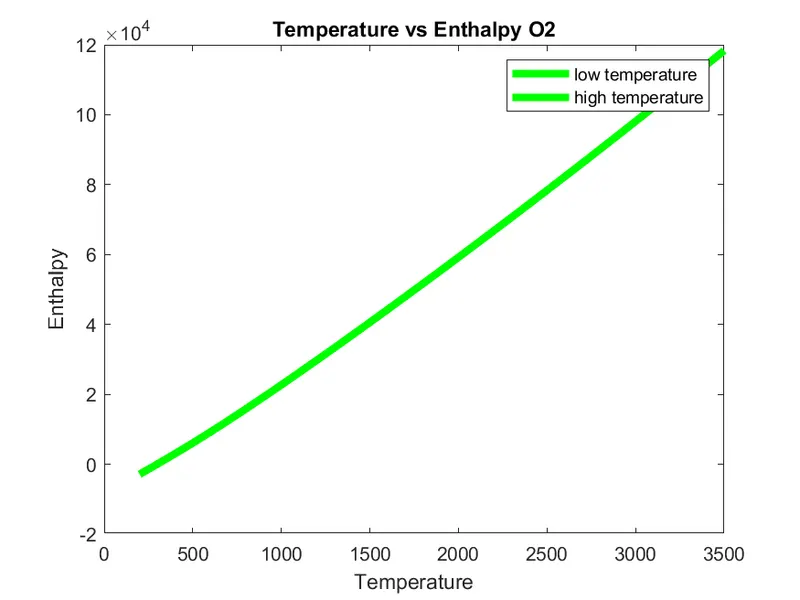
figure(2)
plot(lower_temp,h_low,'linewidth',4,'color','g');
hold on
plot(higher_temp,h_high,'linewidth',4,'color','g');
hold off
title(['Temperature vs Enthalpy ',species]);
xlabel('Temperature');
ylabel('Enthalpy');
legend('low temperature','high temperature');
fig = sprintf('Enthalpy of %s.png',species);
saveas(gca,fig);

% For Entropy(Temperature vs Entropy)
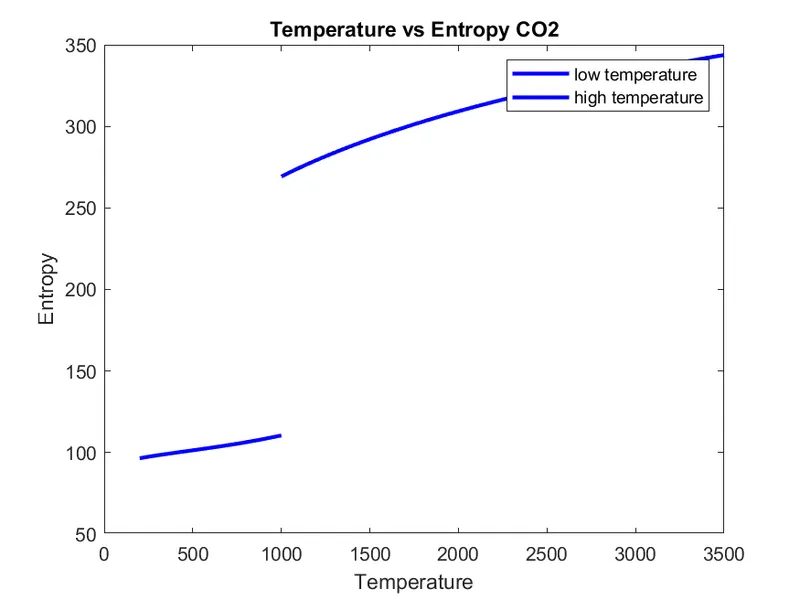
figure(3)
plot(lower_temp,s_low,'linewidth',2,'color','b');
hold on
plot(higher_temp,s_high,'linewidth',2,'color','b');
hold off
title(['Temperature vs Entropy ',species]);
xlabel('Temperature');
ylabel('Entropy');
legend('low temperature','high temperature');
fig = sprintf('Entropy of %s.png',species);
saveas(gca,fig);
cd(current)
end
Explaination-
- To read the file fopen and then to read the first line fgetl are used.
- The temperature values are to be read next which are provided in the THERMO data file. The THERMO data file shuld be saved in the same folder as the file whcih is now getting created. The low, medium and high values are now stored in the global_low_temp, global_med_temp, global_high_temp.
- For reading the lines and for repeating for all the 53 species, the for loop is used.
- The local temperatures are stored in the low_temp, med_temp, high temp.
- Reading the values of each temperature present by reading E in that.
- Creating temperatures for lower and higher temperatures and then calculating the values for cp, H and S using the given formulas.
- Creating the cp, H, S values for all low, high temperatures.
- For saving the plots which will be created in the next stage, mkdir is used.
- Plot the graphs between Temperature vs Specific Heat, Temperature vs Enthalpy, Temperature vs Entropy.
PLOTS-
O2
N2
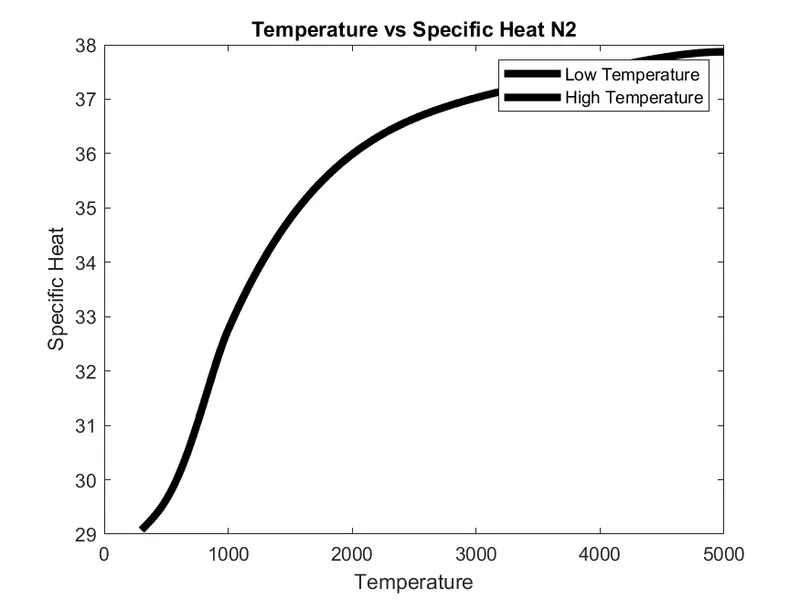
CO2