Project Objective:- To create a 3D model of a flow bench and run a CFD flow analysis and obtain a plot of lift vs mass flow rate. A grid dependency test was done to show the effect of valve lift on mass flow rate.
Introduction:- Computational Fluid Dynamics (CFD) is a branch of fluid mechanics that uses numerical analysis and algorithms to solve and analyze problems that involve turbulent fluid flows. It is widely accepted that the Navier–Stokes equations (or simplified Reynolds-averaged Navier–Stokes equations) are capable of exhibiting turbulent solutions, and these equations are the basis for essentially all CFD codes.
The Reynolds number is the ratio of inertial forces to viscous forces and is a convenient parameter for predicting if a flow condition will be laminar or turbulent. It can be interpreted that when the viscous forces are dominant (slow flow, low Re) they are sufficient to keep all the fluid particles in line, then the flow is laminar. Even exceptionally low Re indicates viscous creeping motion, where inertia effects are negligible. When the inertial forces dominate over the viscous forces (when the fluid is flowing faster and Re is larger) then the flow is turbulent.
An air flow bench is a device that measures the volume or mass of air that will pass through a bounded path or conduit in relation to an applied pressure differential. The pressure differential is usually relative to ambient air pressure and is often produced by some mechanical means such as an electric blower or at least one electric vacuum motor. The flow bench air source creates a pressure differential across the test object that causes air to flow through not only the test object but through the entire flow bench. At some point in the flow bench, the airflow velocity is measured. From the measured air velocity, the volume or mass of air that is flowing through the test object can be calculated.
A flow bench with an air source that can apply a pressure differential to the object being flow tested is referred to as an active flow bench. A passive flow bench has no air source, and the object being tested supplies its own pressure differential to promote measurable airflow, such objects would be electric blowers or fans and vacuum motors.
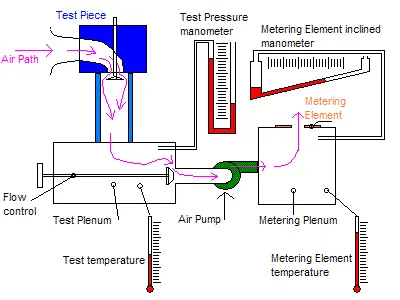
It is often believed that flow benches are only used for flow testing internal combustion engine cylinder heads, but in fact, many other items like carburetors, intake manifolds, exhaust manifolds, turbocharger housings, air filters, pneumatic couplings and fittings, AC grills and condensers, and nozzles of different types often find their way onto a flow bench. Early flow benches were mostly used to test aircraft carburetors. The picture below shows a typical flow bench schematic.
The valve lift is the distance between the top of the valve plate and the bottom of the valve guard when the valve plate is seated against the valve seat. Valve lift affects lift area, and adjusted equivalent area. Higher lift valves are more efficient (larger equivalent flow areas) but are not as durable as lower lift valves due to the higher impact forces (more time for the acceleration of the valve plate).
Setup:- A 3D model was designed using the SolidWorks CAD software, and the SI engine intake port was designed alongside the poppet valve. The fluid motion inside the internal combustion engine is a very important factor controlling the combustion process, this is due to the turbulence intensity inside the chamber. An important thing to consider here is the swirl flow inside the chamber, a swirl flow is a fluid flow in which the fluid particles have a tangential component of velocity about an axis which, when combined with an axial component of velocity, produces a helical or spiral flow. The strength of the swirl flow is calculated by the swirl ratio, a dimensionless parameter, and a ratio of angular velocity to axial velocity.
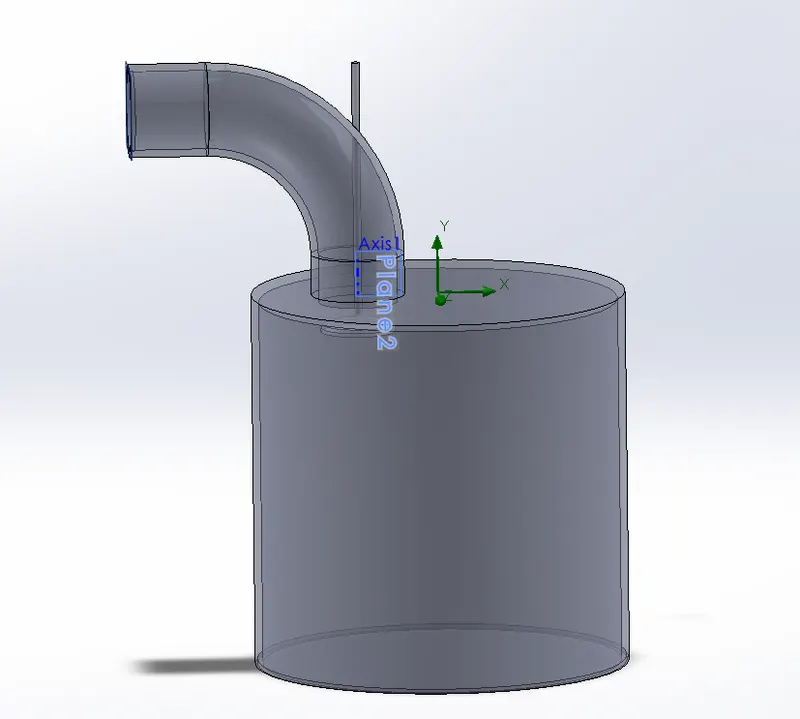
The next step was to assign boundary conditions to the model, the inlet face was assigned as the total pressure which for this project was recorded as double the amount of the atmospheric pressure, and the outer face as static pressure opening, and that value was taken as the atmospheric pressure. The next stage was to insert goals for the project, the mass flow rate in the outlet was chosen as the surface goal.
The next stage was to conduct the Grid dependency test, where, analysis begins with a coarse mesh and it is refined to finer mesh for each run until the results do not change significantly and depend of the grid size anymore. As the grid or mesh size approaches zero, the approximate solution is almost equal to the actual solution
A local mesh with a refinement of 5 was considred optimal and used the least amount of computational data ( other values used were 6,7 and 8). The local mesh was used on the faces of the valve to give better readings as the pressure loss will develop mostly there, The meaning of meshing–or mesh generation–is: defining continuous geometric shapes (such as 3D models) using 1D, 2D, and 3D shapes (mesh faces). The finer the mesh, the more accurately the 3D model will be defined.
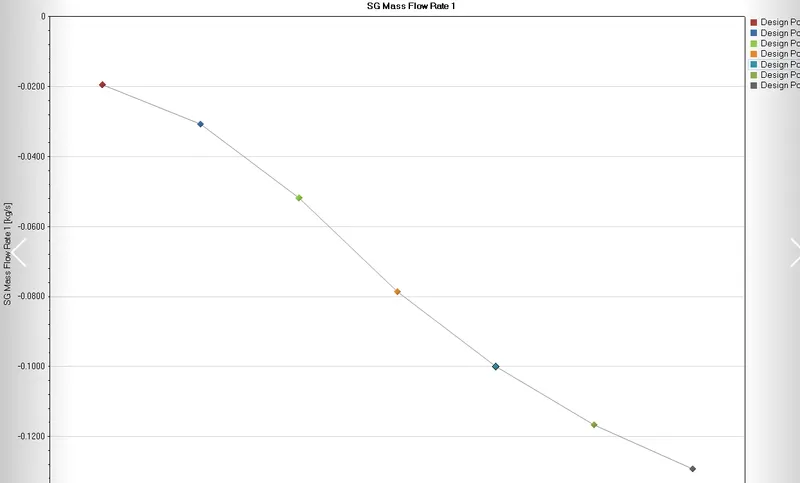
Study:- As stated earlier, the project intent was to highlight the effect of valve lifts and mass flow rate so a parametric study was conducted for the valve lift distance. The distances of the valve lift were 0.01 to 0.08 mm for 7 divisions and the mass flow rate for each iteration and the chart was shown below.
| |
Design Point 1 |
Design Point 2 |
Design Point 3 |
Design Point 4 |
Design Point 5 |
Design Point 6 |
Design Point 7 |
| D3@Sketch4@Flowbench_part.Part [m] |
0.001 |
0.002166667 |
0.003333333 |
0.0045 |
0.005666667 |
0.006833333 |
0.008 |
| SG Mass Flow Rate 1 [kg/s] |
-0.019441238 |
-0.030701613 |
-0.051917424 |
-0.078695975 |
-0.100116022 |
-0.116986255 |
-0.129723848 |
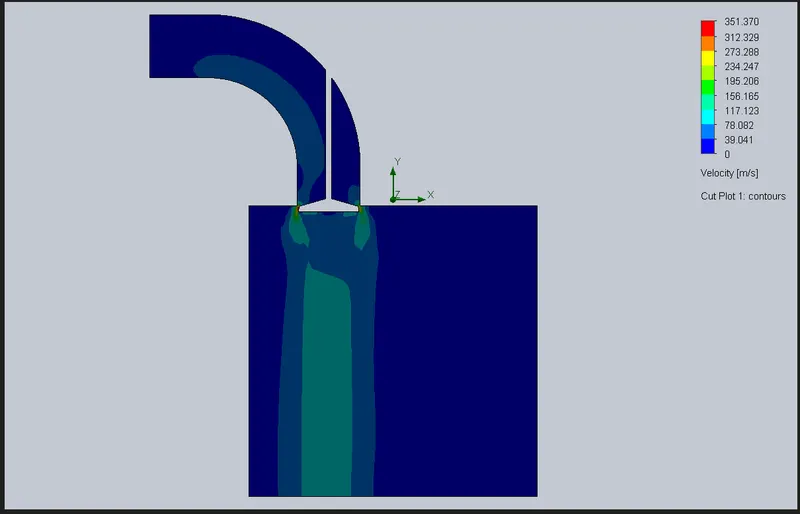
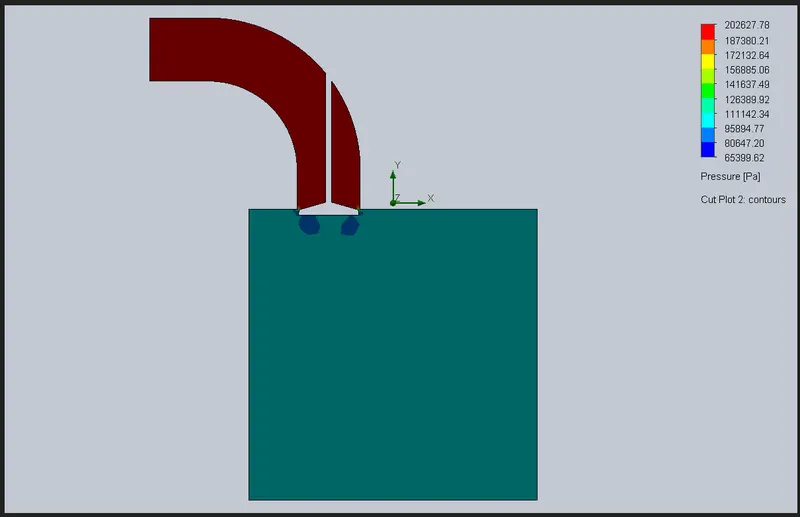
Simulation Pictures:-
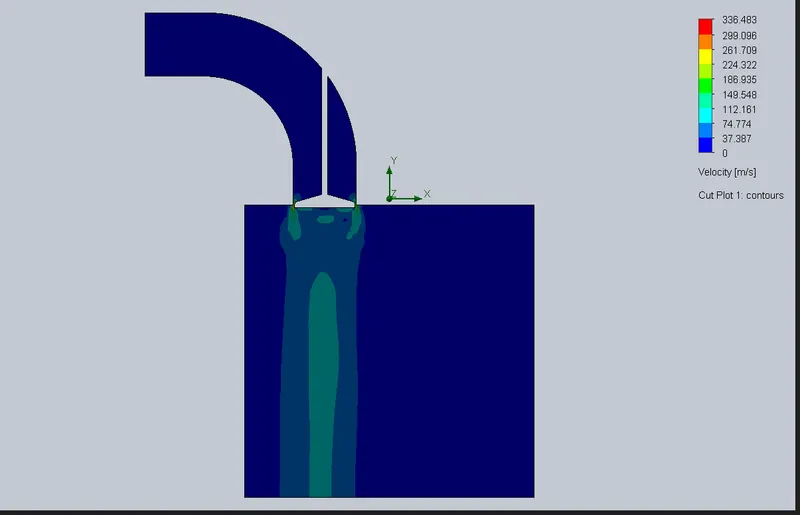
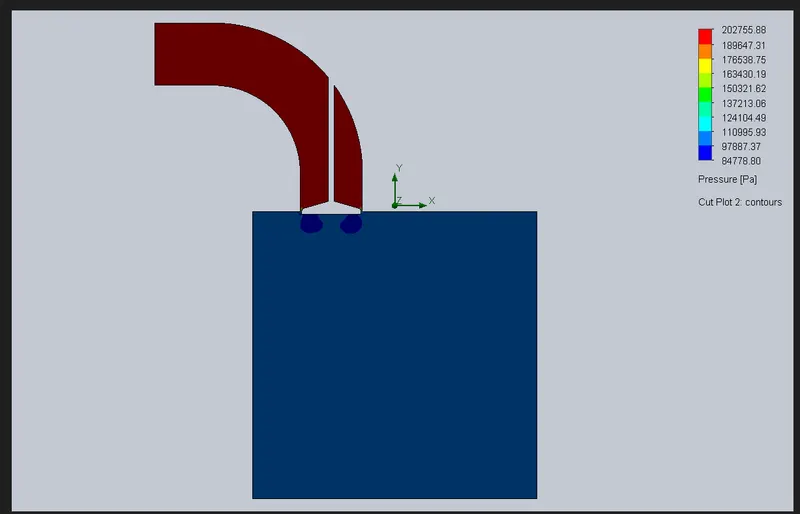
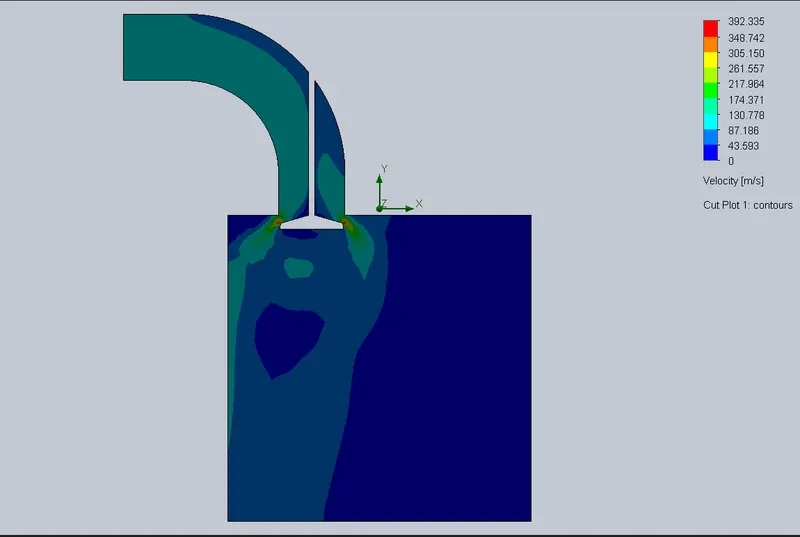
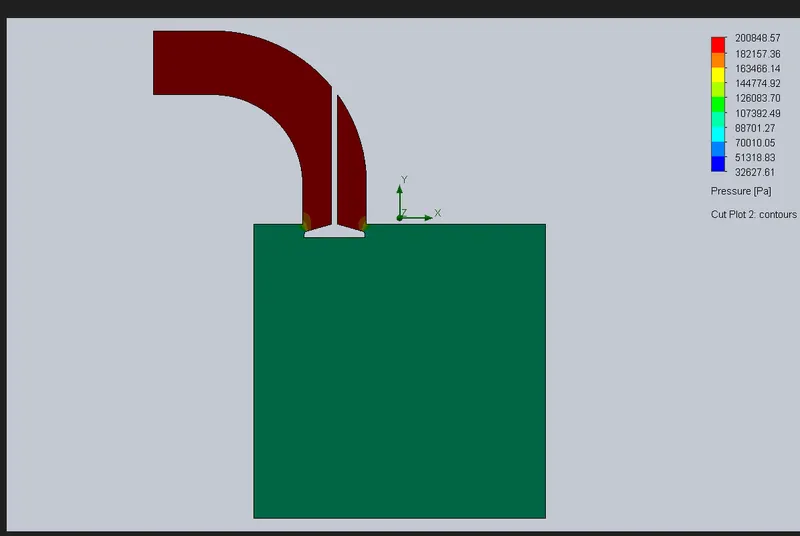
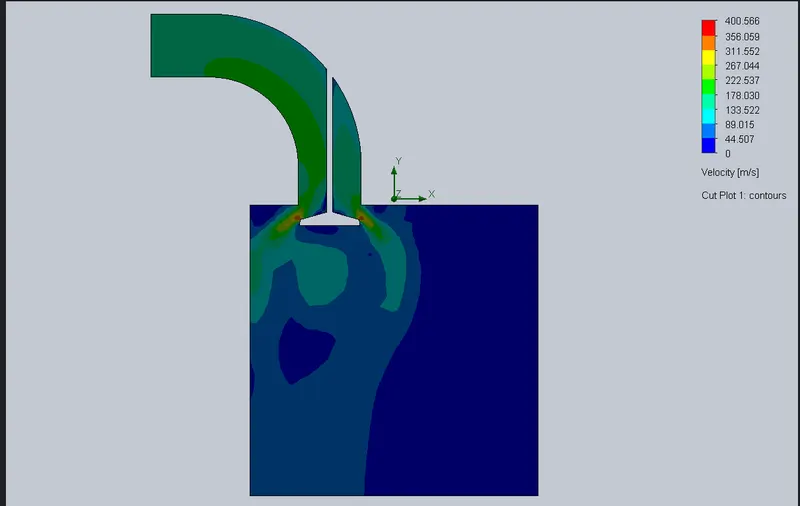
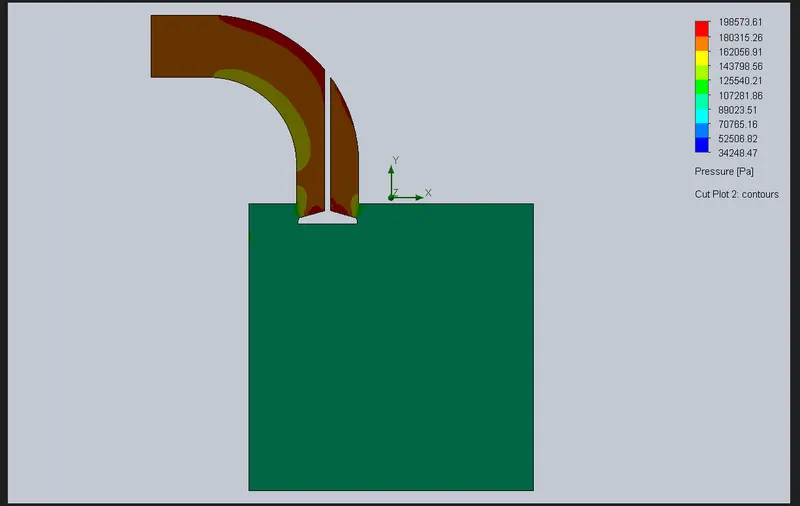
For Valve Lift = 0.001mm
Velocity cut plot:-
Pressure Cut plot:-
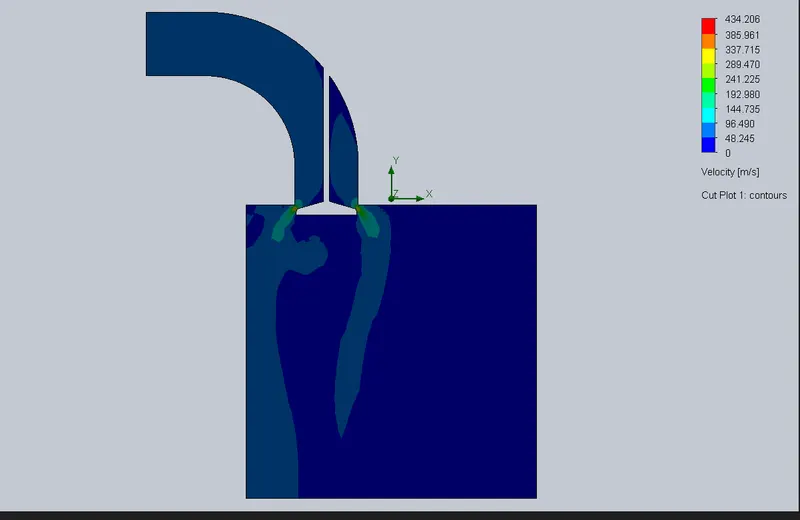
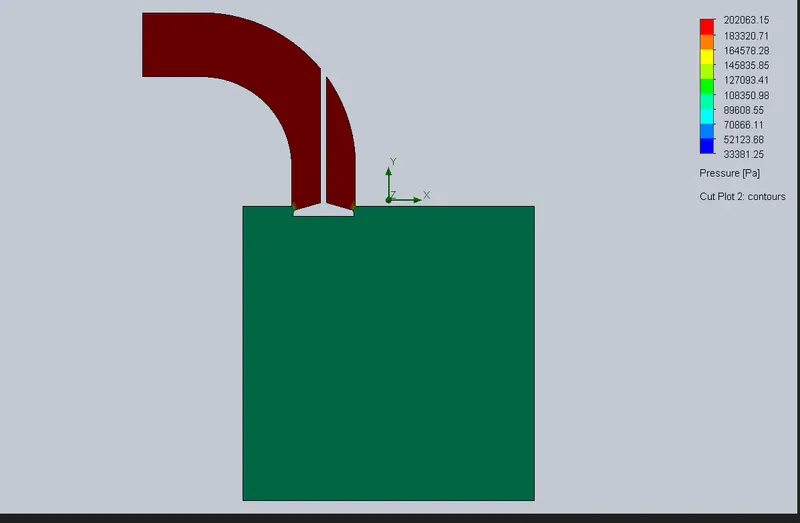
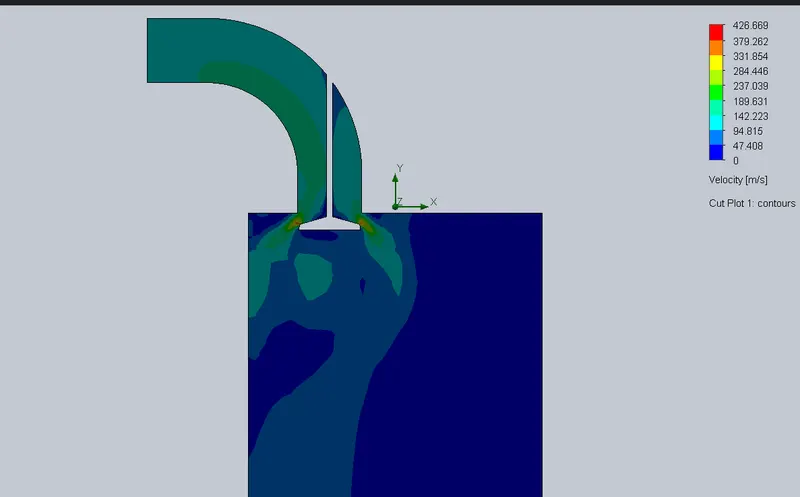
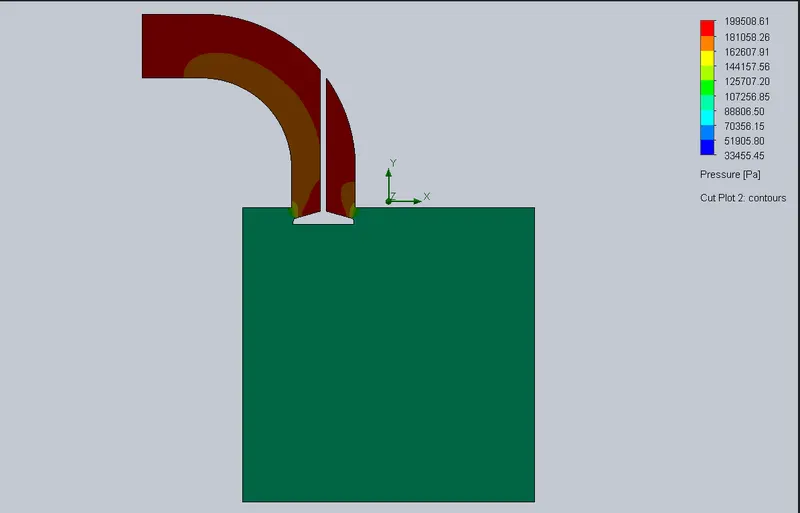
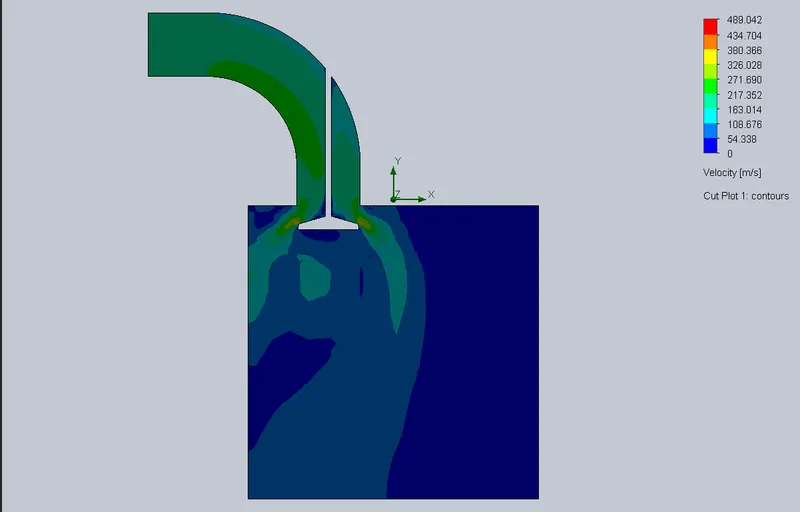
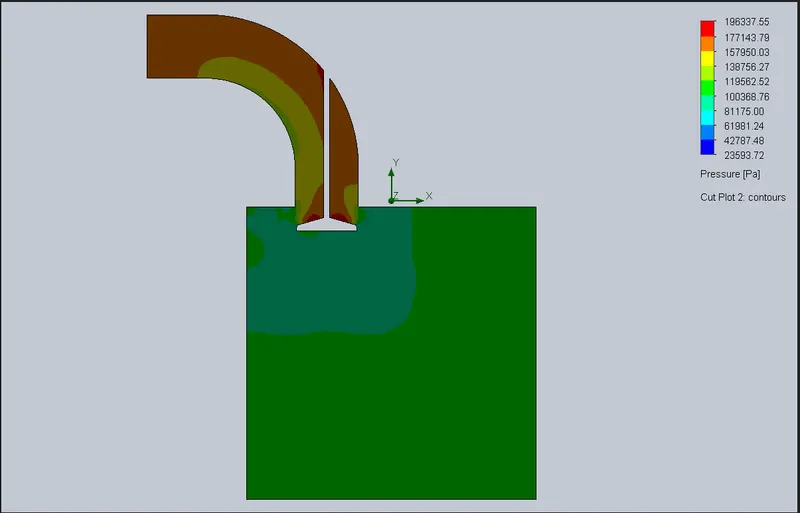
For Valve lift = 0.002166667
Velocity plot
Pressure Plot
For valve lift = 0.00333..
Velocity plot
Pressure plot
For Valve lift = 0.0045
Velocity plot
Pressure plot
For Valve lift = 0.00566..
Velocity plot
Pressure plot
For valve lift = 0.00683..
Velocity plot
Pressure Plot
For Valve lift = 0.008
Velocity plot
Pressure plot
Conclusion:- The table clearly shows as the valve lift increases, so does the mass flow rate of the fluid inside the cylinder and as the mass flow rate increases, the velocity of the fluid at the inlet also increases which in turn causes a decrease in pressure. Also, the swirl and tumble ratio decreases when the valve lift is increased.