Final Project: Electric Rickshaw modelling
1.Create a detailed MATLAB model of an electric rickshaw (three wheel passenger vehicle) as per details below:
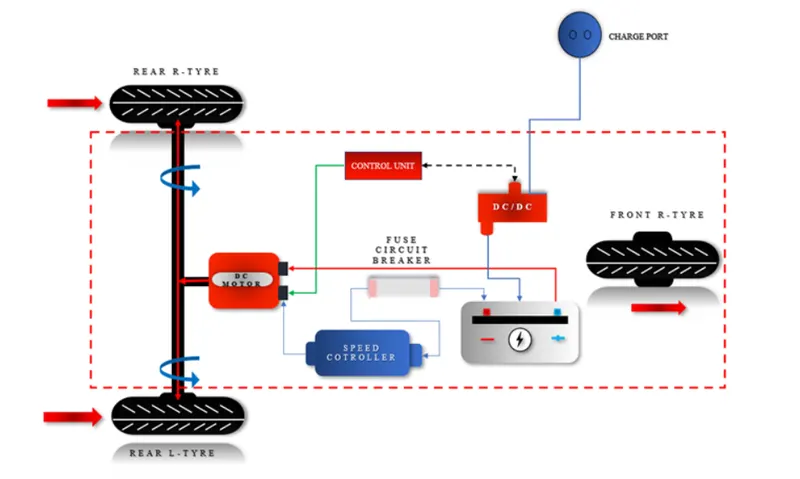
Rear wheels driven by PM brushed type motor
Assume efficiency points of motor controller and motor
Make an excel sheet of all input and assumed data
Results: For any three standard driving cycles show energy consumption, temperature rise of motor and controller for 100 km constant speed driving at 45 kmph.
(Note- The simulink model file should be compulsorily attached)
Aim:
To Create a detailed MATLAB model of an Electric Rickshaw(Three wheel Passenger Vehicle)
Abstract:
- In this Project, we are going to built the MATLAB model of the Electric Rickshaw by using a PM brushed type DC motor and a suitable Lithium Ion battery for the motor.
- In this Project, we are understand the basic information of the Electric Rickshaw.In this model we will take three different drive cycle and give the constant speed of 45Kmph for 100Km.
Objective:
- Create a detailed MATLAB model of an electric rickshaw (three wheel passenger vehicle) as per details below:
- Rear wheels driven by PM brushed type motor
- Assume efficiency points of motor controller and motor
- Make an excel sheet of all input and assumed data
- Results: For any three standard driving cycles show energy consumption, temperature rise of motor and controller for 100 km constant speed driving at 45 kmph.
Methodology:
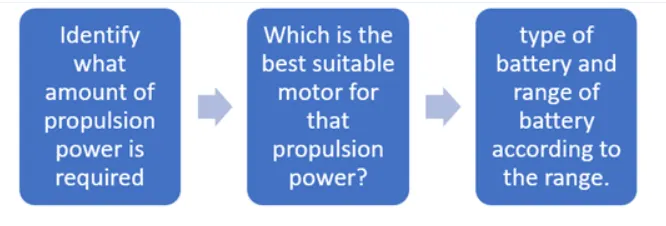
- The Electric Rickshaw is consists of a battery, motors, gear system and controller the it generates propulsion Power.
- To design any Vehicle first we have to calculate propulsion power then the motor is Selected.
- Operating Range, Motor rating everything is depend upon the battery capacity that we have selected.
So, the Design flow of the Vehicle engineers has to be like the following.
E-rickshaws are small vehicles, with three wheels and use electric power from batteries to run. They use an electrical motor of 650-1400W as engine which draws the electric power from the rechargeable batteries installed in rickshaw body. These battery operated vehicles are perfect for small distance transport, both cargo and people; they are perfect for running on narrow streets because of their small size. But biggest reason for their popularity is operating cost and zero pollution. They are like normal rickshaws but operated by electric motor instead of petrol or diesel. They are best for pollution free, environmental friendly transport system in short distances.
E-rickshaw is a good option due to less human effort and cost of fuel if compared with auto rickshaw and human pulled rickshaw. The pollution coming out from E-rickshaw is immensely less and it provides last mile connectivity that means it provides door to door service. Recently in India battery operated E-rickshaw are in much demand. Its comfortable and economic mode of transport has gained E-rickshaw popularity in India.
E-rickshaws are now of the preferred modes of transport in streets because of its low maintenance cost, ecofriendliness, being non noise pollutant, easy to drive. The motor is brushless DC motor manufactured mostly in India and China. The electrical system used in Indian version is 48V DC can run 90 to 100 km/full charge. Basic capacity is driver plus 3 passengers. The main objective is to develop a model of e-rickshaw and interfacing system with solar panel. E-rickshaw is a basically battery operated vehicle which is directly equipped with battery and solar panel. The main aim to develop the pollution free vehicle with use of hybrid mechanism (battery and solar panel).
❖ To construct rickshaw light in weight
❖ Use of good material for a long life.
❖ To developed rickshaw is easy to operate.
❖ Non-polluted
DESIGN METH0DOLOGY:
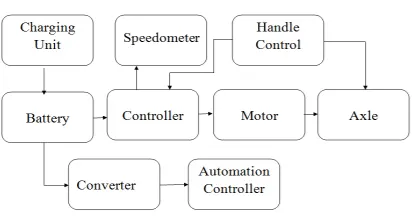
The block diagram gives whole process about the control system for vehicle. The charged battery gives the supply for controller. The controller controls whole automated controlling devices. The controller gives respective commands to the motor, speedometer etc. Proper commands given from the input were further given to the controller and controller operates. Controller drives the motor which deal to move the vehicle. Automation controller controls the whole automation devices which are based on the user input. Display indicates details regarding to the various parameters such as speed, GPS system, location etc. To stop the vehicle braking mechanism is provided so that when brakes are applied vehicle gets stopped. The control for whole the process is based on the hand control which is easier as compare to steering.
Design of Chassis
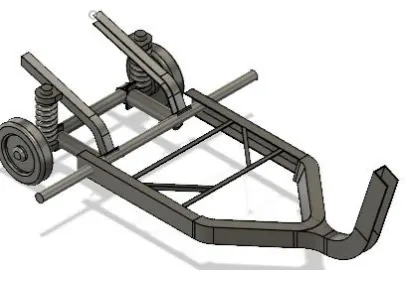
Most of the cities in developing countries are highly polluted. The main reasons are the air and noise pollution caused by transport vehicles, especially petrol-powered two and three wheelers and about 1.5 million petrol and diesel powered three wheeler and their population is growing at a healthy rate of about 15% per annum. The chassis is the "skeleton" of the rickshaw which provides the structural strength and the mounting points for other components. The chassis provides necessary support to the vehicle components placed on it such as suspension components and the weight of the driver. Electric auto rickshaw chassis designing and fabrication involves trade-offs.
CONTROLLER :
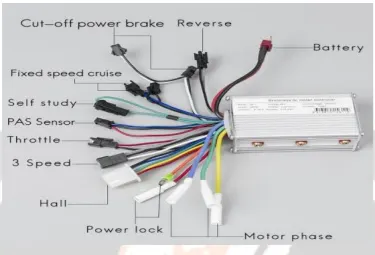
Motor controller usually supplied with AC power. The power that comes in to a controller is at a set frequency. The motor controller first turns that AC to DC then turns the DC back into AC at right frequency. It use device called rectified to make DC current. The speed of a BLDC motor controlled by controlling the input DC voltage/current. The higher the voltage more is the speed. Many different controller algorithms have been used to provide the control the BLDC motor speed. The motor voltage is controlled by using a power transistor operating as a linear voltage regulator
Selection of DC Motor:
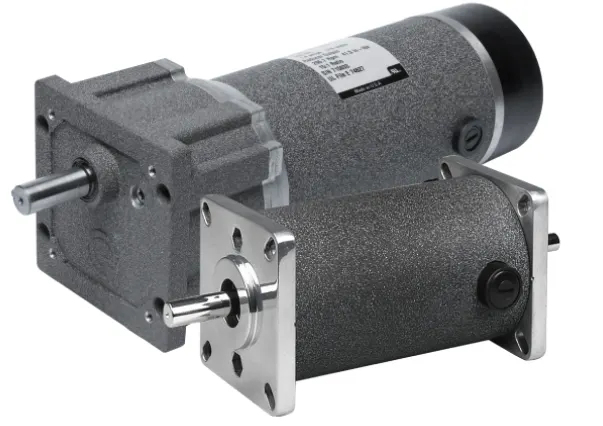
DC brushed and brushless motors to help you decide which to use in your application. For example, many machines today operate in a clean environment as opposed to being in a harsh industrial application. This would mean that long life and low noise would become key characteristics for drives used in these applications.
Selecting a DC motor includes first finding out what voltage is readily available for the application and what physical size the motor needs to be. Speed and torque can then be considered once these first two parameters are determined.
1. Voltage availability is a critical element in motor selection. Remote applications or portable devices, for example, are battery operated, while many rack-mounted devices and tools operate from a 24V power supply. DC motors are available for use at voltages as low as 1.5V and as high as 48V dependent on required power.
2. Physical size is often one of the limiting factors in motor selection because more and more applications have smaller footprints, like desktop 3D printers, portable medical devices, and hand tools. Often a compromise needs to be made between which motor to use and the available space it needs to fit into. Efficiency becomes a primary concern when you need to worry about power consumption to maximize battery life in a surgical tool or unmanned security drone.
3. As mentioned before, torque and speed also have an effect on motor frame size. High torque motors are often larger in size than their low-torque counterparts, which means that larger mounting hardware and larger housings may be an important machine requirement. For example, it takes a larger motor to rotate the magnets in an MRI than it does to run the windows in the doors of an automobile.
Although speed and torque are independent requirements in many applications, typically speaking when the torque increases the speed will decrease – if the voltage stays the same. This connection is based on the slope of the speed/torque curve.
4. Motor duty cycle could be one of the most telling aspects of a lot of semiconductor production machines. Intermittent operation not only reduces the wear and tear on the motor and increases the life of the motor, but it also means that a smaller motor size can be used without depleting the positive characteristics of the machine itself.
Selection of Differential Axel:
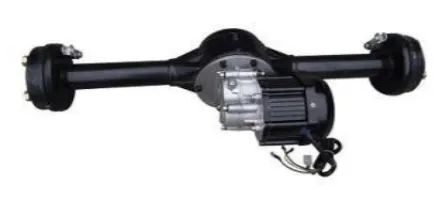
A vehicle with two drive wheels has the problem that when it turns a corner the drive wheels must rotate at different speeds to maintain traction. The automotive differential is designed to drive a pair of wheels while allowing them to rotate at different speeds. The size of differential axle is 33” (33 inches)
Selection of Battery
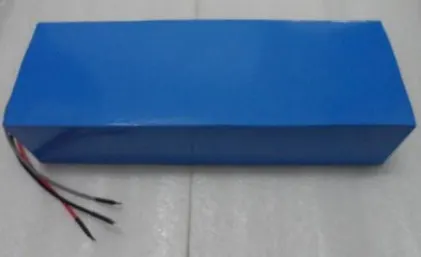
The electrolyte carries positively charged lithium-ions from the anode to the cathode and vice versa through the separator. The movement of the lithium-ion creates free electrons in the anode which creates a charge at the positive current collector. The separator blocks the flow of electrons inside the battery..
Procedure:
Vehicle Body Subsystem:
The Vehicle is assumed to be the front axle driven( 4 wheels and in 2 on each axle)
Tire
- The Tire (Magic Formula) block models a tire with longitudinal behavior given by the Magic Formula, an empirical equation based on four fitting coefficients. The block can model tire dynamics under constant or variable pavement conditions.
- The longitudinal direction of the tire is the same as its direction of motion as it rolls on pavement.
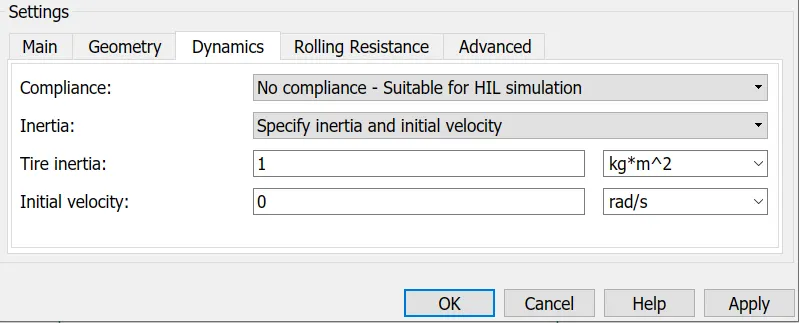
- To increase the fidelity of the tire model, you can specify properties such as tire compliance, inertia, and rolling resistance. However, these properties increase the complexity of the tire model and can slow down simulation. Consider ignoring tire compliance and inertia if simulating the model in real time or if preparing the model for hardware-in-the-loop (HIL) simulation
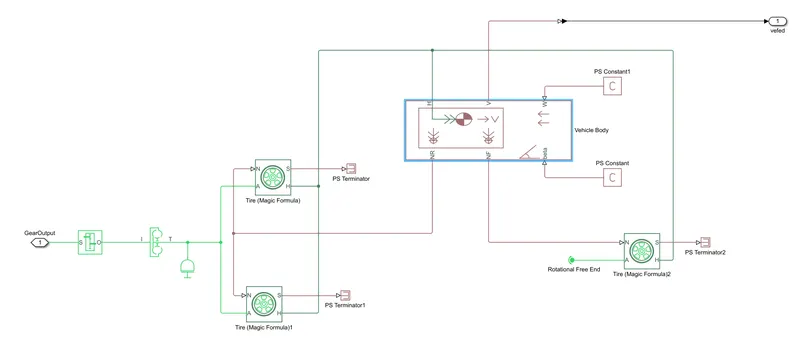
The wheels are modelled using simple Tire( Magical formula) simulink blocks.
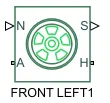
- The N port of the tire corresponds to the Normal Reaction acting on it.
- The A port corresponds to the Mechanical Rotational Conserving Port for the four wheel axle.Thus both the wheels on the same axle should form a connection through their respective A ports
- Connection H corresponds to the Mechanical Translational Conserving Port for the Wheel hub through which the thrust developed by the tire is applied to the vehicle.Thus, all the four wheels form a connection through their respective H ports and thus in turn connected to the translationa; hub of the vehicle body.
The connection S represent the output port for the slip of the tire.
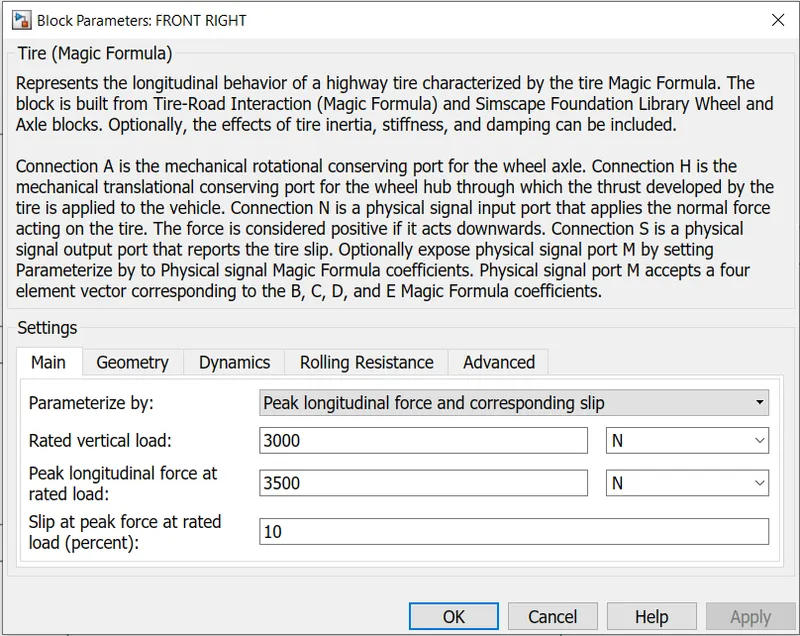
- The tires are parameterized by the peak longitudinal force and corresponding slip.
- The other block parameter such as rated vertical load, peak longitudinal force at rated load and slip at peak force at rated load are kept with their default values.
- The tire radius is given as 0.3m.
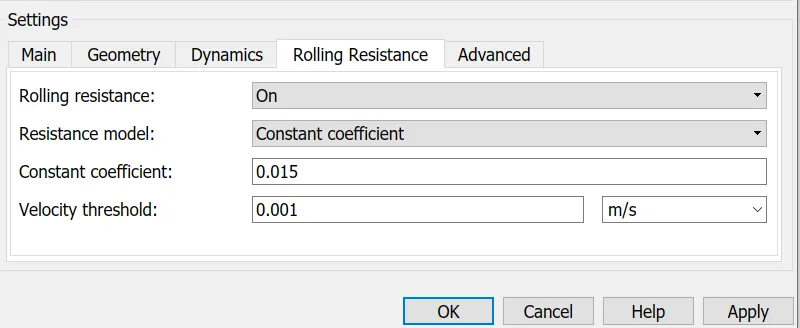
- The tire inertia is kept as 1 kg-m^2. Also the rolling resistance is given with a constant coefficient of 0.015
Velocity Body:
This 2 axle (4 wheel) assembly is now connected to a velocity Body simscape block.
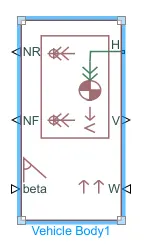
This block basically represent a two-axle vehicle body in longitudinal motion.The block accounts for
- Body mass
- aerodynamic drag
- Road incline
- Weight distribution between axles due to acceleration
- Road Profile.
Here the connection H is the mechanical translational conserving port NF and Nr are said to be a normal reaction forces on the front axle and the rear wheels respectively.Connection V represent the actual output translational velocity of the vehicle.
- Beta is the road inclinational angle and W corresponds to the headwind speed (headwind-direction opposite to that of the vehice)
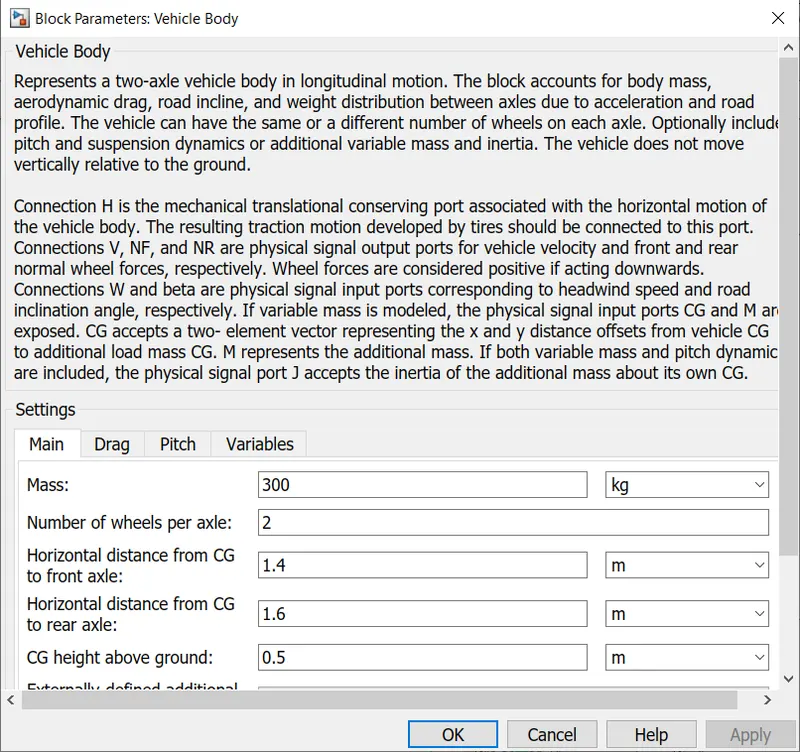
- The gross weight is given to be 800Kg
The geometric paramerters of the vehicle is given as
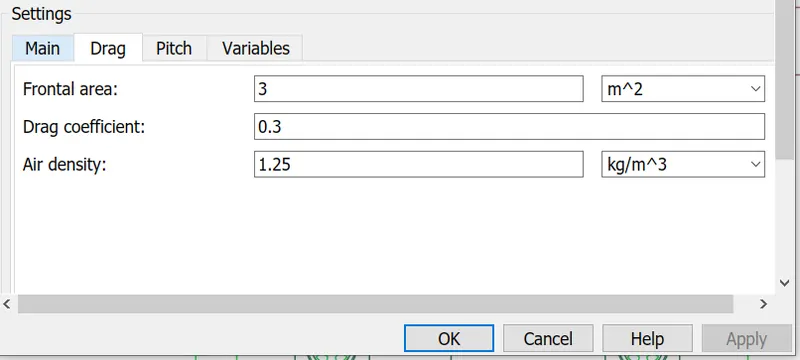
To be account for proper drag force on the vehicle, the related parameters are kept as
The pitch dynamics for the vehicle are not considered for this simulation
Simple Gear
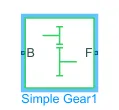
- The Simple Gear block represents a gearbox that constrains the connected driveline axes of the base gear, B, and the follower gear, F, to corotate with a fixed ratio that you specify. You choose whether the follower axis rotates in the same or opposite direction as the base axis. If they rotate in the same direction, the angular velocity of the follower, ωF, and the angular velocity of the base, ωB, have the same sign. If they rotate in opposite directions, ωF and ωB have opposite signs.
The input for this subsystem is taken as the Rotational speed of the motor.
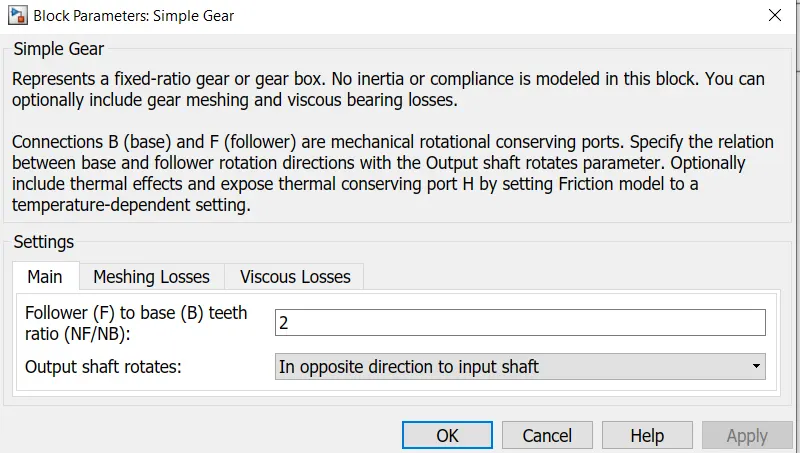
And here the rotational direction of the output shaft is kept as the same as the input shaft. Also, no meshing losses are considered for the simulation.
Inertia:
A concrete block which serves as a base for mechanical equipment such as fans or pumps; the block is mounted on a resilient support to reduce the transmission of vibration to the EV structure.
The complete subsystem is shown below
DC Motor:
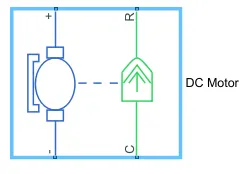
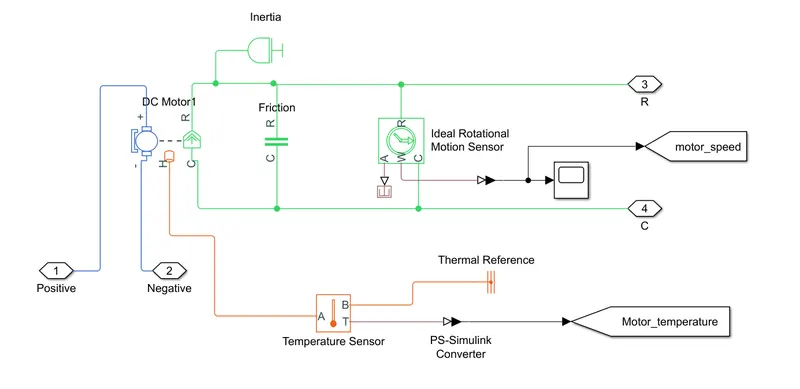
- Simulink Provides an inbuilt model block for a DC motor which converts electrical input into mechanical rotational output.
- Note the blue colour corresponds to the electrical side of the motor and the green colour corresponds to the mechanical side
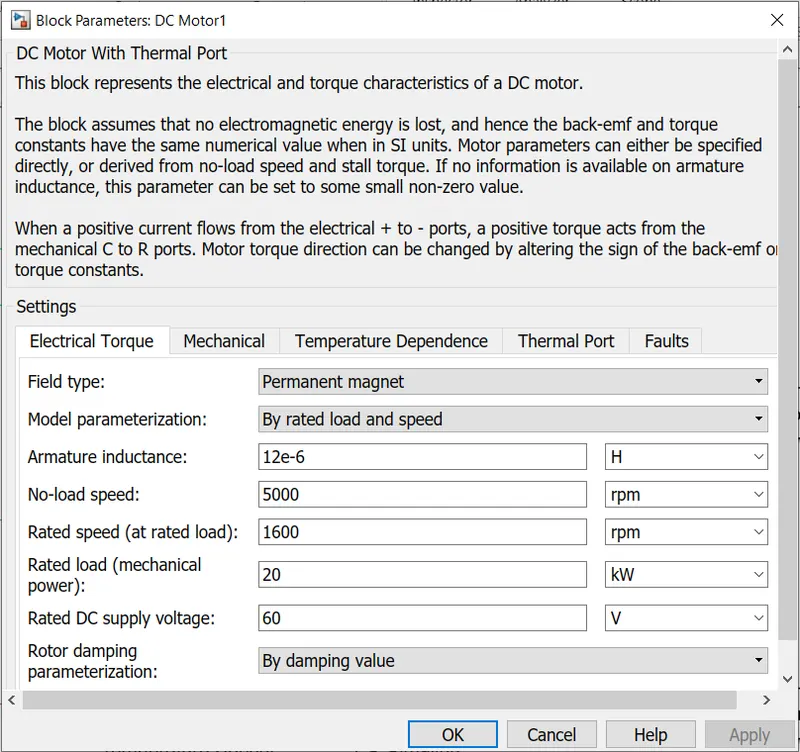
- Here thr motor field type is kept as Permanent magnet and the model parameterization is done by ratedd load and speed. The armature inductance and the mechanical parameters are given as their default values.
All the other parameters are changed as shoen in below.
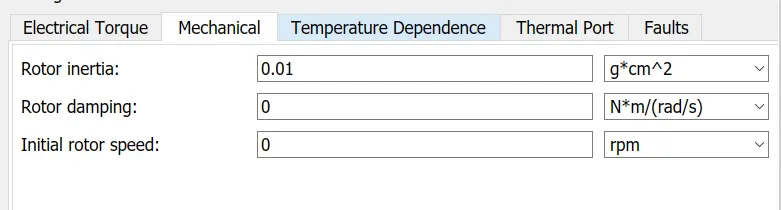
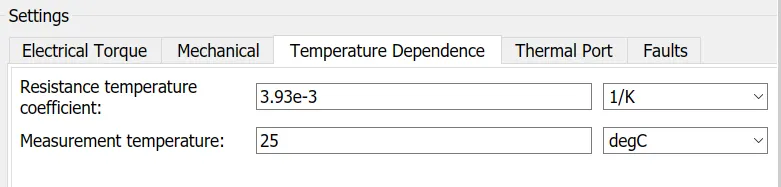
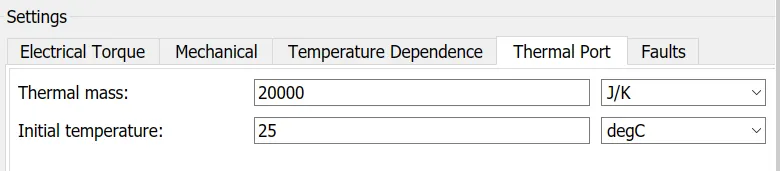
- The connection R represent the Rotor while the connection C is for Casting (stationary).Thus, the R port is connected to the input of the vehicle subsystem created earlier. The C port is connected to a mechanical rotational reference.
- The + and - ve terminal of the motor are connected to the motor controller. If these terminals are directly connected to a battery the required DC motor will run on the rated capacity of the battery. This will eventually resulta into no control over the DC motor and the vehicle will run at the top speed through out the simulation.
We consider the Inertia and the Friction and also the Temperature Sensor.
Motor Controller:
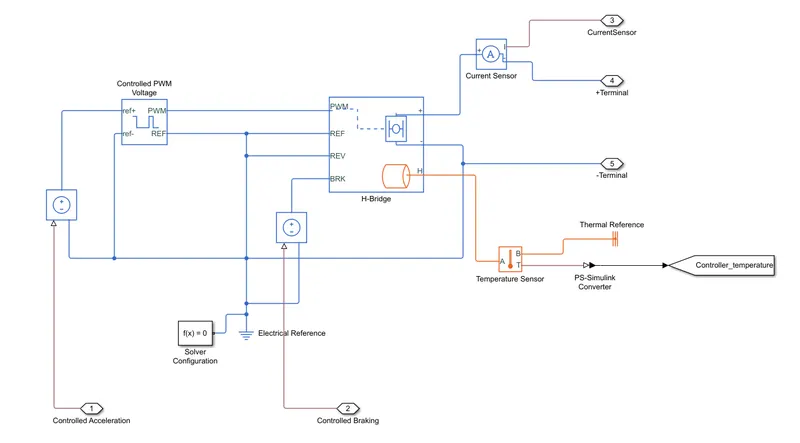
H-Bridge circuit:
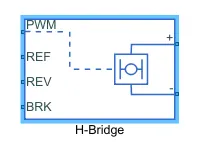
The H-Bridge block represents an H-bridge motor driver. The block has the following two Simulation mode options:
-
PWM— The H-Bridge block output is a controlled voltage that depends on the input signal at the PWM port. If the input signal has a value greater than the Enable threshold voltage parameter value, the H-Bridge block output is on and has a value equal to the value of the Output voltage amplitude parameter. If it has a value less than the Enable threshold voltage parameter value, the block maintains the load circuit using one of the following three Freewheeling mode options:-
Via one semiconductor switch and one freewheeling diode -
Via two freewheeling diodes -
Via two semiconductor switches and one freewheeling diode
The first and third options are sometimes referred to as synchronous operation.
The signal at the REV port determines the polarity of the output. If the value of the signal at the REV port is less than the value of the Reverse threshold voltage parameter, the output has positive polarity; otherwise, it has negative polarity.
-
-
Averaged— This mode has two Load current characteristics options:-
Smoothed -
Unsmoothed or discontinuous
-
The block can be driven by the controlled PWM Voltage block in PWM or Averaged mode.
- In PWM mode, the motor is powered if the PWM port voltage is above the enabled threshold voltage.
- In Averaged mode, the PWM port voltage divided by the PWM signal amplitudes parameter defines that the ratio of on time yo the PWM period.
- Connection REF is for the Reference input. This combined with the Pwm connected will form the pulse input for the H Bridge.It is Electrical Reference
- Connection REV corresponds to the reverse motion of the motor which essentially means, the backward motion of the vehicle. Here the backward motion of the vehicle is not accounted for and so the port is connected to the electrical reference.
- Connection BRK is for the braking the Vehicle
- The PWM mode results in a huge amount of simulation time. Averaged mode is selected for this simulation.
- Load current characteristics are considered to be smoothed here.
- The regenerative braking is enabled for the simulation. This means when the vehicle starts decelerating corresponding amount of charge will be fed back to the battery.
- BRK input is connected to a controlled Voltage Source. This will generate emf corresponding to the intensity of brakes applied and fed the power back to the battery.
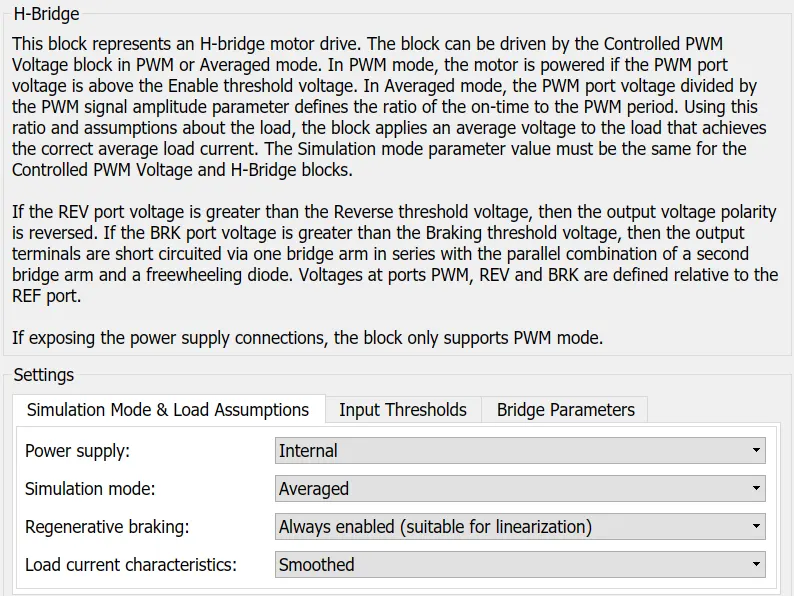
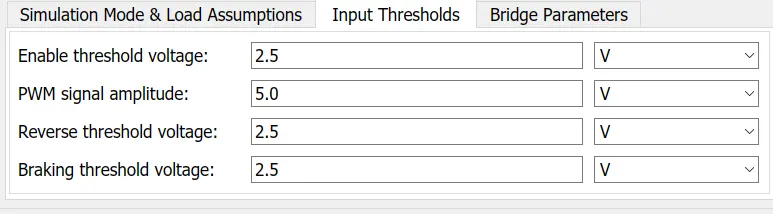
The Input Threshold Parameters are left with their default values.
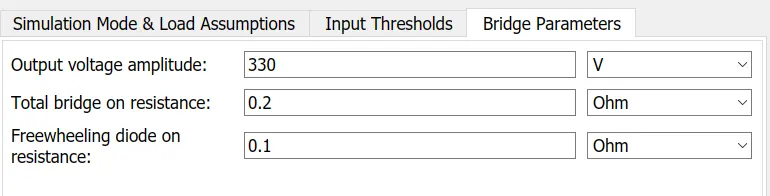
Output Voltage Amplitude of the H-Bridge circuit is given the same value as the rated DC supply Voltage of the DC motor.
Controlled PWM Voltage block
Simulink provides an inbuilt Controlled PWM Voltage block. This block is used for providing the proper pulse input to the block
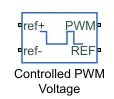
The Controlled PWM Voltage block represents a pulse-width modulated (PWM) voltage source.
-
Electrical input ports — The block calculates the duty cycle based on the reference voltage across its ref+ and ref- ports. This modeling variant is the default.
-
PS input — Specify the duty cycle value directly by using an input physical signal port.
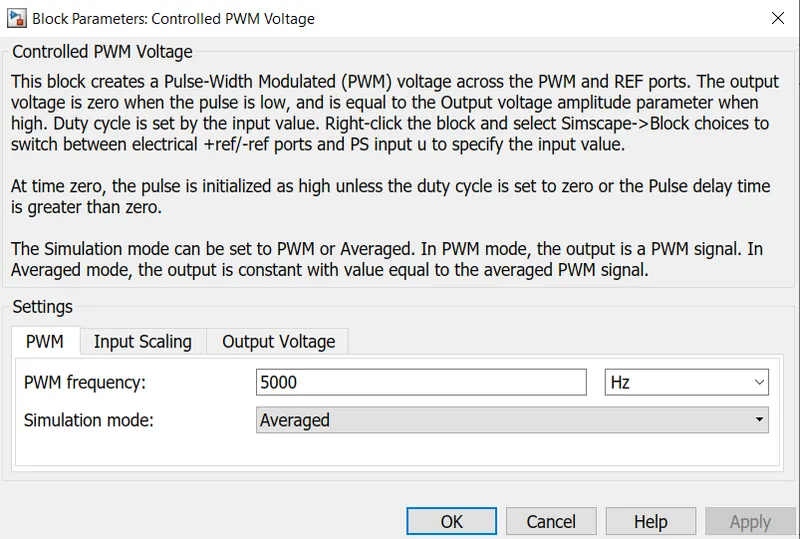
The PWM and REF connection are for the corresponding ports on the H-Bridge Circuit.The two reference inputs corresponds to the throttle inputs given by the driver.The block generates corresponding pulse width as per the acceleration and brakes applied by the driver himself.Here the PWM frquency is 4000Hz. Also the simulation mode is Averaged as that in the H-Bridge circuit.
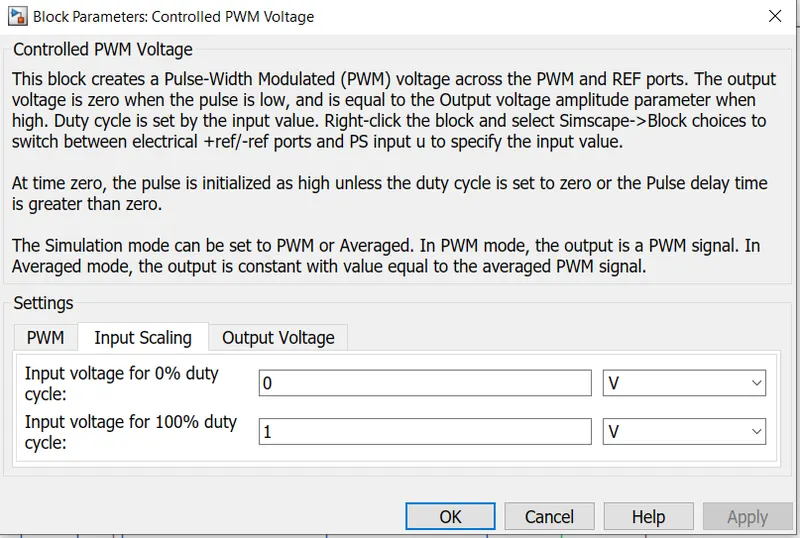
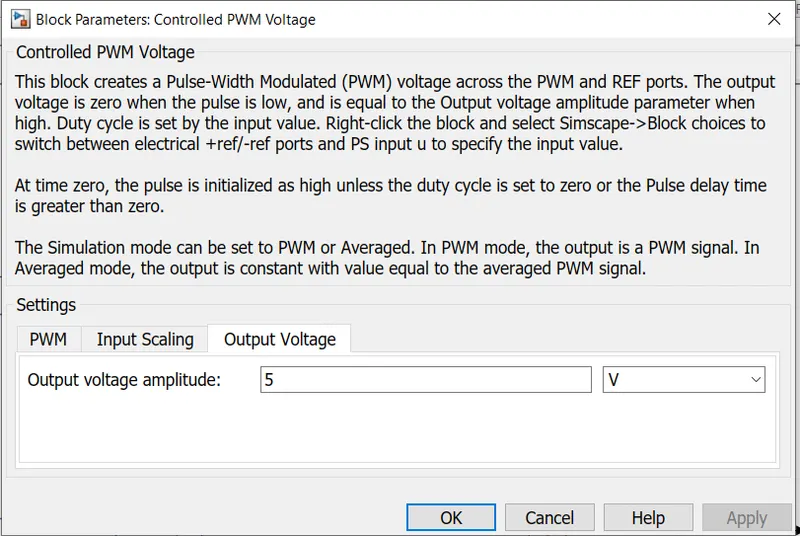
The input Scaling Parameters given are
- 0V for 0% duty cycle and 5V for 100% duty cycle. So the output voltage amplitudes becomes 5V.
The H-Bridge circuit along with the PWM input, together form the motor controller circuit.
Entire controller subsystem:
Longitudinal Driver:
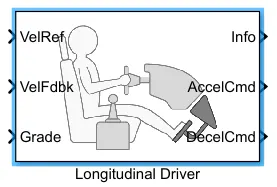
- The Longitudinal Driver block implements a longitudinal speed-tracking controller. Based on reference and feedback velocities, the block generates normalized acceleration and braking commands that can vary from 0 through 1. You can use the block to model the dynamic response of a driver or to generate the commands necessary to track a longitudinal drive cycle.
- It is an inbuilt block provided by the Powertrain Blockset.
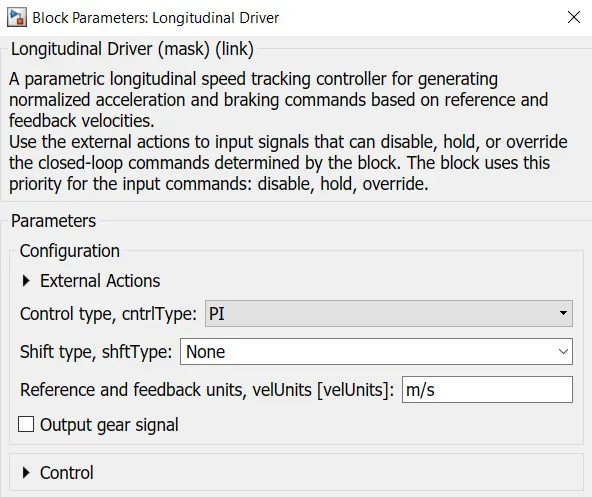
- It is parametric longitudinal speed tracking controller for generating normalized Acceleration and Braking commands based on the reference and feedback velocities.
- The VelRef port is the reference velocity port where the input drive cycle data is fed.
- The VelFdbk port corresponds to the feed back velocity. The actual Velocity output given by the vehicle body is connected here. By comparing the actual (feedback) velocity with the reference velocity, the driver block generates acceleration and braking signals in order to minimise the error between the two concerned velocities.
- Grade corresponds to the grade angle. For this simulation, no inclination is considered and hence a constant block with value 0 is connected.
- Info gives the output for thr bus signale for thr different block calculationa like difference in reference vehicle speed and Vehicle speed etc.,
Here the selected control type is PI .Accordingly the block implements PI control with tracking windup and feed forward gains.
Temperature Sensor block:
The Temperature Sensor block represents an ideal temperature sensor, that is, a device that determines the temperature differential measured between two points without drawing any heat.
Connections A and B are thermal conserving ports that connect to the two points where temperature is being monitored. Port T is a physical signal port that outputs the temperature differential value.
The block positive direction is from port A to port B. The measured temperature is determined as T = TA – TB.
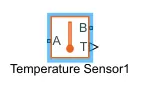
The block has the following ports:
- A -Thermal conserving port associated with the sensor positive probe.
B -Thermal conserving port associated with the sensor negative probe.T -Physical signal output port for temperature
Battery:
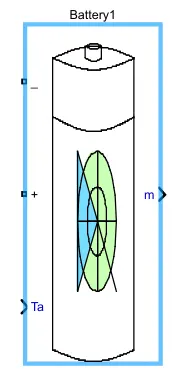
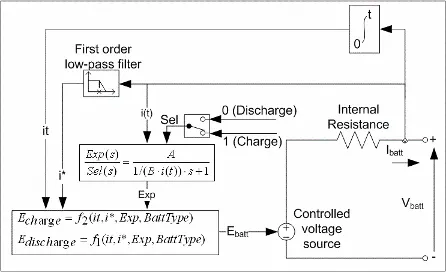
The Battery block implements a generic dynamic model that represents most popular types of rechargeable batteries.
This figure shows the equivalent circuit that the block models.
The instrumented variants have an extra physical signal port that outputs the internal state of charge. Use this functionality to change load behavior as a function of state of charge, without the complexity of building a charge state estimator.
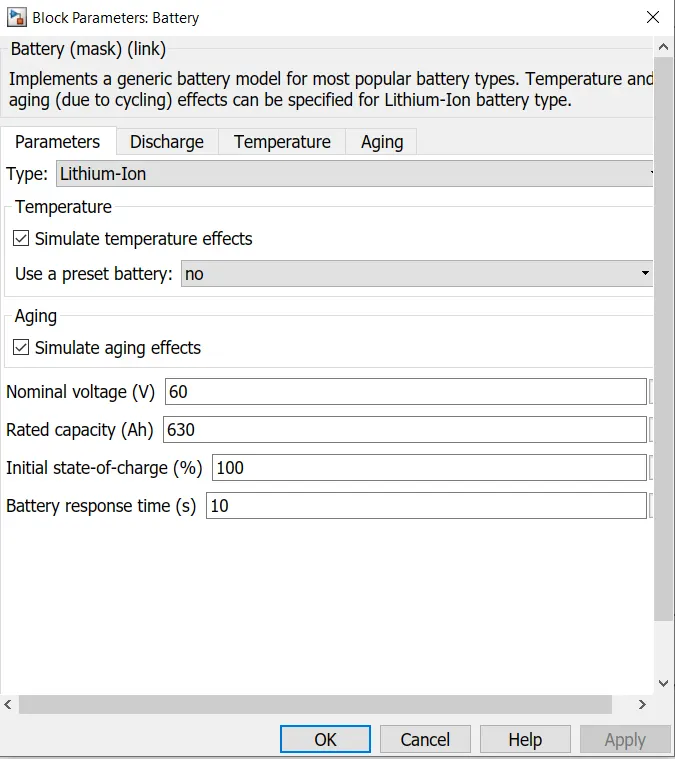
- To model the Battery Pack a simple Battery block is used this is because of the generic block is used instead the simulation will run for a much longer time.
- Here the selected option for Battery charge capacity is Finite. Accordingly, the block models the battery as a series internal resistance plus a charge-dependent Voltage source.
- If the chosen option had been Infinite the Voltage source would have been constant.
- Also the self - discharging of the battery and the battery dynamica are disabled.
- The Battery Nominal Voltage is given as 60V.
- The Ampere - hour rating is assumed to be 630.
- The rest all Parameters are left with the default values.
Charge and Discharge Characteristics:
The circuit parameters can be modified to represent a specific battery type and its discharge characteristics. A typical discharge curve consists of three sections.
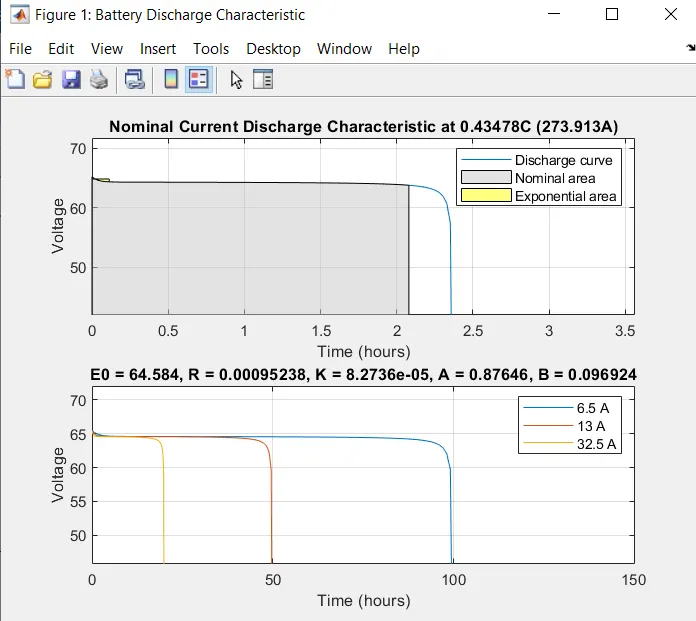
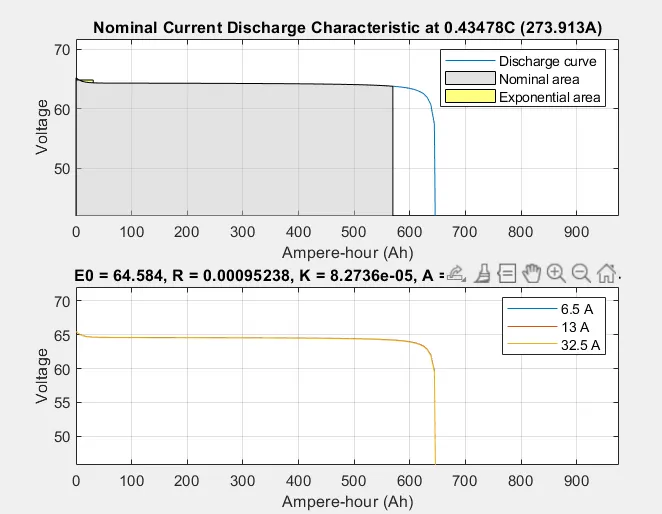
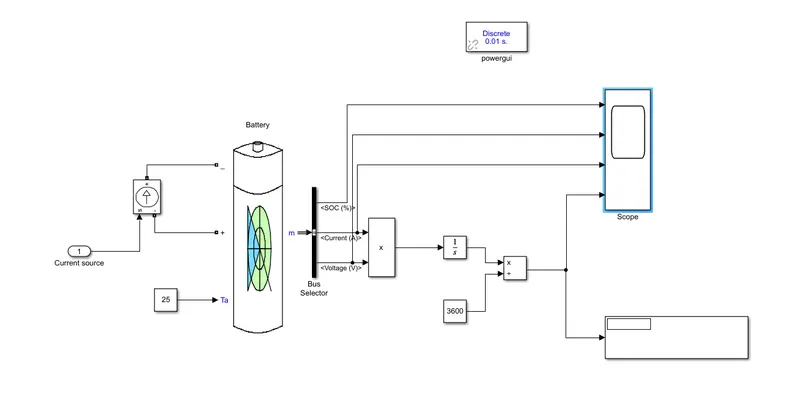
To ensure the Battery Supplies current as per the requirements of the motor controller and not the rated current, a current sensor and controlled current source pair is connected.
Battery State of Charge:
This subsystem takes the battery current as the input.
- The essential process to calculate the SOC is by subtracting the charge from the rated capacity of the battery.
- Accordingly the current is integrated with respect to time to get the charge in coulombs.Now this Coulomb value is modified into Ampere hours.
- This Value is now subtracted from the charging capacity of the battery i.e, 630Ah
- Finally the remaining charge is now converted into percentage value of the charging capacity of the battery.
Entire Model of the Battery Model:
Reference Velocity(Drive Cycle):
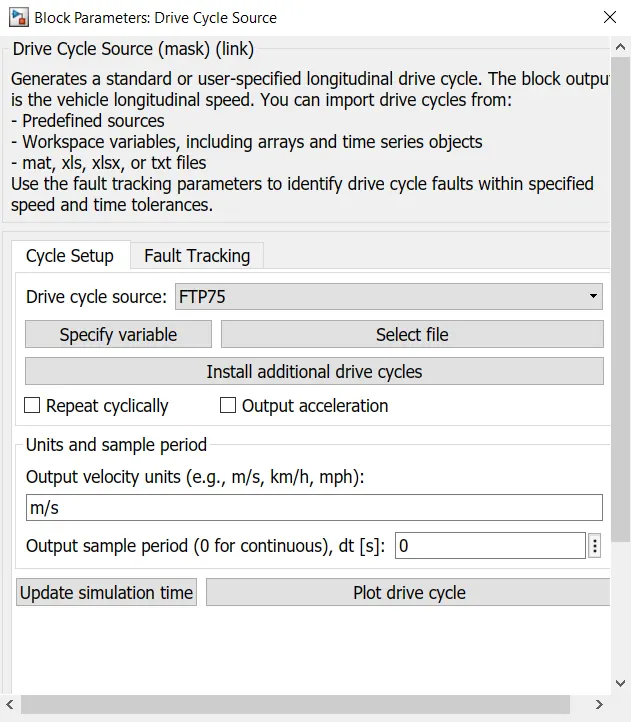
- The Drive cycle source block is used to provide the reference speed for the simulation.
- It generates is a standard or user-specified longitudinal drive cycle.
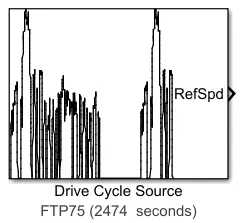
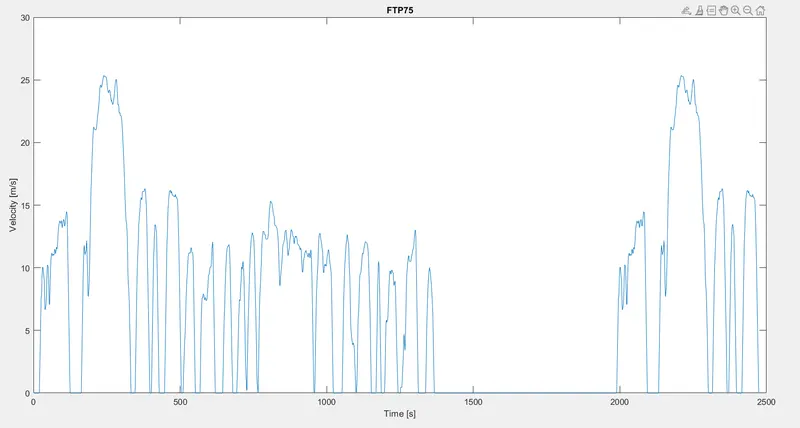
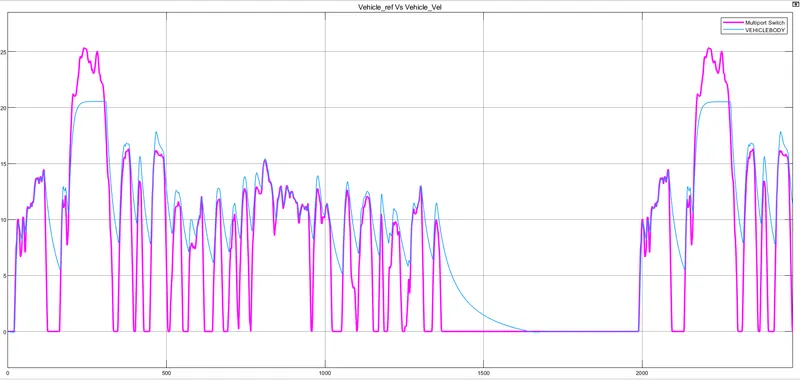
Here, the selected drive cycle is the standard FTP75.
The plot of the drive cycle is shown below
Signal Builder:
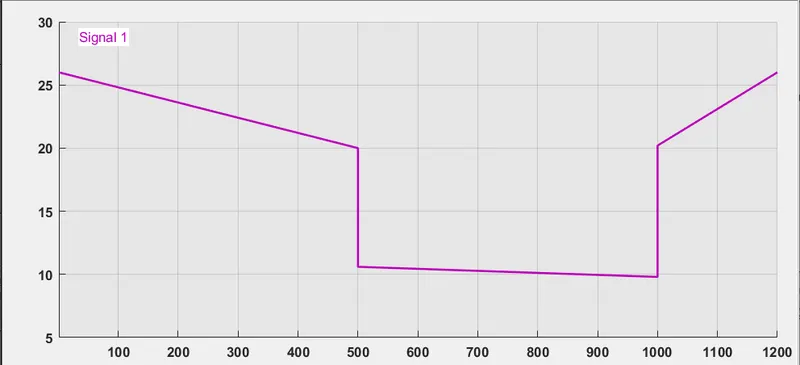
- The Signal Builder block allows you to create interchangeable groups of piecewise linear signal sources and use them in a model. You can quickly switch the signal groups into and out of a model to facilitate testing. In the Signal Builder window, create signals and define the output waveforms.
- Signal generate waveform for road inclination angle (Beta) and wind and we send the information to the Vehicle Body.
Multiport Switch:
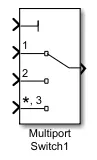
Multiport Switch block determines which of several inputs to the block passes to the output. The block bases this decision on the value of the first input. The first input is the control input and the remaining inputs are the data inputs. The value of the control input determines which data input passes to the output.
Complete Reference Model:
Simulink Model:
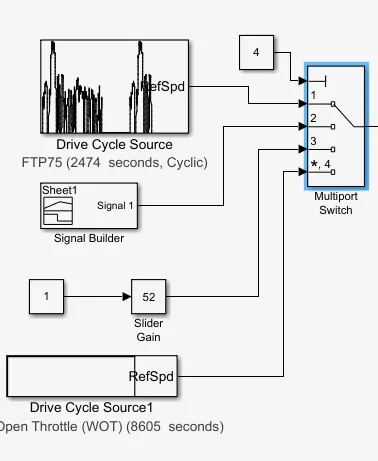
- In this model we use three different drive cycle like WTO, FTP75 and also through Signal Builder.
- The Controller will follow the given drive cycle reference and run the motor is the required rpm.
- The Current flows to DC Motor from the battery through the DC-DC Power Converter to the drive the motor.The required Voltage will be controlled in the Controller.
- Then the motor power is transmitted to the wheels of a vehicle through the gearbox, the controller will take the vehicle speed and the speed of the vehicle is as given in the drive cycle.
CASES:
1)Run the model on FTP75 drive cycle and get the result.
2)Run the model on WOT and get the result.
3)Run the model for our own Drive cycle.
4)We want around 100Km distance with constant speed of 45Kmph.
- Run the model on only change in the input for the above condition and get the result.
- Run the model on changing all the parameters like a battery, Motor Parameter.
Results:
1)Run the model on FTP75 drive cycle and get the result.
FTP75 Drive Cycle:
- The EPA Federal Test Procedure, commonly known as FTP-75 for the city driving cycle are a series of tests defined by the US Environment Protection Agency (EPA) to measure tailpipe Emission and fuel economy of Passenger Cars.
- The testing was mandated by the Energy Tax Act in order to determine the rate of the guzzler tax that applies for the sales of new cars.
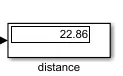
- By running the Vehicle with the FTP75 drive cycle for 2474sec the distance travelled is 22.86Km
SOC, VOLTAGE, CURRENT, ENERGY:
Graph as shown below for the FTP75 drive cycle which is run for 2474second.
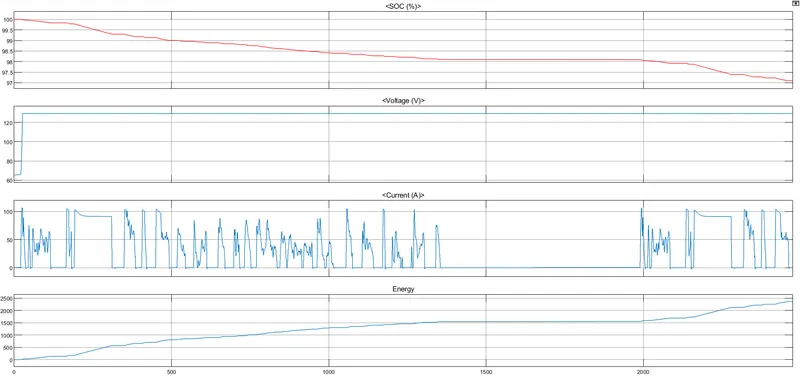
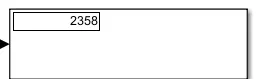
The state of charge decrease from 100 to 97 because it has a high battery capacity and the Energy Consumed is around 2358 and also Voltage and current are shown in above graph.
Energy Consumption:
Graph as shown below for the FTP75 drive cycle which can run is for 2474 seconds
Controller temperature, Motor Temperature, Distance, Motor Speed:
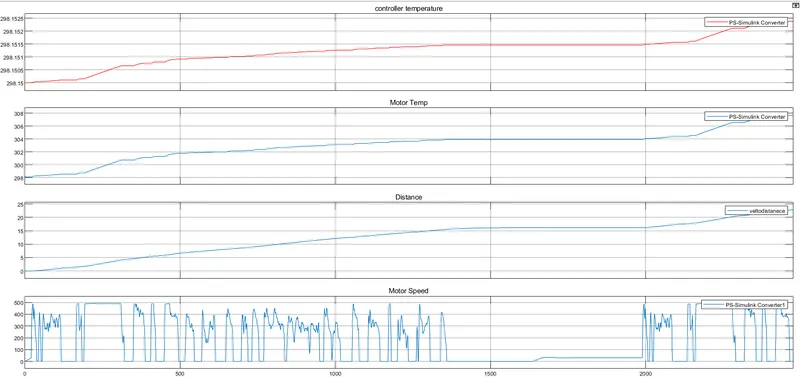
The motor temperature is increased from 204 to 304 and the Temperature rise some what acceptable if it is high coolant will be provided and the controller temperature rise from 298.15 to 298.1525 it is some what maintain constant and the distance covered by the vehicle is 22.86km
Distance travelled by the Vehicle
- The actual Speed is approximately followed by the 90% of the reference Drive Cycle.
- Energy consumed by the battery is 2358 at the end of the cycle.
- The SOC% of the battery is reduced to 97
- The Temperature of the Motor is Increased to 308
- The Temperature of the Controller is 298.15
- Distance travelled by the Vehicle is 22.86
2)Run the model on WOT and get the result.
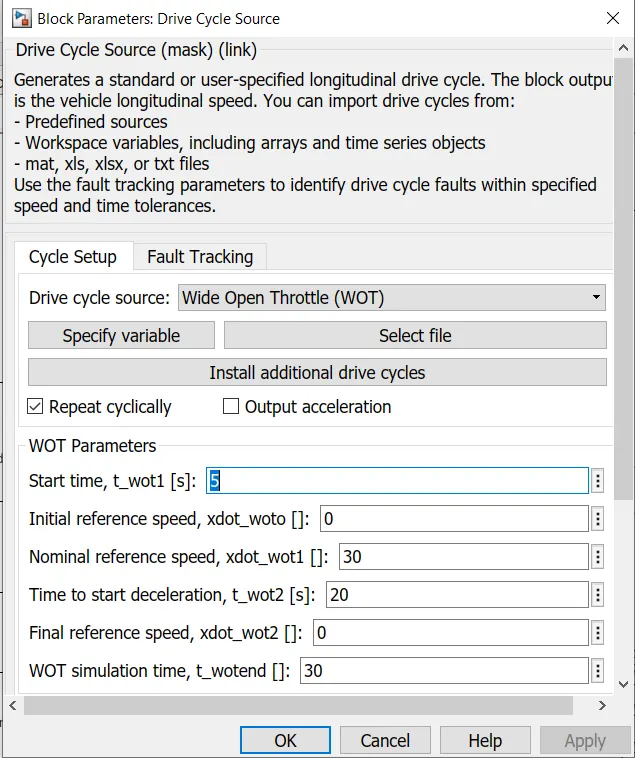
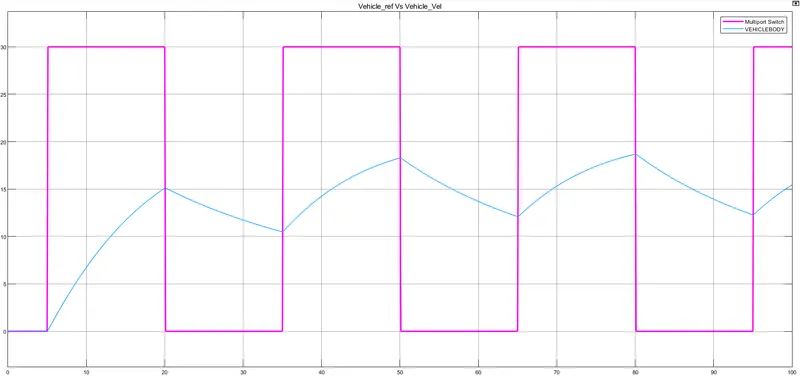
As we run the model on the FTP75 input and get them all result , but noe we were being run the model for input wide open throttle(WOT) and check how our model behaves and get the result for WOT input with tunned PID gain Value and the desirable other Parameters.
Wide Open throttle(WOT):
- It also called full throttle is the fully opened state of the throttle engine (internal combustion engine or steam engine). In a Electric Vehicle, WOT condition refers to the initial Acceleration or the time taken by the vehicle to reach the maximum velocity. The maximum Velocity in WOT conditions can be obtained by the electric motor characteristics of an electric vehicle.
- A model with WOT input and simulation is 90sec.
WOT:
Result:
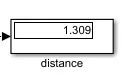
By running the Vehicle with the WOTdrive cycle for 90sec the distance travelled is 1.309Km
SOC, VOLTAGE, CURRENT, ENERGY:
Graph as shown below for the WOTdrive cycle for 90sec
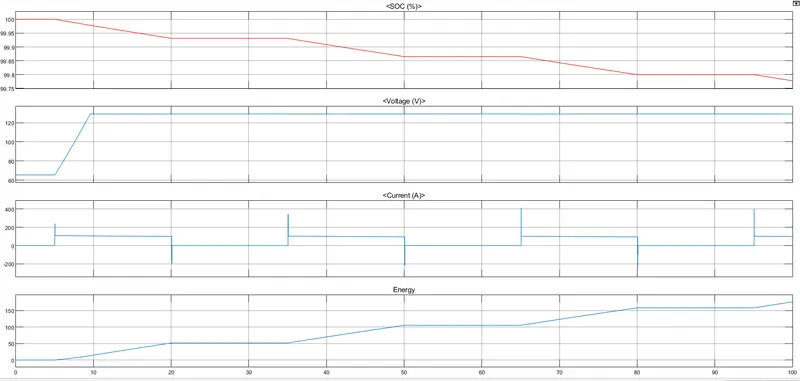
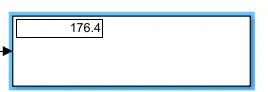
The state of charge decrease from 100 to 99.75 because it has a high battery capacity and the Energy Consumed is around 176.4 and also Voltage and current are shown in above graph
Energy Consumption:
Graph as shown below for the WOTdrive cycle for 90sec
Controller temperature, Motor Temperature, Distance, Motor Speed:
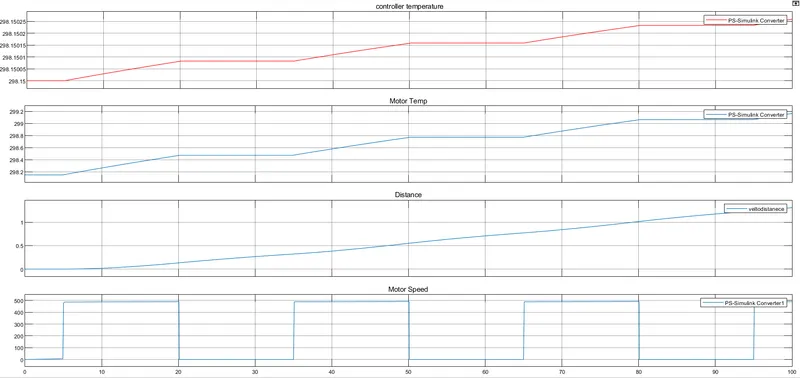
The motor temperature is increased from 298 to 299.2 and the Temperature rise some what acceptable if it is high coolant will be provided and the controller temperature rise from 298.15 to 298.1525 it is some what maintain constant and the distance covered by the vehicle is 1.309km
Distance Travelled by the Vehicle:
- The actual Speed is approximately followed by the 85% of the reference Drive Cycle.
- Energy consumed by the battery is 176.8 at the end of the cycle.
- The SOC% of the battery is reduced to 99.75
- The Temperature of the Motor is Increased to 299.2
- The Temperature of the Controller is 298.15
- Distance travelled by the Vehicle is 1.309.
3)Create our own drive cycle
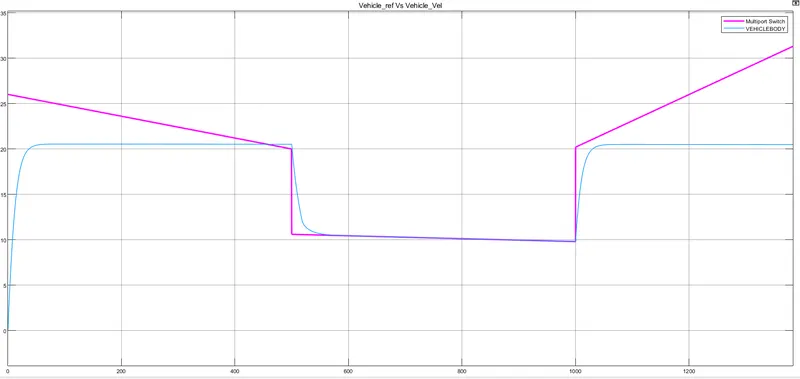
By using the signal builder block we can able to create our own drive cycle.
SOC, VOLTAGE, CURRENT, ENERGY:
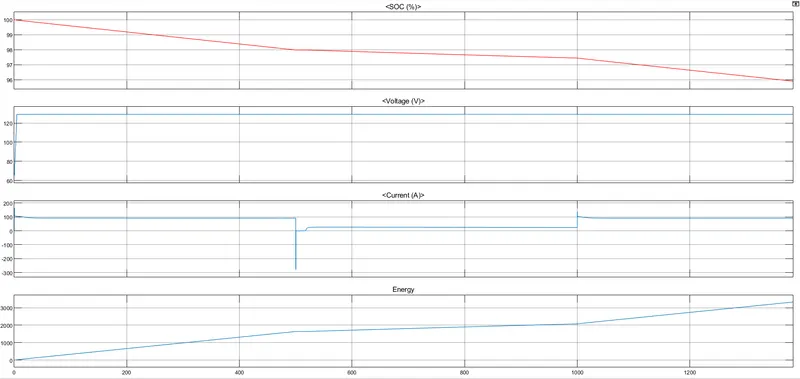
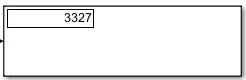
The state of charge decrease from 100 to 96 because it has a high battery capacity and the Energy Consumed is around 3327 and also Voltage and current are shown in above graph
Energy Consumption:
Controller temperature, Motor Temperature, Distance, Motor Speed:
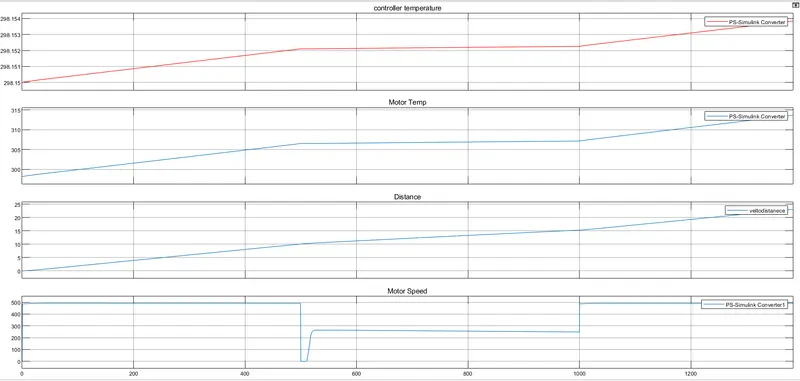
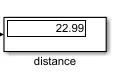
The motor temperature is increased from 298 to 315 and the Temperature rise some what acceptable if it is high coolant will be provided and the controller temperature rise from 298.15 to 298.1525 it is some what maintain constant and the distance covered by the vehicle is 22.99km
Distance Travelled by the Vehicle:
- The actual Speed is approximately followed by the 90% of the reference Drive Cycle.
- Energy consumed by the battery is 3327 at the end of the cycle.
- The SOC% of the battery is reduced to 96
- The Temperature of the Motor is Increased to 315
- The Temperature of the Controller is 298.15
- Distance travelled by the Vehicle is 22.99
4)We want around 100Km distance with constant speed of 45Kmph.
Run the model on only change in the input for the above condition and get the result.
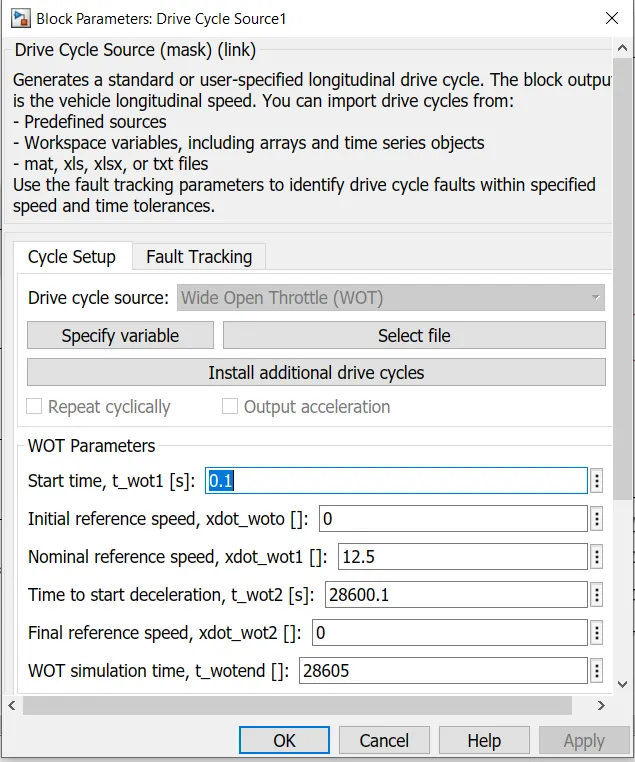
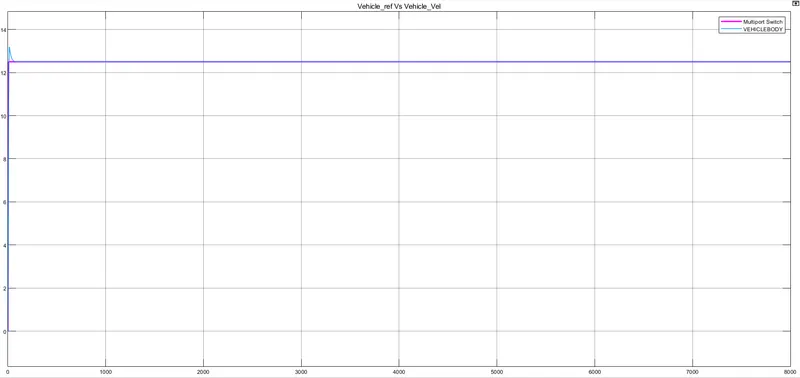
For the requirement meer, we are going to run the model for WOT but this time we give the top speed and second by calculation.By the calculation, we get that the top speed is 12.5mps and the Second required is 28600 from this value we will ger our requirement 100Km distance with constant speed of 45Kmph.
WOT Block:
SOC, VOLTAGE, CURRENT, ENERGY:
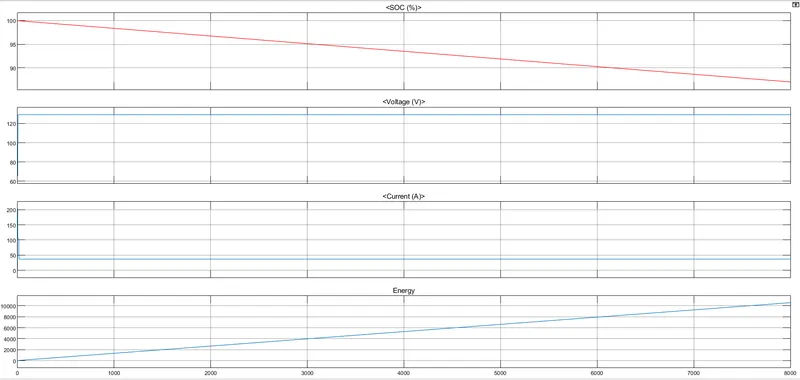
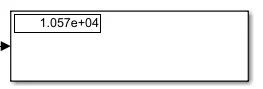
The state of charge decrease from 100 to 86 because it has a high battery capacity and the Energy Consumed is around 10570 and also Voltage and current are shown in above graph
Energy Consumption:
Controller temperature, Motor Temperature, Distance, Motor Speed:
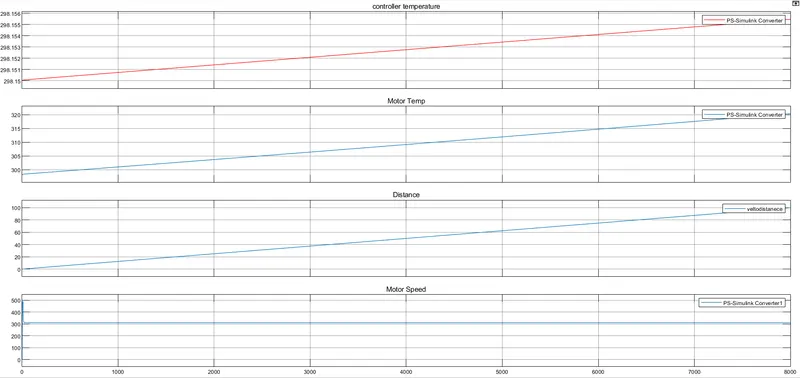
The motor temperature is increased from 298 to 320 and the Temperature rise some what acceptable if it is high coolant will be provided and the controller temperature rise from 298.15 to 298.1525 it is some what maintain constant and the distance covered by the vehicle is 100.2km
Distance Travelled by the Vehicle:
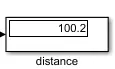
- The actual Speed is approximately followed by the 98% of the reference Drive Cycle.
- Energy consumed by the battery is 10570 at the end of the cycle.
- The SOC% of the battery is reduced to 86
- The Temperature of the Motor is Increased to 320
- The Temperature of the Controller is 298.15
- Distance travelled by the Vehicle is 100.2
Run the model on changing all the parameters like a battery, Motor Parameter.
In this method we reduce the battery capacity and also the Motor Parameters from this we get the output result.
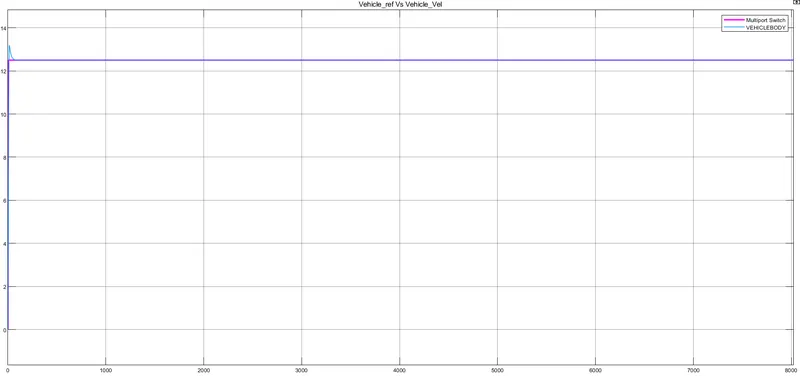
SOC, VOLTAGE, CURRENT, ENERGY:
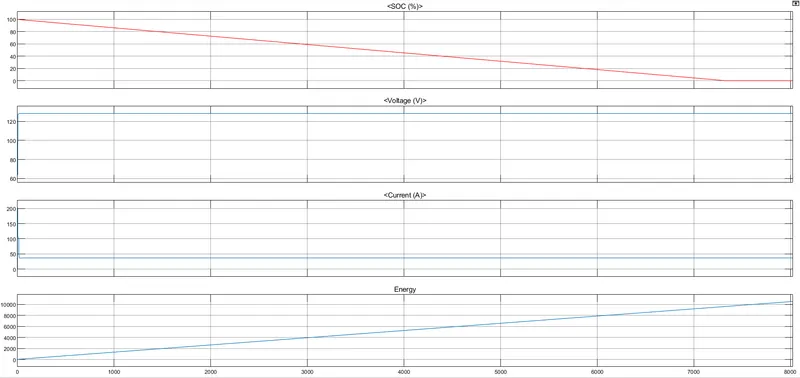
The state of charge decrease from 100 to 0 because it has a high battery capacity and the Energy Consumed is around 10520 and also Voltage and current are shown in above graph
Energy Consumption:
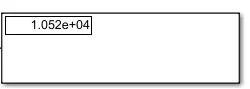
Controller temperature, Motor Temperature, Distance, Motor Speed:
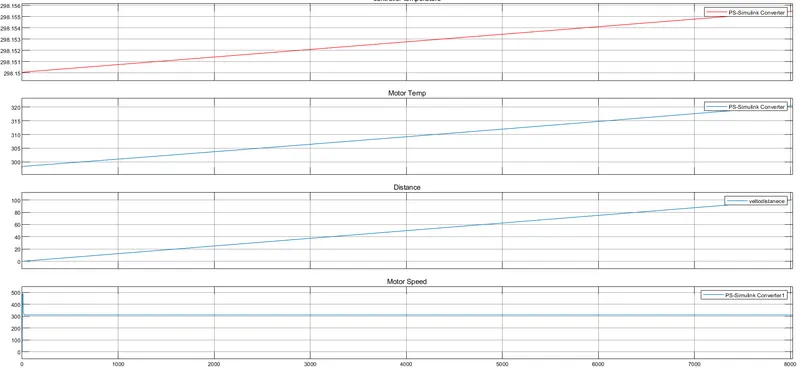
The motor temperature is increased from 298 to 320 and the Temperature rise some what acceptable if it is high coolant will be provided and the controller temperature rise from 298.15 to 298.1525 it is some what maintain constant and the distance covered by the vehicle is 98.2km
- The actual Speed is approximately followed by the 98% of the reference Drive Cycle.
- Energy consumed by the battery is 10520 at the end of the cycle.
- The SOC% of the battery is reduced to 86
- The Temperature of the Motor is Increased to 320
- The Temperature of the Controller is 298.15
- Distance travelled by the Vehicle is 100.2
The Excel Sheet is attached in below to know the calculated Result.
Conclusion:
- In this Project we compromised with the temperature of Motor and Controller to achieve Vehicle Speed is near to reference speeds.Since we have not used any cooling system in the model. In the real time application, the motor temperature is less than 100C.
- In the real time application the motor, battery and Controller temperature by air cooling. Hence, the temperature of this components is not increased to this extent.
- And we created a MATLAB model of an Electric Rickshaw(three wheel passenger vehicle) by using Li-ion battery. PM Brushed DC Motor.
- Determined the variation of the Temperature of Motor and Controller, Soc and the Energy consumed by the Vehicle for all the three Reference Drives Cycles.