Week 8 - Simulating Cyclone separator with Discrete Phase Modelling
Aim:- To perform analysis on cyclone separator and calculate the separation efficiency and pressure drop.
Objective:-
- To write a few words about any four empirical models used to calculate the cyclone separator efficiency.
- To perform an analysis on a given cyclone separator model by varying the particle diameter from 1 μm to 5 μm and calculate the separation efficiency in each case. Discuss the results. [Use both the velocity's as 3m/sec.]
- To perform an analysis on a given cyclone separator model by varying the particle velocity from 1 m/sec to 5 m/sec and calculate the separation efficiency and pressure drop in each case. Discuss the results. [Use particle diameter size as 5 μm for all cases & keep flow velocity same as particle velocity]
Boundary Conditions:-
Inlet and wall:- Reflect
Outlet(Top):- Escape
Outlet(Bottom/dustbin) - Trap
Theory:-
Cyclone seperator:-
Cyclone separator is a device for separate solid or liquid particles from carrier gases by centrifugal force wich exists in a stationnaries mechanical device. Cyclones separators are the most widely used for air pollution reducted devices in industries or agricultural processing , without the use of filters The cyclone separator is a highly effective and strong equipment due to the absence of moving parts, so that it can be operated in any environments.
Cyclones are the principal type of gas-solids separator employing centrifugal force, and are widely used.
Gas cyclones are widely used in industry for the separation of particles from gas and air streams. Water cyclones, also known as hydro-cyclones, are used for the separation of fluids of differing densities.
Basically simple constructions; they can be made from a wide range of materials such as cast iron, ductile iron, carbon steel, stainless steel. They are suitable for separating particles about 5 μm in diameter; smaller particles down to about 0.5 μm can be separated where agglomeration occurs.
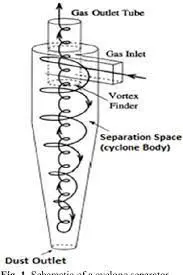
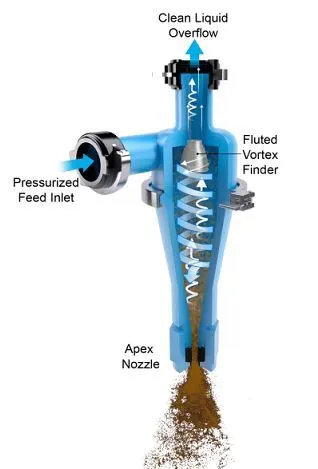
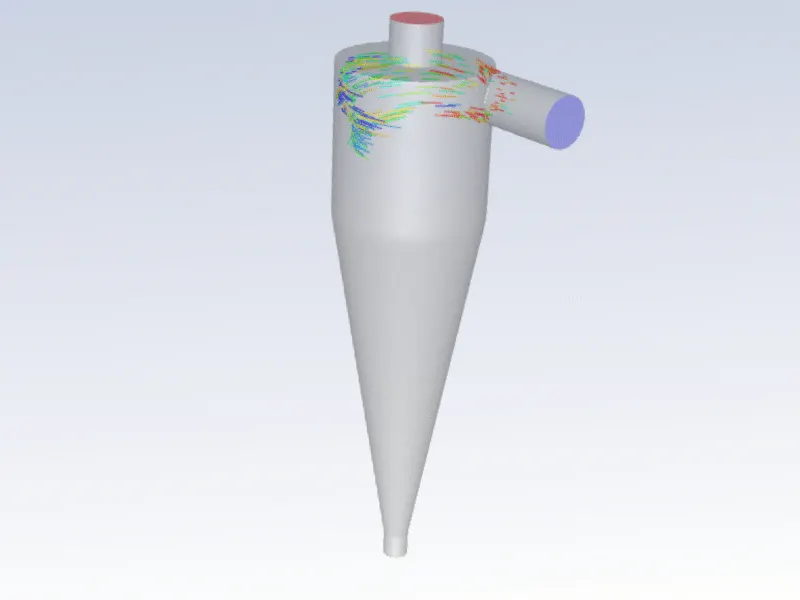
Please refer the below photo for the nomenclature and animation of Cyclone separator.
There are two main types of cyclone separators are there
- Axial- The material enters from the top of the cyclone and is forced to move tangentially by a grate at the top
- Tangential- The material enters from an inlet on the side which is positioned tangentially to the body.
The cyclone separators advantages compared with the other devices, are:
- Capital investment and maintenance cost is low.
- No moving parts.
- Very strong.
- The particles are separated remains dry and can be used again.
- Very compact to be operated.
- Can be formed from a variety of materials needed or suitable such as : casting metals, plate steel, aluminium , alloys, ceramics, plastics, etc.
- With appropriate design can separate either liquid particulates , solid particulates or even both in combination.
Besides the favorable things that there are some things less well among:
- Fluid through cyclone separator has higher pressure loss than the other separator such as scrubber or bag filters.
- Low efficiency values for very small particulate size when operated under small amount particle in the fluids.
- If the cyclone designed and operated are not properly then product is below expectations.
BASIC PRINCIPLE:
The design principle for a cyclone separator is extremely simple, yet unique. The entire process is driven by the fluid or vapor and the contaminants themselves, coupled with an applied force to pressurize the fluid or vapors.
The flow stream enters the body of the separator tangentially through the inlet at the top. The mixture of solids and fluid or vapor begins to swirl due to the circular design of the chamber and continues swirling as it begins to work its way down the funnel until it reaches the bottom. Materials that are denser than the carrier medium are separated from the stream during this downward flow and can be removed through the outlet at the bottom of the cone.
As the mixture is circulating down the funnel it creates a "whirlpool effect" in the middle of the cone. This causes a vortex in the center of the cone through which the lighter flow stream rises.
As the fluid or vapor reaches the top of the vortex, it is passing by the difference in pressure through a tube that sticks down into the center of the funnel. This tube is called a vortex finder. This is needed so that the vortex fluid will not mix with the incoming mixture of fluid and pollutants. It is necessary that the end of the vortex finder extend below the feed inlet to reduce premature exit of the overflow. The cleaned fluid or vapor is then either expunged into the atmosphere or returned to the system for reuse.
The cyclone utilizes the energy obtained from fluid pressure to create rotational fluid motion. This rotational motion causes the materials suspended in the fluid to separate from one another or from the fluid quickly due to the centrifugal force. The rotation is produced by the tangential or involuted introduction of fluid into the vessel.
DESIGN:
The cyclone consists of a vertical cylinder with a conical bottom. Cyclone separators have no moving parts. The cylindrical part is closed at the top by a cover, through which the liquid overflow pipe, known as the vortex finder, extends some distance into the cyclone body. Located near the top cover is either a circular or rectangular feed opening where liquid enters the cyclone separator through the tangential inlet. The underflow leaves through a hole in the apex of the cone.
APPLICATIONS:
Cyclone separator is used in :
- For removal of dust particles from emissions from cotton gins, grain elevators, tractors, grain mixers, and other agricultural machinery.
- In the food industry for the separation of agglomerated particles and for the separation of starch and protein.
- For cleaning flue gases from Power Plants by the removal of particulate material.
- For the classification of solids based on size or density
They are frequently used as protection or pre-treatment devices to improve the performance or decrease the cost of down stream equipment. The target industries include mineral processing, mining, petrochemicals, oil production, waste water and effluent treatment, food processing and pharmaceuticals.
CYCLONE EFFICIENCY EMPIRICAL MODELS:
1) IOZIA AND LEITH MODEL:
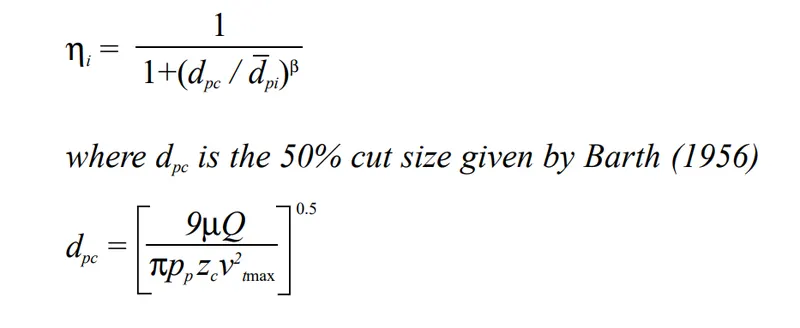
Iozia and Leith (1990) logistic model is a modified version of Barth (1956) model which is developed based on force balance. The model assumes that a particle carried by the vortex endures the influence of two forces: a centrifugal force, Z, and a flow resistance, W. Core length, zc, and core diameter, dc, are given as
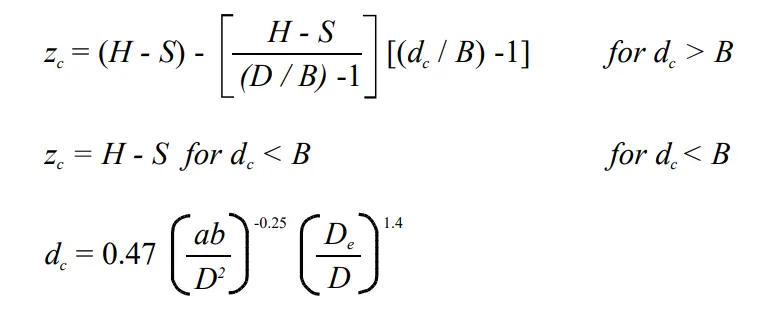
The addition made by Iozia and Leith on the original Barth (1956) model are the core length zc and slope parameter β expression which is derived based on the statistical analysis of experimental data of cyclone with D = 0.25 m. The collection efficiency ηi of particle diameter dpi can be calculated from
2) LI AND WANG MODEL:
The Li and Wang (1989) model includes particle bounce or re-entrainment and turbulent diffusion at the cyclone wall. A two-dimensional analytical expression of particle distribution in the cyclone is obtained. Li and Wang model was developed based on the following assumptions:
i) The radial particle velocity and the radial concentration profile are not constant, for uncollected particles within the cyclones.
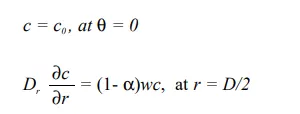
ii) Boundary conditions with the consideration of turbulent diffusion coefficient and particle bounce re-entrainment on the cyclone wall are:
iii) The tangential velocity is related to the radius of cyclone by:
uRn = constant.
The concentration distribution in a cyclone is given as:
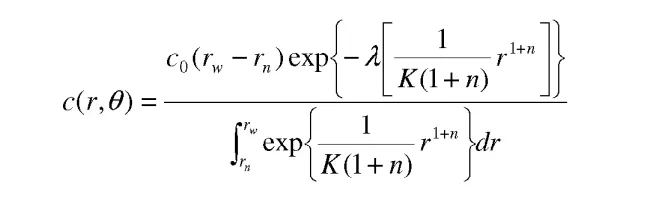
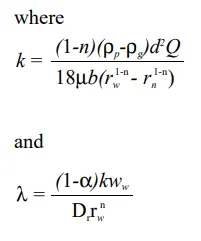
The resultant expression of the collection efficiency for particle of my size is given as
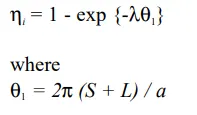
3) KOCH AND LICHT MODEL:
Koch and Licht (1977) collection theory recognized the inherently turbulent nature of cyclones and the distribution of gas residence times within the cyclone. Koch and Licht describe particle motion in the entry and collection regions with the additional following assumptions:
i) The tangential velocity of a particle is equal to the tangential velocity of the gas flow, i.e. there is no slip in the tangential direction between the particle and the gas.
ii) The tangential velocity is related to the radius of cyclone by:
uRn = constant.
A force balance and an equation on the particles collection yields the grade efficiency ηi
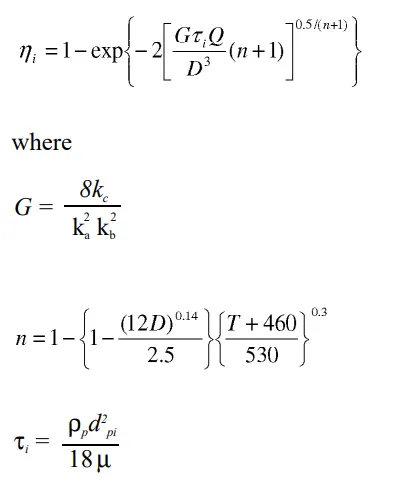
G is a factor related to the configuration of the cyclone, n is related to the vortex and τ is the relaxation term.
4) LAPPLE MODEL:
Lapple (1951) model was developed based on force balance without considering the flow resistance. Lapple assumed that a particle entering the cyclone is evenly distributed across the inlet opening. The particle that travels from inlet half width to the wall in the cyclone is collected with 50% efficiency. The semi empirical relationship developed by Lapple (1951) to calculate a 50% cut diameter, dpc, is
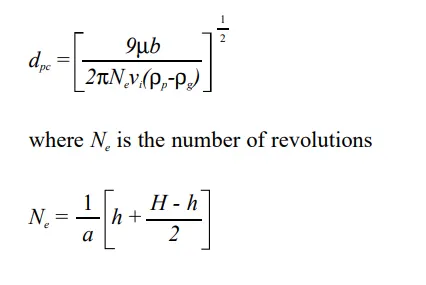
The efficiency of collection of any size of particle is given by
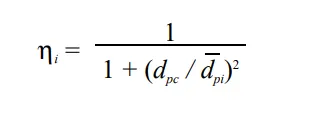
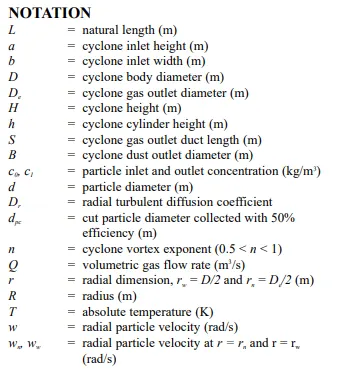
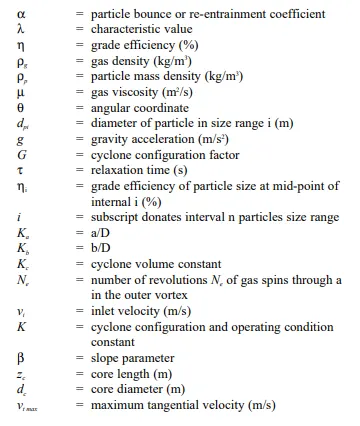
Following are the notations used in all the above equations.
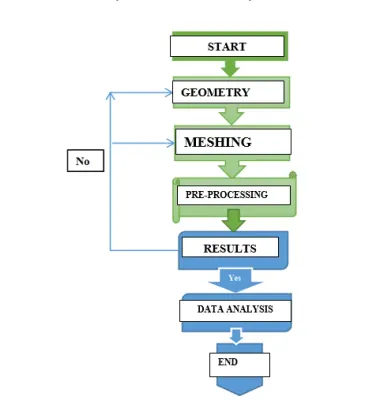
Please refer the below chart for the steps involved in the CFD solution.
Geometry Set-up:
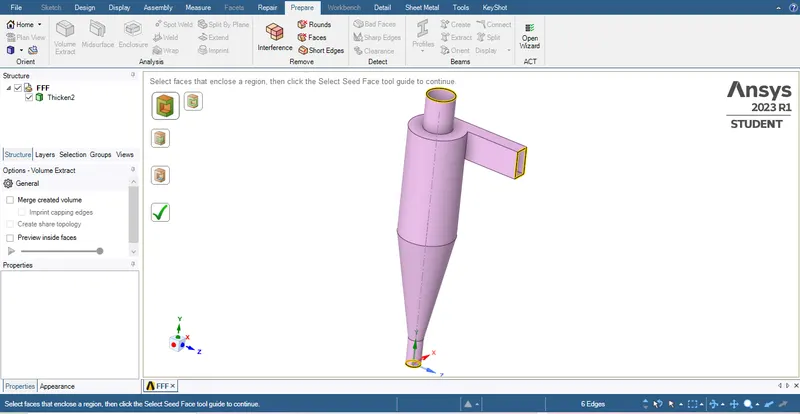
1) Import the geometry and use the volume extract tool to extract the fluid volume by selecting the egde as in the below photo.
2) Please refer the below photo for the extracted volume for simulation.
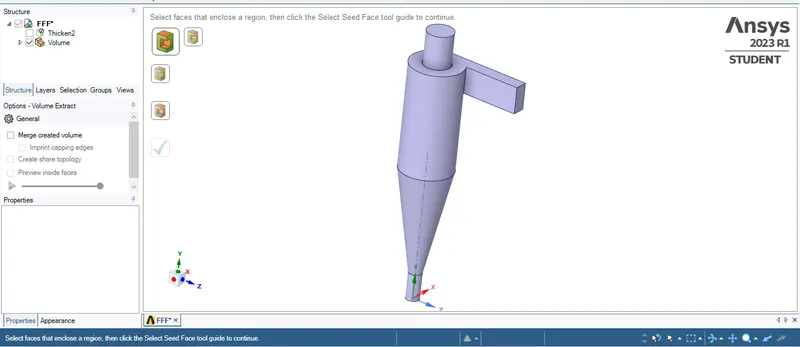
3) We are going to do the simulation in fluid volume so solid part is not required hence supress the solid body as shown below photo.
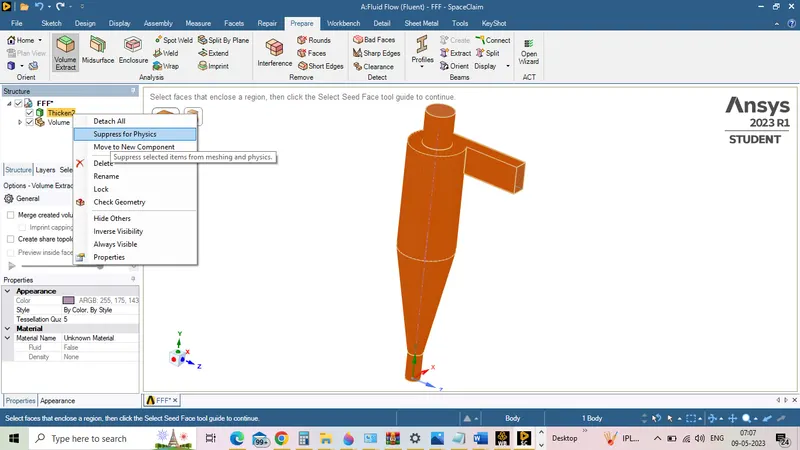
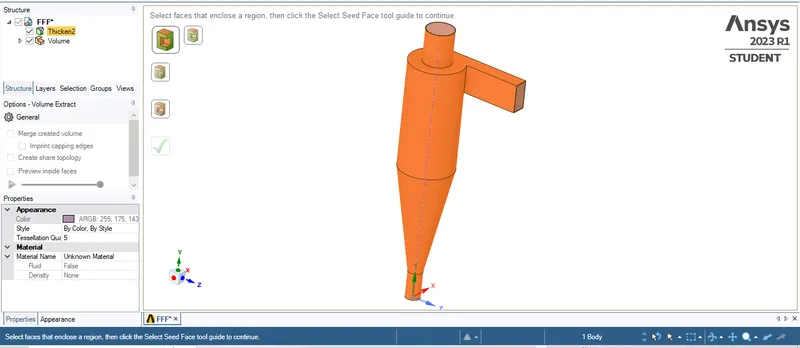
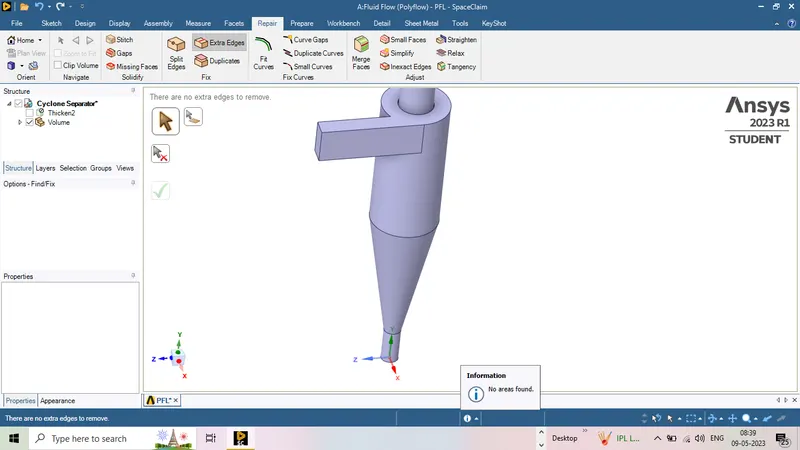
4) Please refer the below photo for the final geometry used for the simulation.
Meshing Setup
1) Nomenclature of the extracted volume as Inlet, Outlet top and Outlet Bottom shown below photo
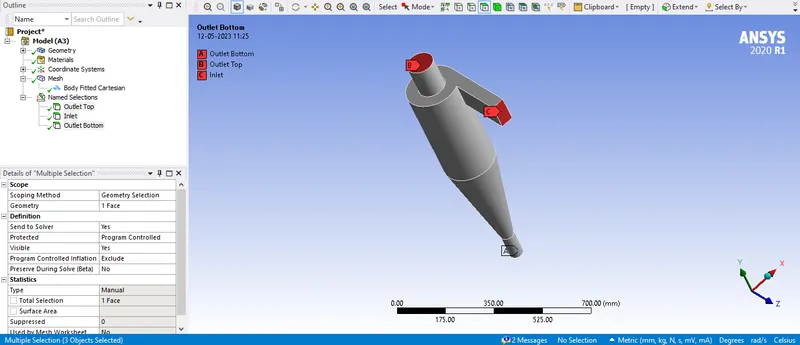
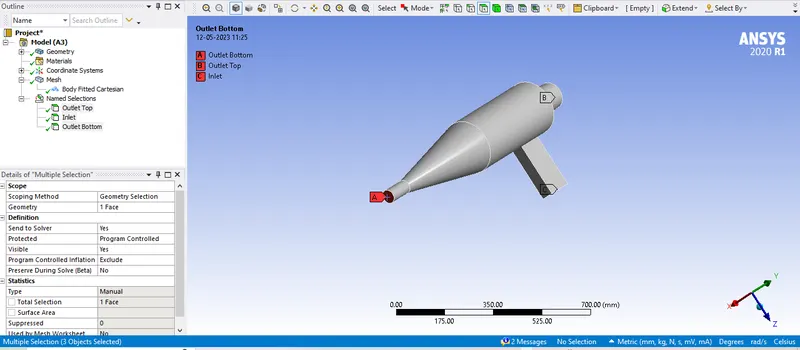
2) Cartesion method is applied as shown below photo.
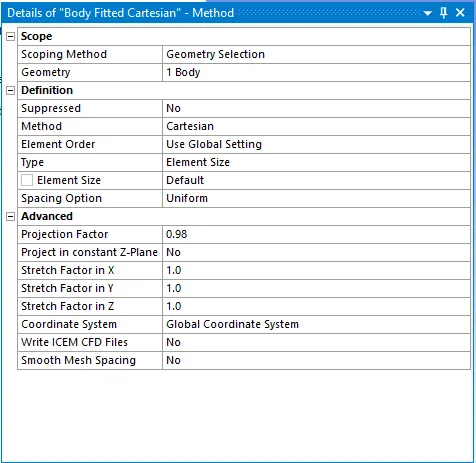
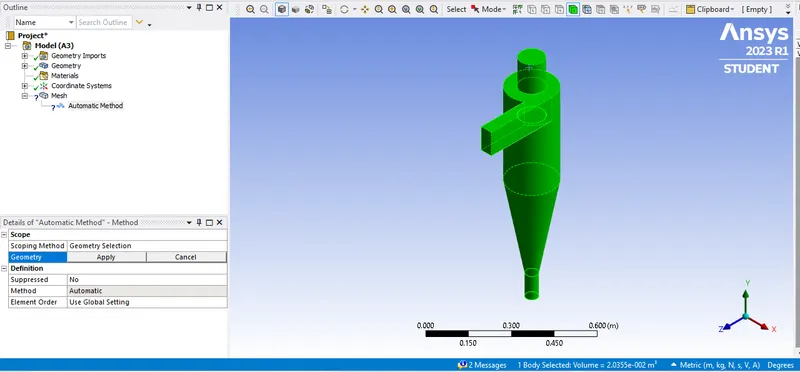
Select the entire body as shown below photo to apply the Cartesion method.
3) Please refer the below photo for the final mesh obtained for the element size of 5 mm, Elements and Nodes obtained is 427841 and 456576 respectively.
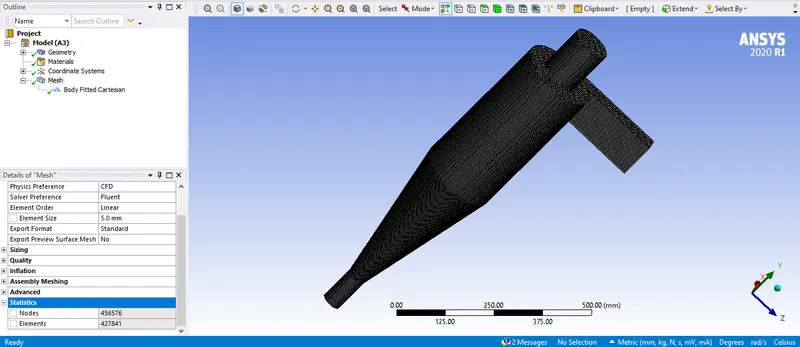
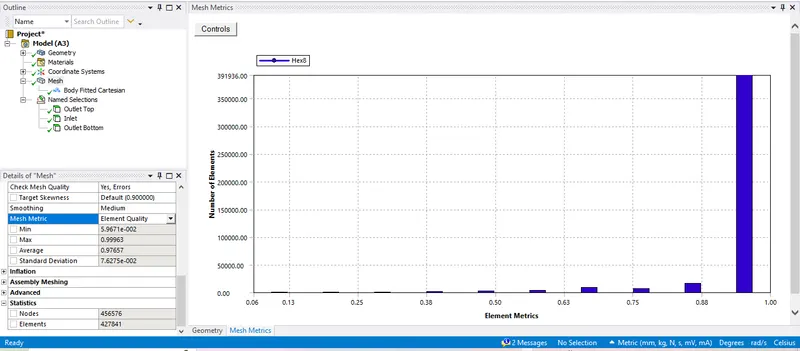
Please refer the below photo for the Mesh element quality obtained and average value is 0.97657
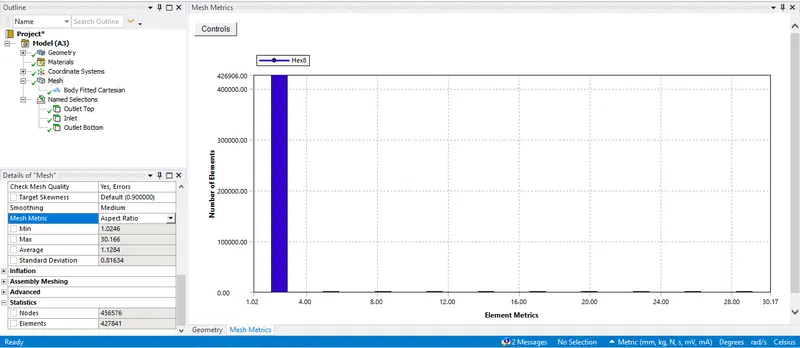
Please refer the below photo for the Aspect Ratio obtained and average value is 1.1284
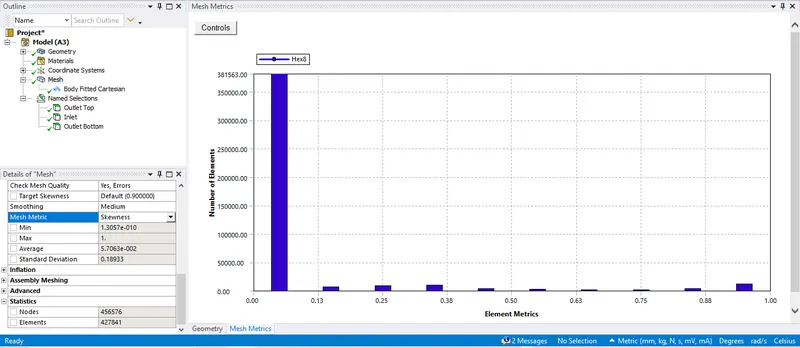
Please refer the below photo for the Skewness obtained and average value is 5.7063e-002.
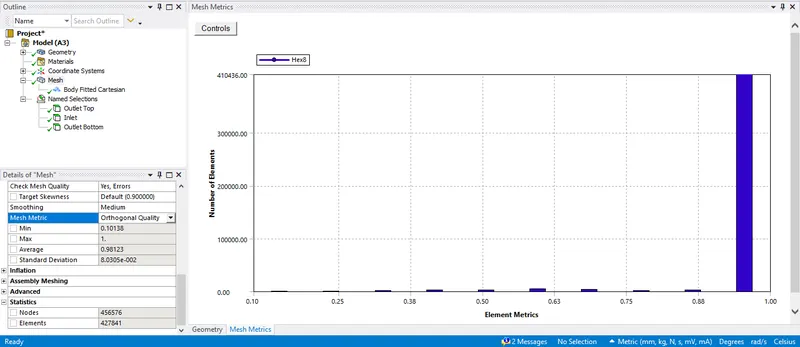
Please refer the below photo for the Orthogonal Quality obtained and average value is 0.98123.
Fluent Set-up:
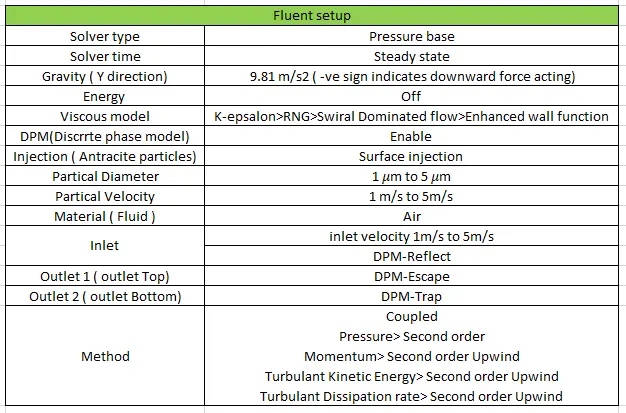
Please refer the below table for the Fluent set-up applied.
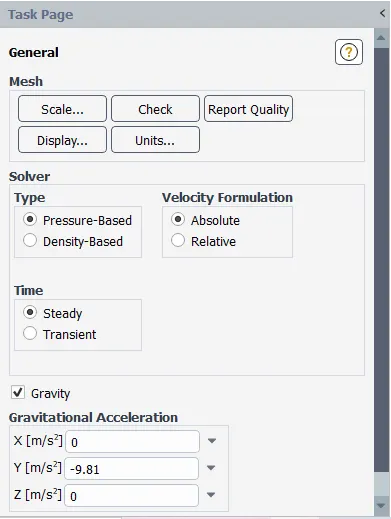
Please refer the below photo for the Solver type, solver time and Gravity enabled.
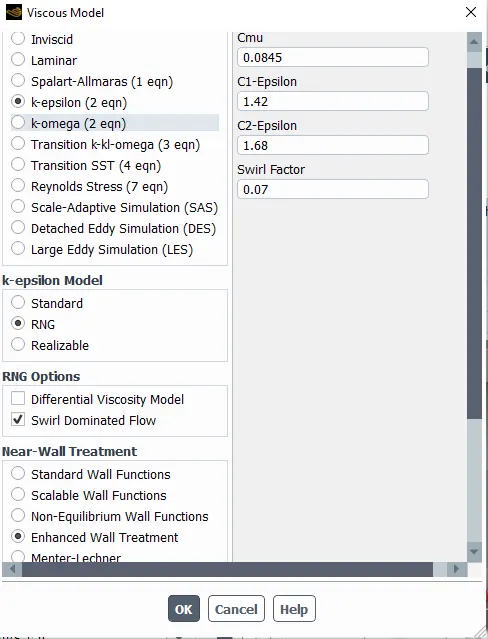
Please refer the below photo for the Viscous Model applied.
Please refer the below photo for the DPM model applied.
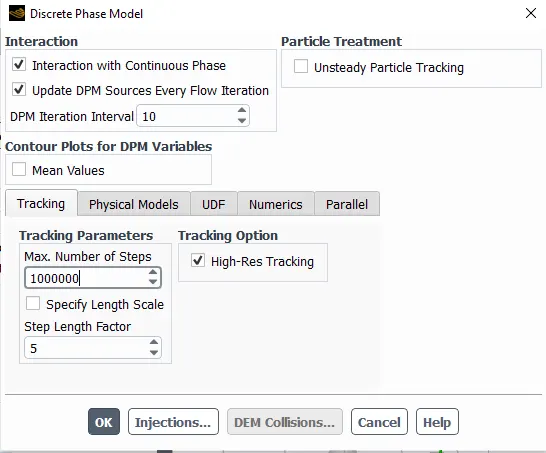
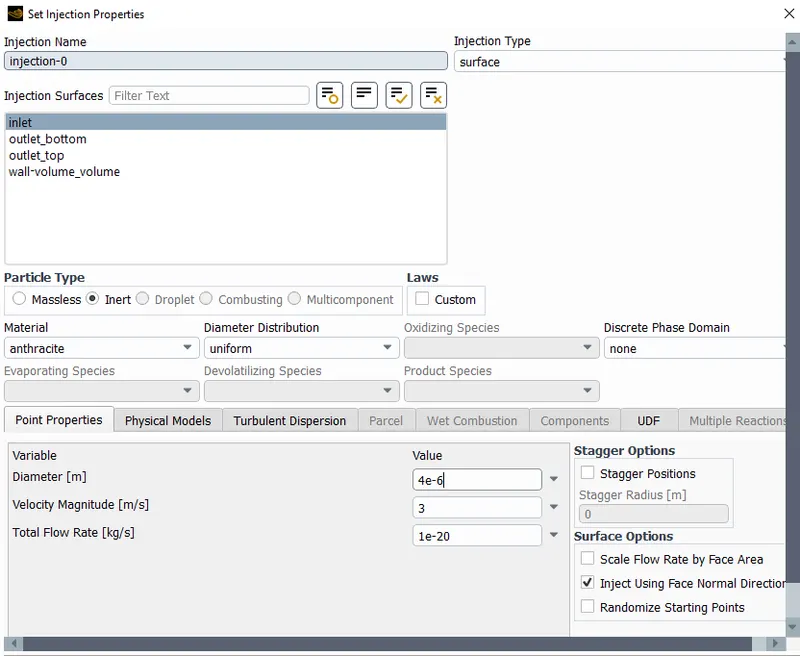
Please refer the below photo for the Injection applied.
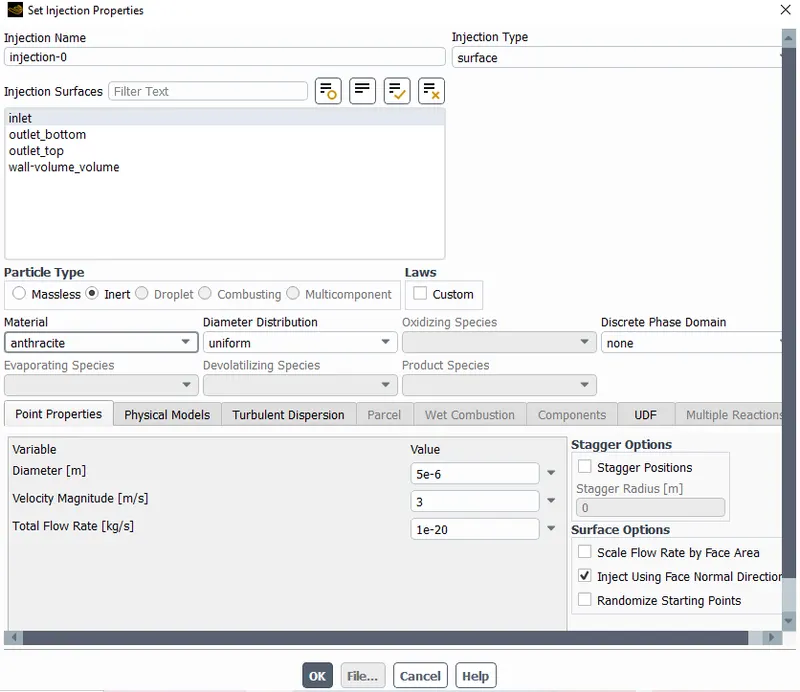
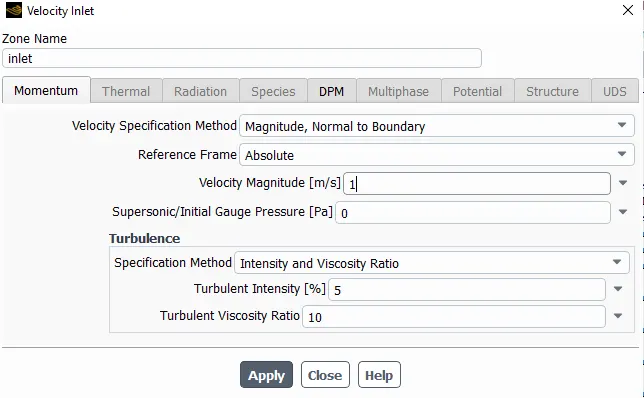
Please refer the below photo for the inlet velocity applied.
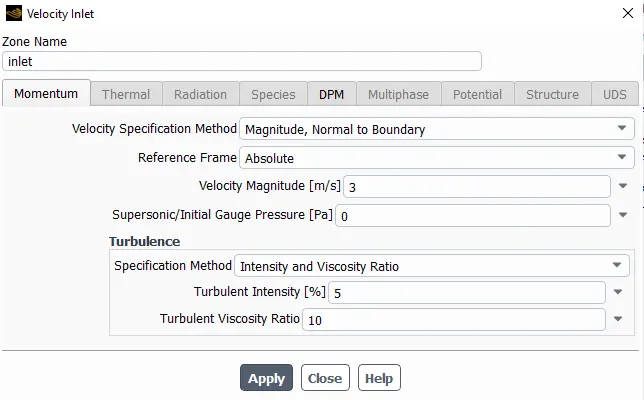
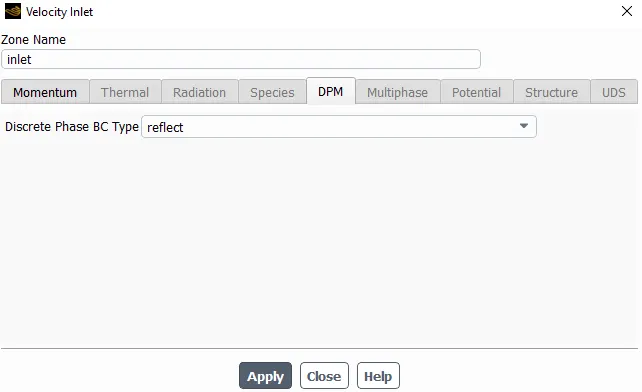
Please refer the below photo for the inlet DPM applied.
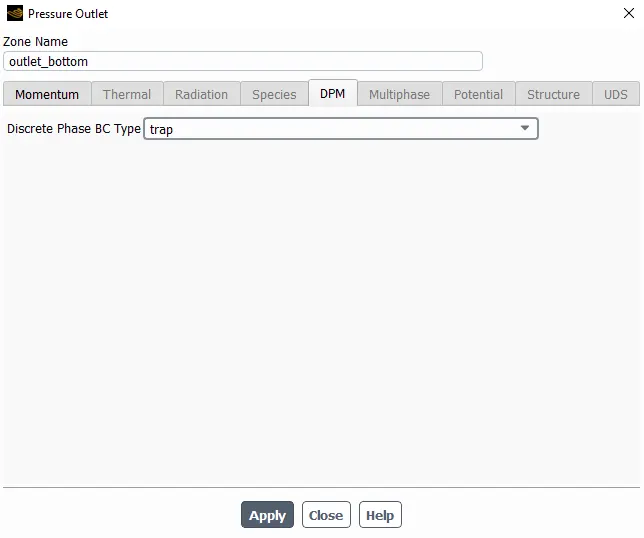
Please refer the below photo for the Outlet Bottom DPM applied.
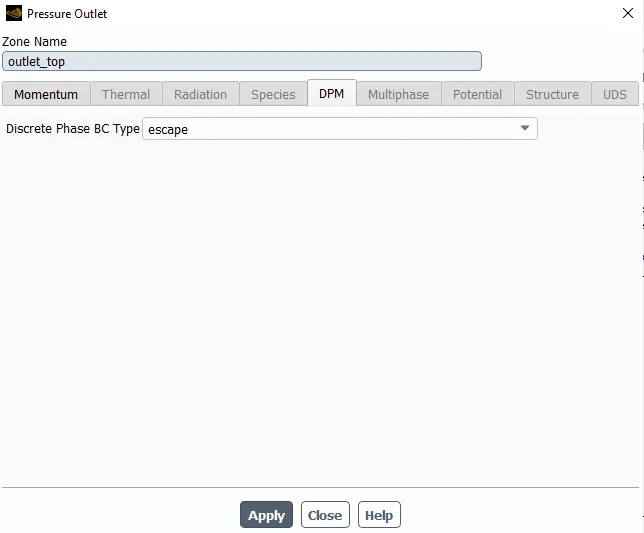
Please refer the below photo for the Outlet Top DPM applied.
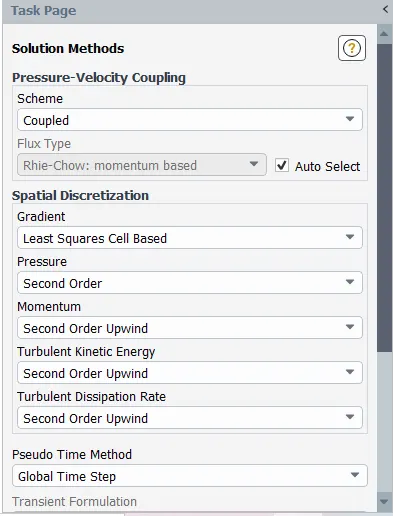
Please refer the below photo for the Coupled method applied.
Please refer the below photo for the Hybrid initialization done.
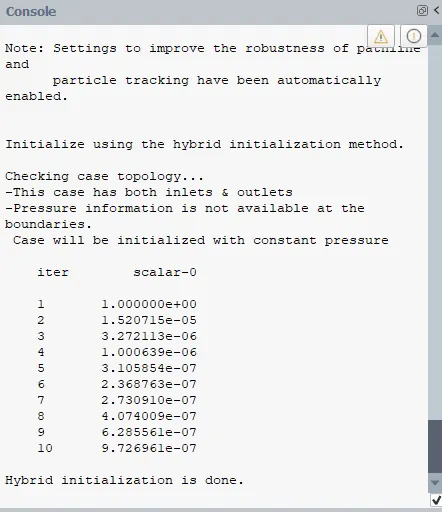
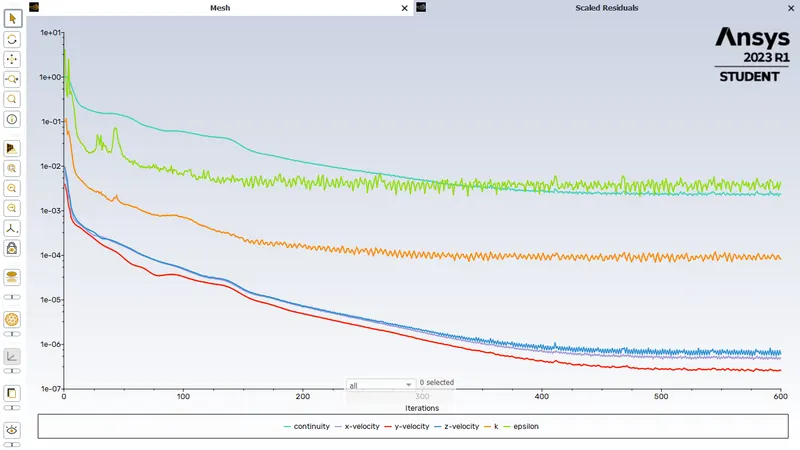
After hybrid initialization I have given run calculation for 600 itiration.
Results:
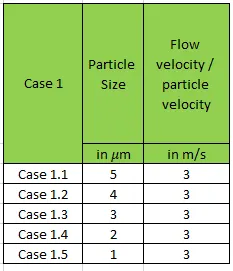
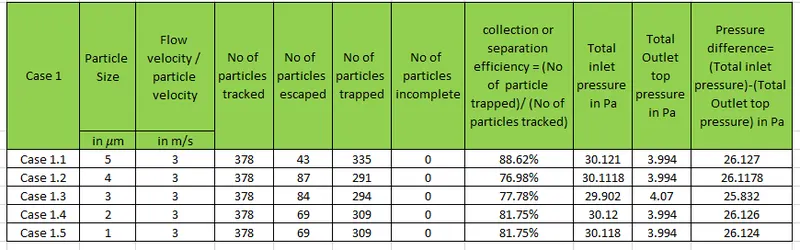
Case 1: Constant Flow velocity / particle velocity of 3 m/s and Varying Partical Size from 5 μm to 1 μm as shown below table.
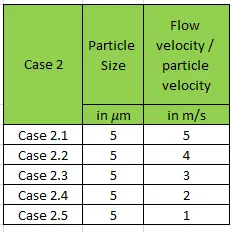
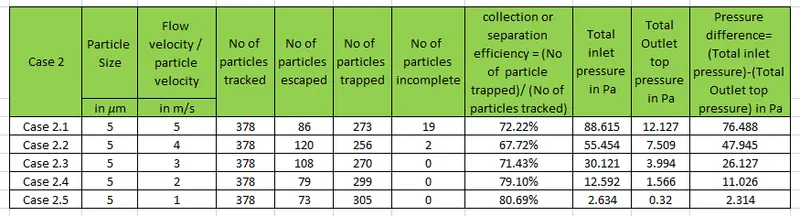
Case 2: Constant Partical Size of 5 μm and Varying Flow velocity / particle velocity from 5 m/s to 1 m/s as shown below table.
Case 1: Constant Flow velocity / particle velocity of 3 m/s and Varying Particle Size from 5 μm to 1 μm.
Case 1.1: Constant Flow velocity / particle velocity of 3 m/s and Varying Particle Size of 5 μm.
Please refer the below photo for the Set-up applied for the case 1.1
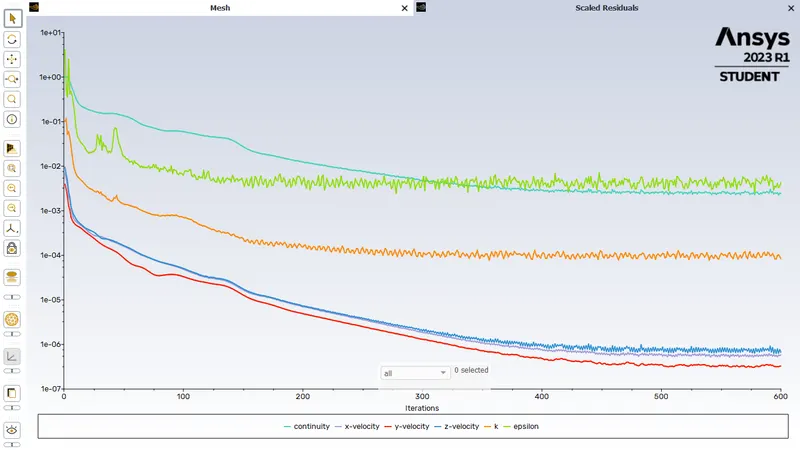
Please refer the below photo for the residuals obtained.
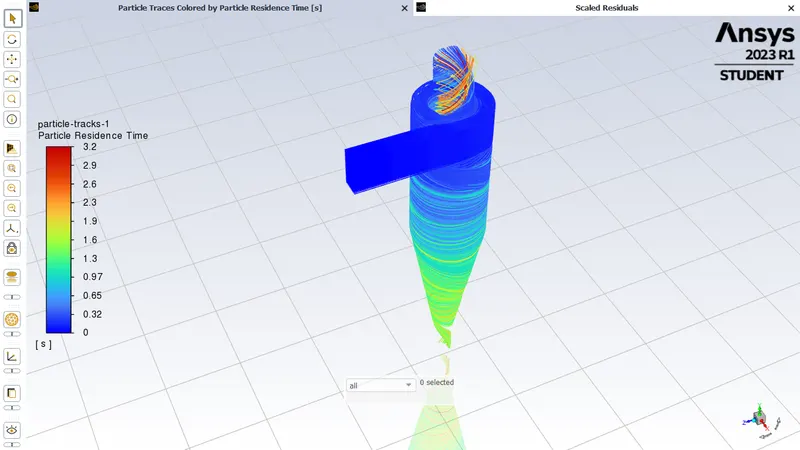
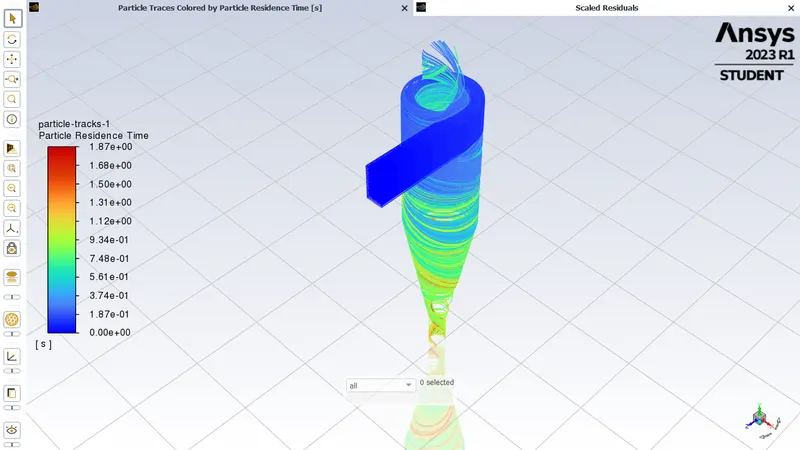
Please refer the below photo for the Partical residence time obtained.
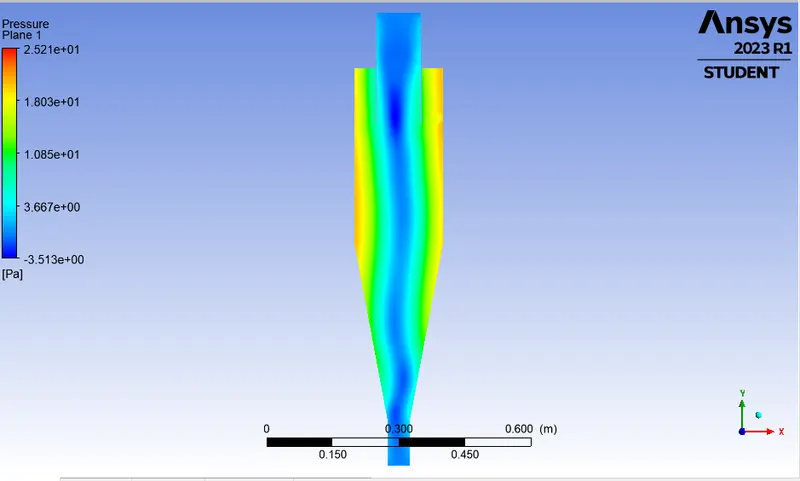
Please refer the below photo for the Pressure distribution in XY plane of the cyclone seperator obtained. Near the wall of the cyclone seperator the pressure is high due to centrifugal force.
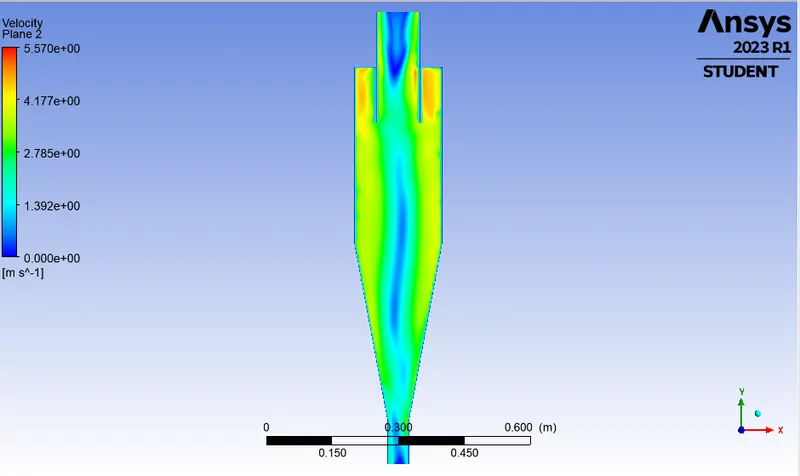
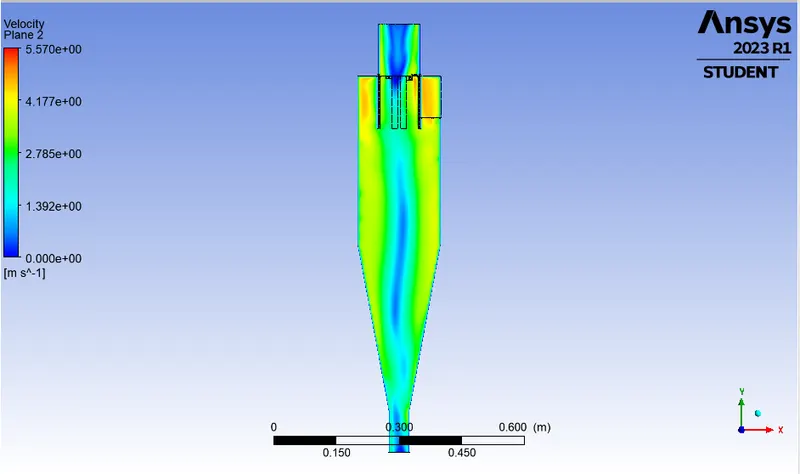
Please refer the below photo for the velocity distribution in XY plane of the cyclone seperator obtained. Near the wall of the cyclone seperator the velocity is high due to centrifugal force.
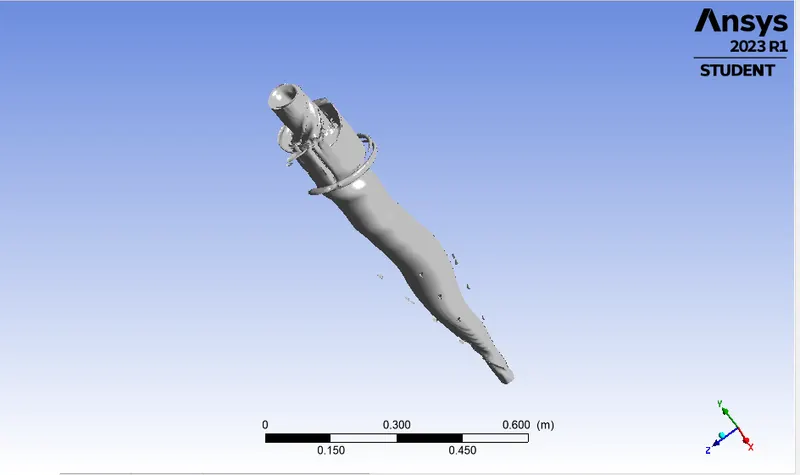
Please refer the below photo for the Vortex core region obtained.
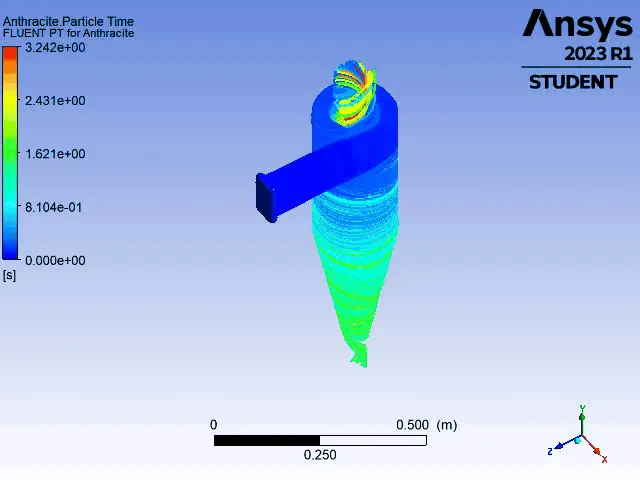
Please refer the below animation for the Constant Flow velocity / particle velocity of 3 m/s and Varying Partical Size of 5 μm simulated.
Please refer the below photo for the results obtained.

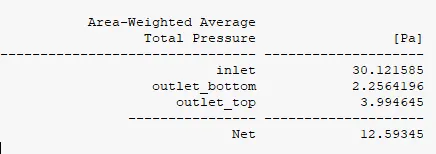
i) Collection or Separation efficiency = (No of particle trapped)/ (No of particles tracked)
Collection or Separation efficiency =(335)/(378)
Collection or Separation efficiency =0.8862x100
Collection or Separation efficiency =88.62%.
ii) Pressure difference= (Total inlet pressure)-(Total Outlet top pressure)
Pressure difference=30.121-3.9946
Pressure difference=26.127 Pa
Case 1.2: Constant Flow velocity / particle velocity of 3 m/s and Varying Particle Size of 4 μm.
Please refer the below photo for the Set-up applied for the case 1.2
Please refer the below photo for the residuals obtained.
Please refer the below photo for the Partical residence time obtained.
Please refer the below photo for the Pressure distribution in XY plane of the cyclone seperator obtained. Near the wall of the cyclone seperator the pressure is high due to centrifugal force.
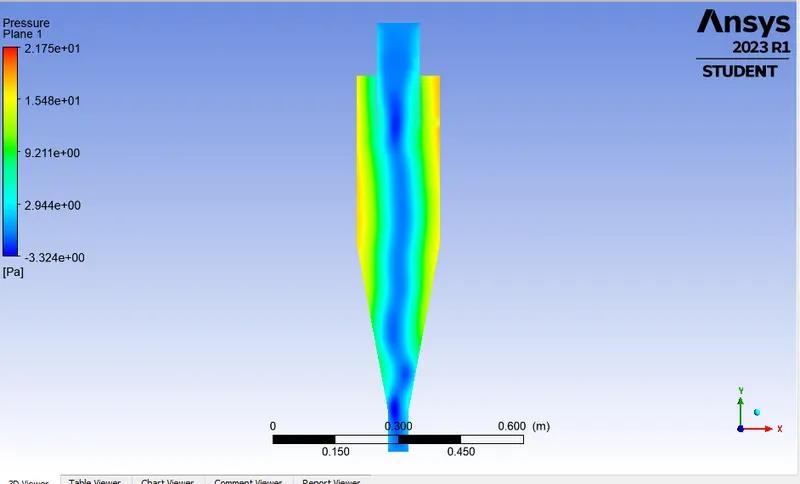
Please refer the below photo for the velocity distribution in XY plane of the cyclone seperator obtained. Near the wall of the cyclone seperator the velocity is high due to centrifugal force.
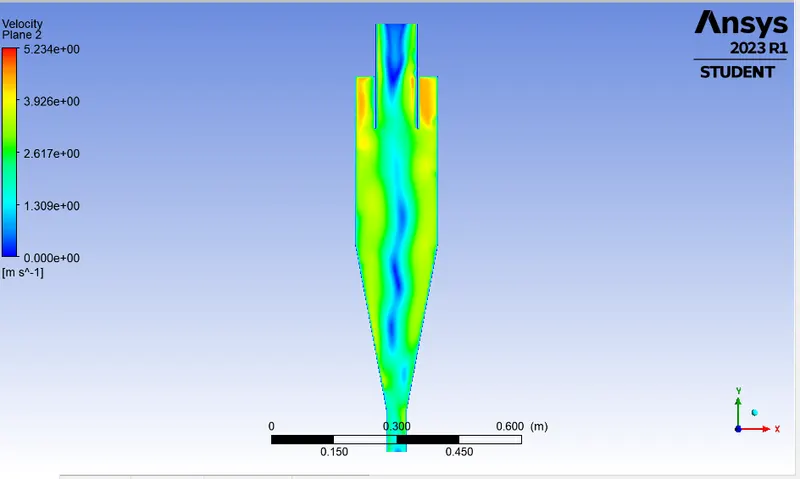
Please refer the below photo for the Vortex core region obtained.
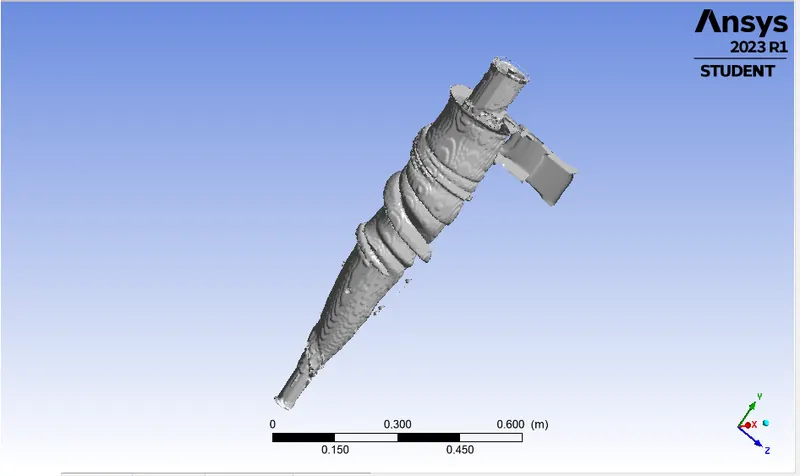
Please refer the below animation for the Constant Flow velocity / particle velocity of 3 m/s and Varying Partical Size of 4 μm simulated.
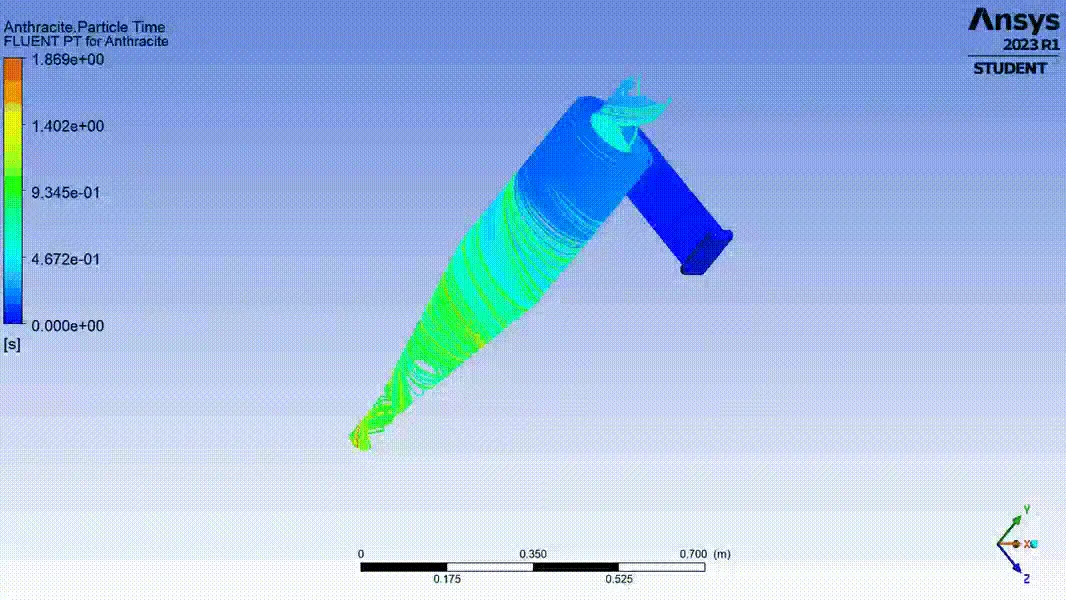
Please refer the below photo for the results obtained.
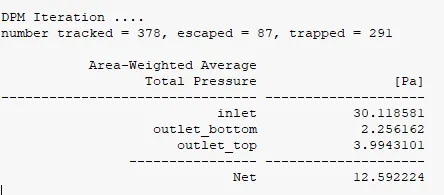
i) Collection or Separation efficiency = (No of particle trapped)/ (No of particles tracked)
Collection or Separation efficiency =(291)/(378)
Collection or Separation efficiency =0.7698x100
Collection or Separation efficiency =76.98%.
ii) Pressure difference= (Total inlet pressure)-(Total Outlet top pressure)
Pressure difference=30.118-3.994
Pressure difference= 26.117 Pa
Case 1.3: Constant Flow velocity / particle velocity of 3 m/s and Varying Particle Size of 3 μm.
Please refer the below photo for the Set-up applied for the case 1.3
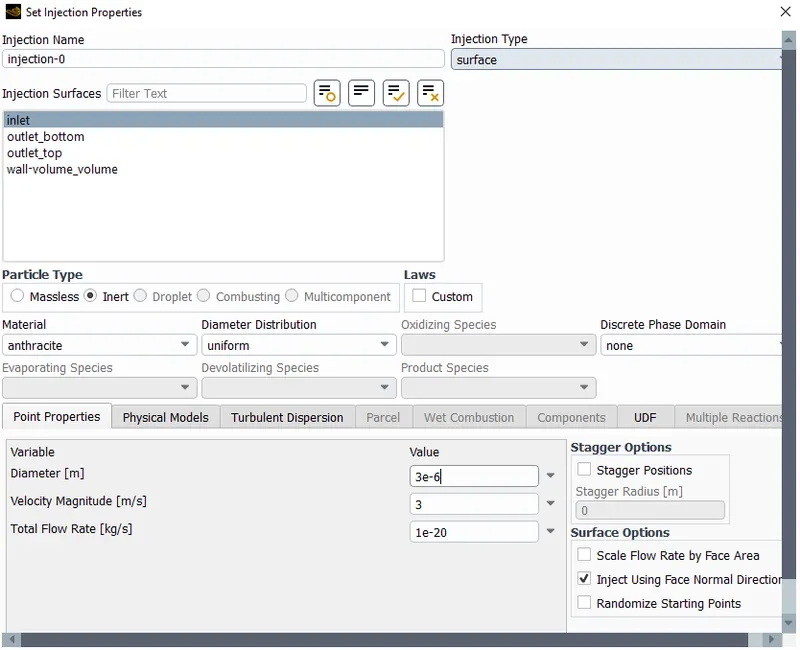
Please refer the below photo for the residuals obtained.
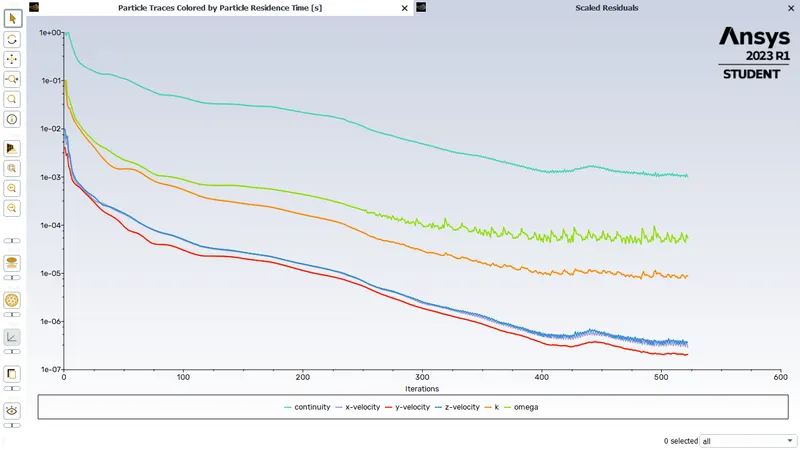
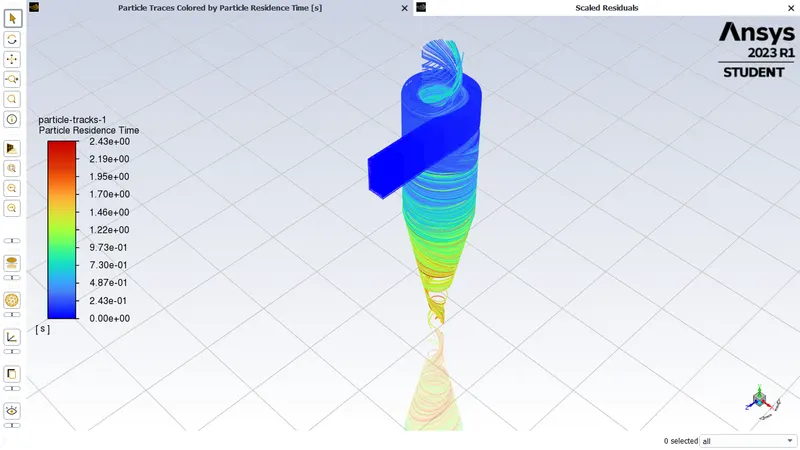
Please refer the below photo for the Partical residence time obtained.
Please refer the below photo for the Pressure distribution in XY plane of the cyclone seperator obtained. Near the wall of the cyclone seperator the pressure is high due to centrifugal force.
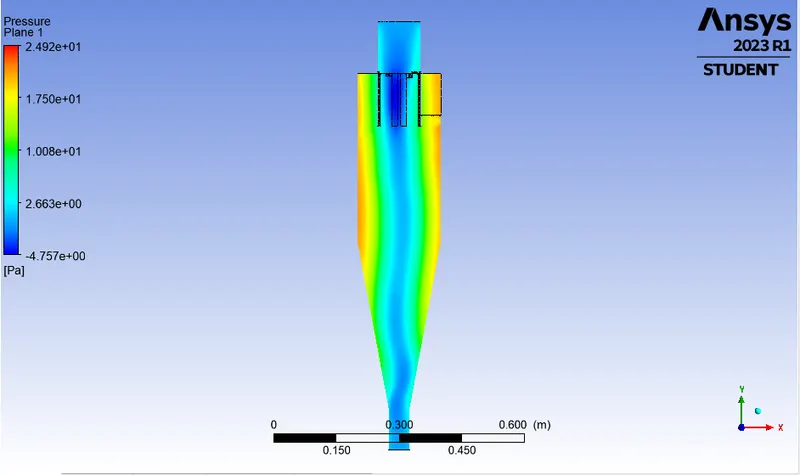
Please refer the below photo for the velocity distribution in XY plane of the cyclone seperator obtained. Near the wall of the cyclone seperator the velocity is high due to centrifugal force.
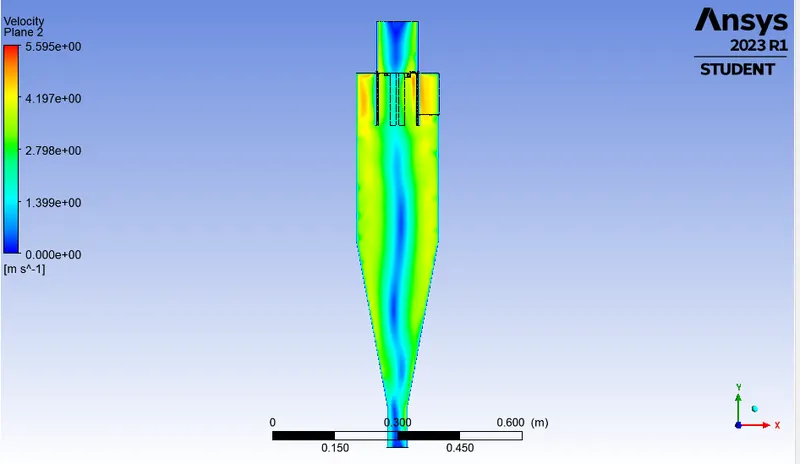
Please refer the below photo for the Vortex core region obtained.
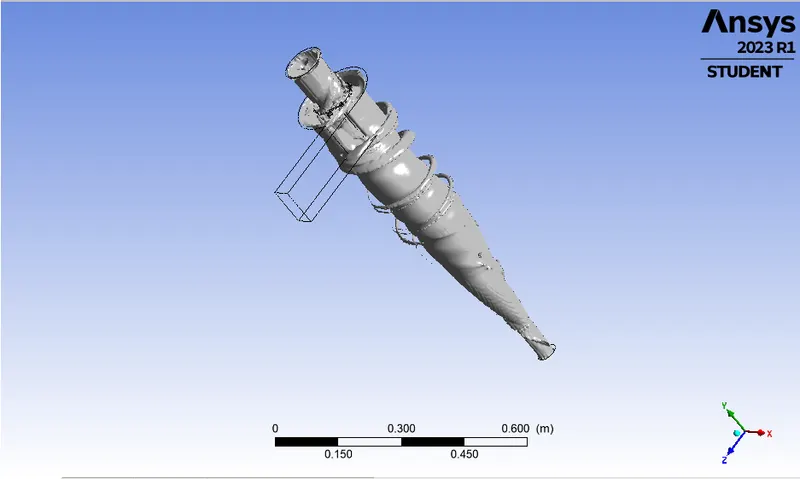
Please refer the below animation for the Constant Flow velocity / particle velocity of 3 m/s and Varying Partical Size of 3 μm simulated.
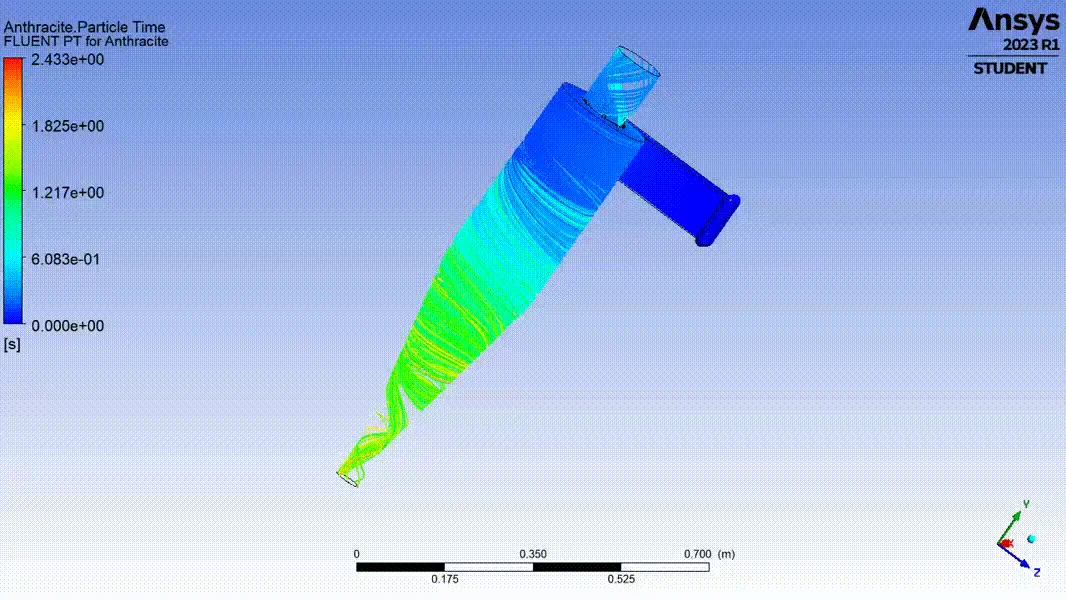
Please refer the below photo for the results obtained.
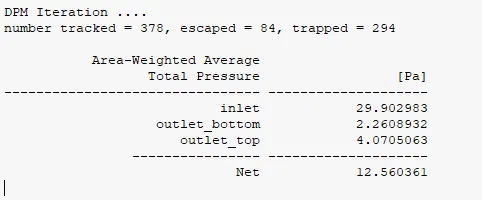
i) Collection or Separation efficiency = (No of particle trapped)/ (No of particles tracked)
Collection or Separation efficiency =(294)/(378)
Collection or Separation efficiency =0.7778x100
Collection or Separation efficiency =77.78%.
ii) Pressure difference= (Total inlet pressure)-(Total Outlet top pressure)
Pressure difference=29.902-4.070
Pressure difference=25.832 Pa
Case 1.4: Constant Flow velocity / particle velocity of 3 m/s and Varying Particle Size of 2 μm.
Please refer the below photo for the Set-up applied for the case 1.4
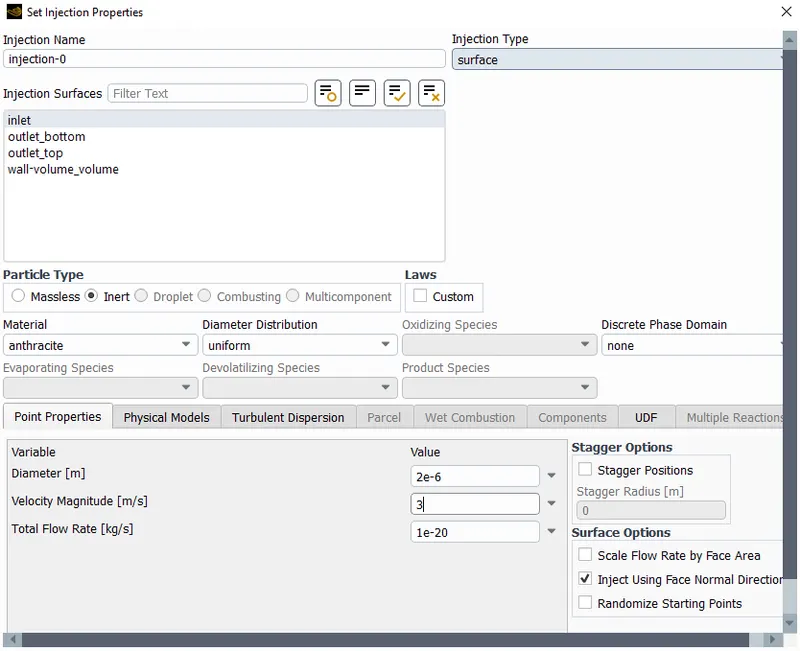
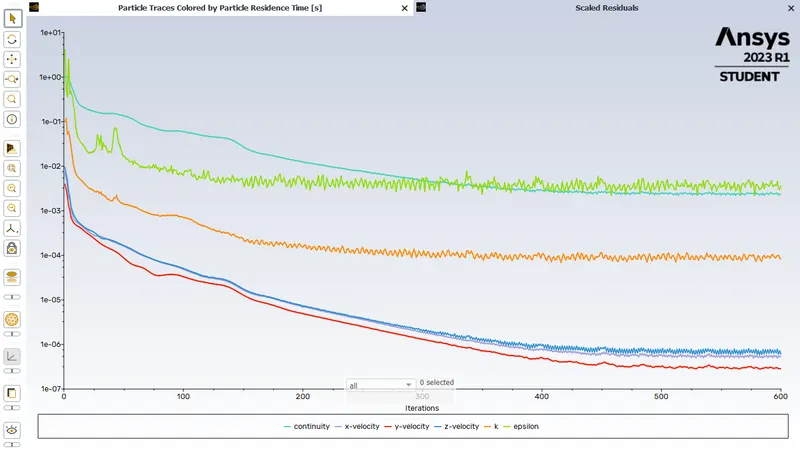
Please refer the below photo for the residuals obtained.
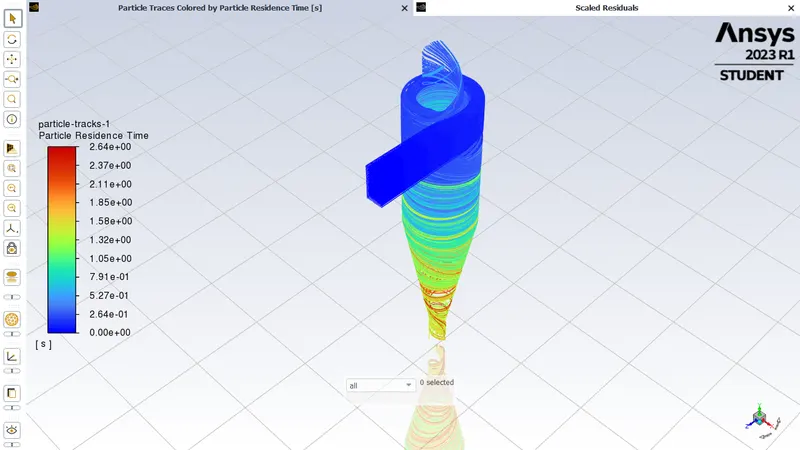
Please refer the below photo for the Partical residence time obtained.
Please refer the below photo for the Pressure distribution in XY plane of the cyclone seperator obtained. Near the wall of the cyclone seperator the pressure is high due to centrifugal force.
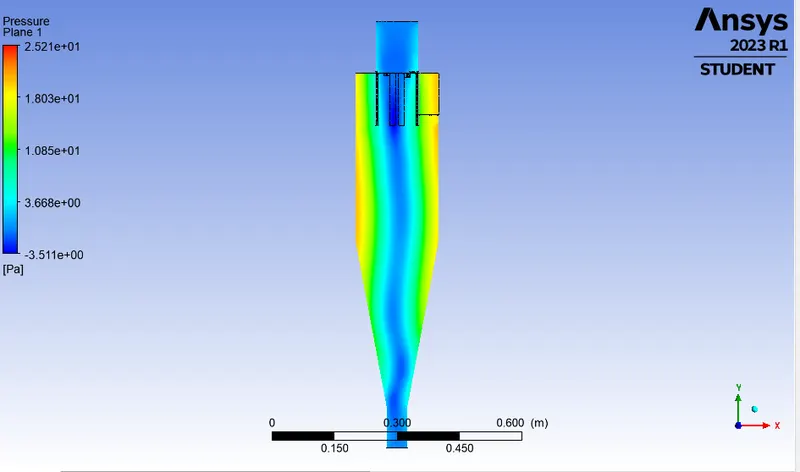
Please refer the below photo for the velocity distribution in XY plane of the cyclone seperator obtained. Near the wall of the cyclone seperator the velocity is high due to centrifugal force.
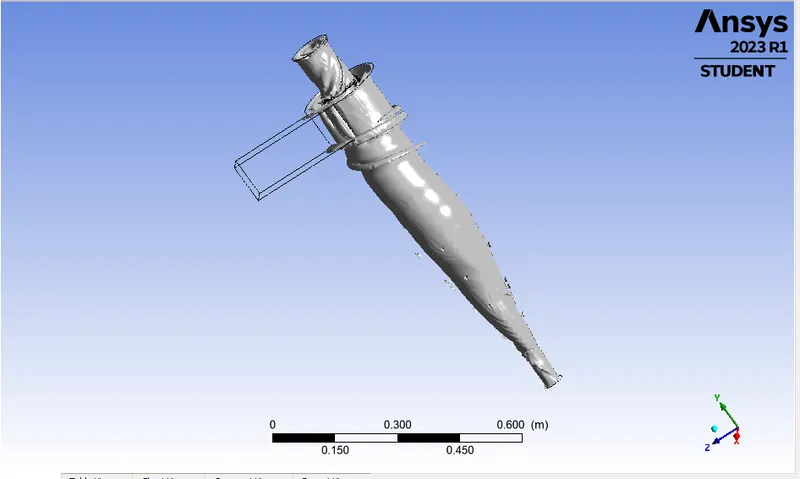
Please refer the below photo for the Vortex core region obtained.
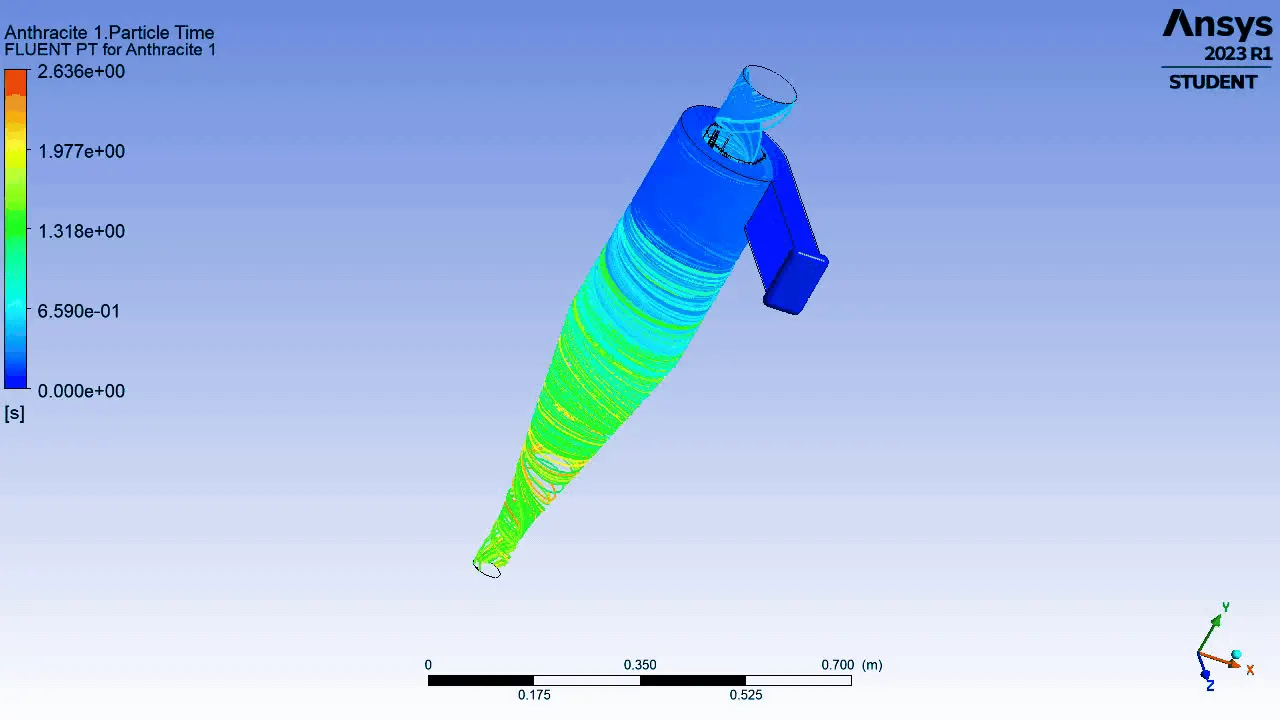
Please refer the below animation for the Constant Flow velocity / particle velocity of 3 m/s and Varying Partical Size of 2 μm simulated.
Please refer the below photo for the results obtained.
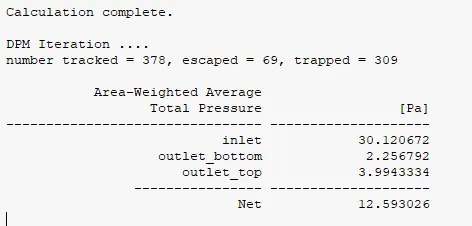
i) Collection or Separation efficiency = (No of particle trapped)/ (No of particles tracked)
Collection or Separation efficiency =(309)/(378)
Collection or Separation efficiency =0.8175x100
Collection or Separation efficiency =81.75%.
ii) Pressure difference= (Total inlet pressure)-(Total Outlet top pressure)
Pressure difference=30.120-3.994
Pressure difference=26.126 Pa
Case 1.5: Constant Flow velocity / particle velocity of 3 m/s and Varying Particle Size of 1 μm.
Please refer the below photo for the Set-up applied for the case 1.5
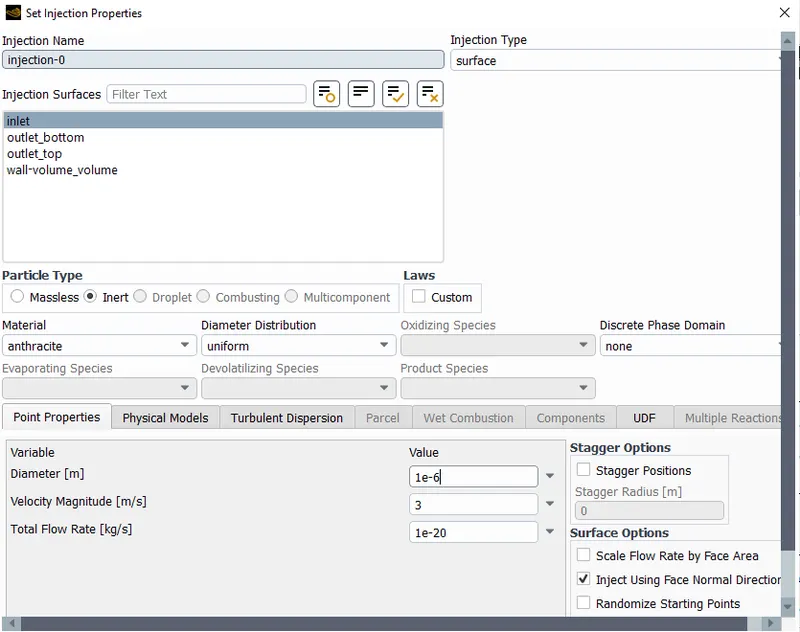
Please refer the below photo for the residuals obtained.
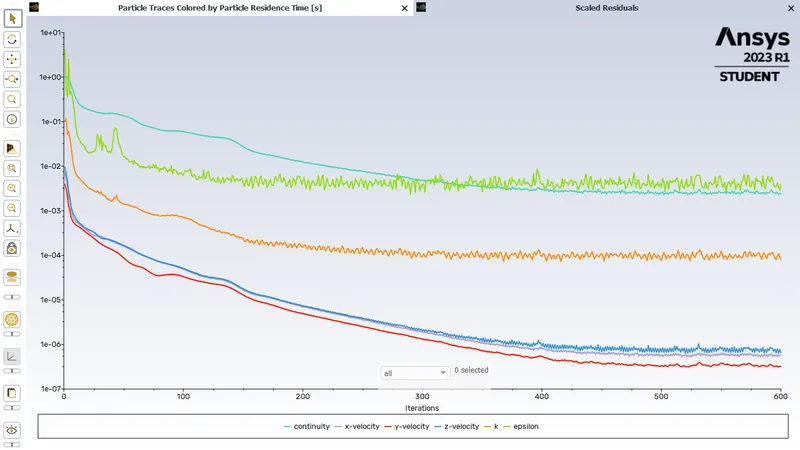
Please refer the below photo for the Partical residence time obtained.
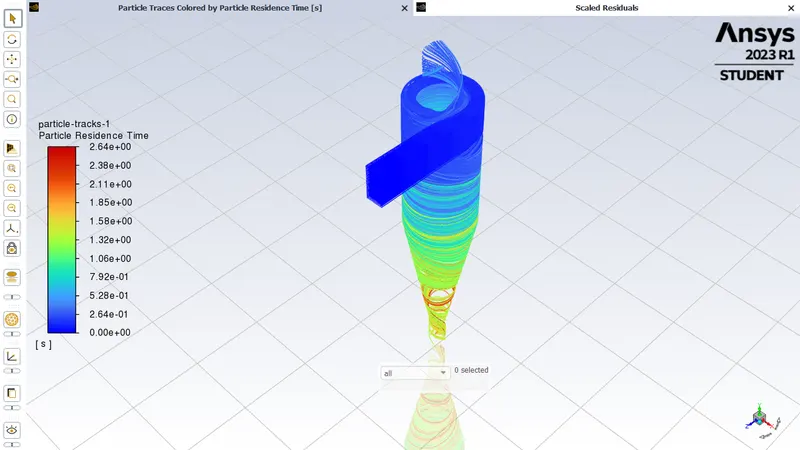
Please refer the below photo for the Pressure distribution in XY plane of the cyclone seperator obtained. Near the wall of the cyclone seperator the pressure is high due to centrifugal force.
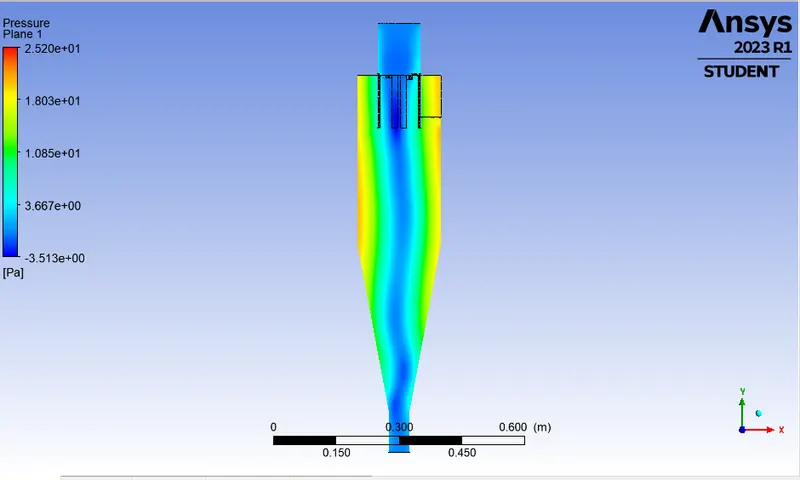
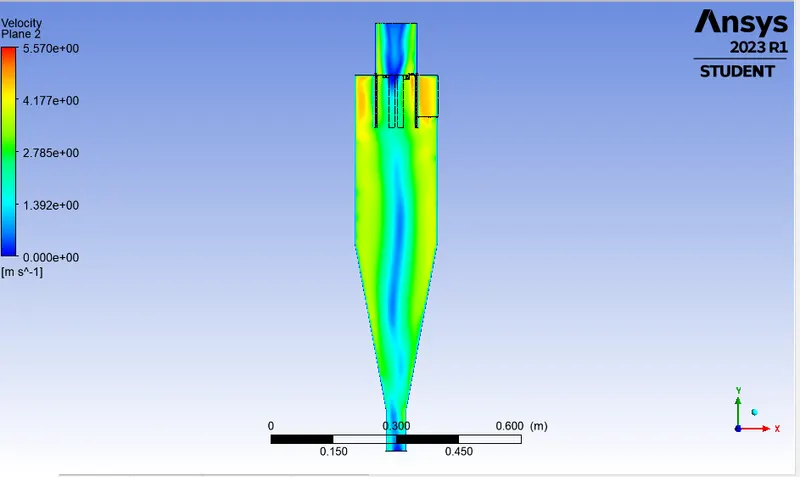
Please refer the below photo for the velocity distribution in XY plane of the cyclone seperator obtained. Near the wall of the cyclone seperator the velocity is high due to centrifugal force.
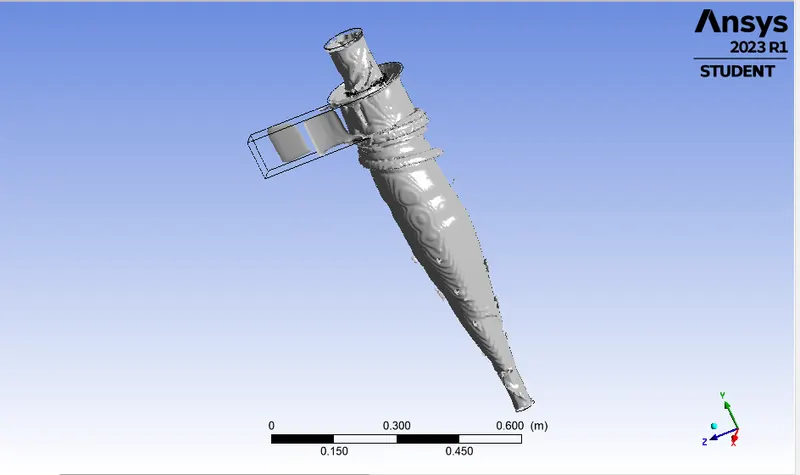
Please refer the below photo for the Vortex core region obtained.
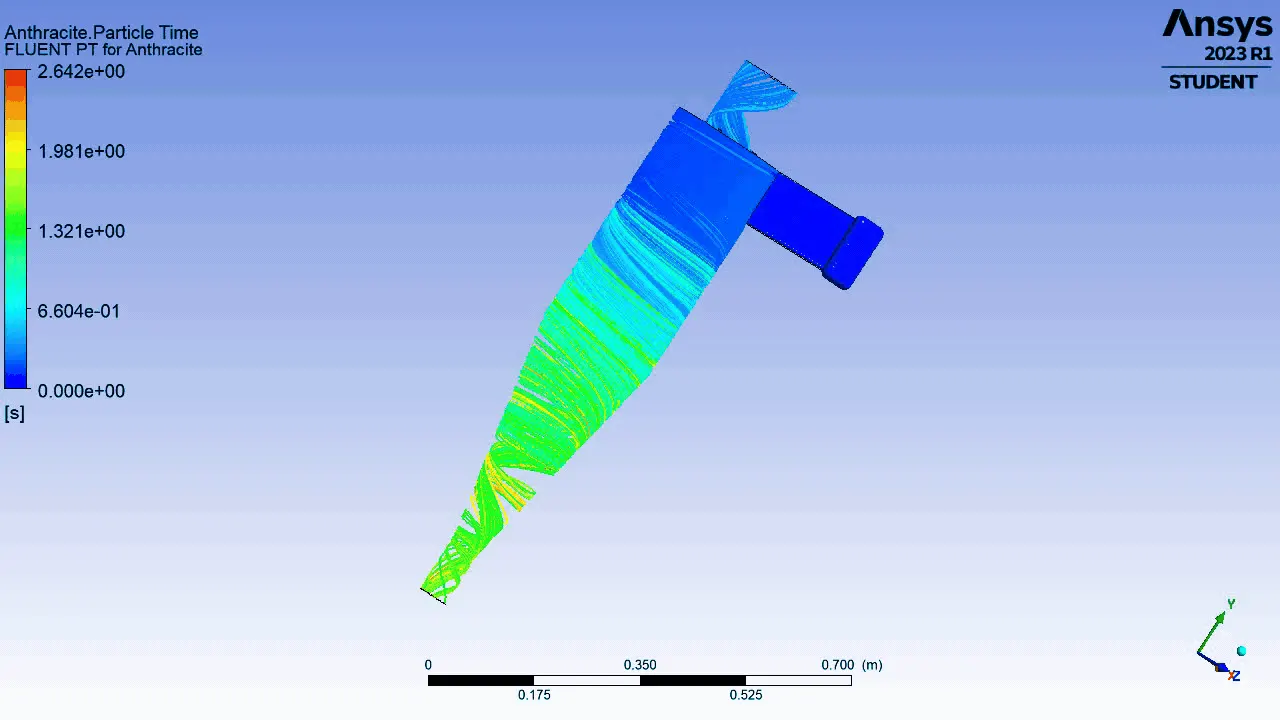
Please refer the below animation for the Constant Flow velocity / particle velocity of 3 m/s and Varying Partical Size of 1 μm simulated.
Please refer the below photo for the results obtained.
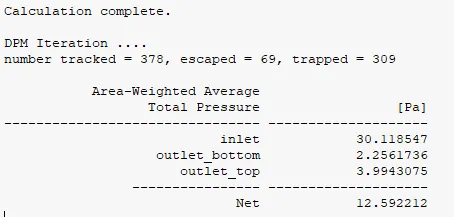
i) Collection or Separation efficiency = (No of particle trapped)/ (No of particles tracked)
Collection or Separation efficiency =(309)/(378)
Collection or Separation efficiency =0.8175x100
Collection or Separation efficiency =81.75%.
ii) Pressure difference= (Total inlet pressure)-(Total Outlet top pressure)
Pressure difference=30.118-3.994
Pressure difference=26.124 Pa
Case 2: Constant Partical Size of 5 μm and Varying Flow velocity / particle velocity from 5 m/s to 1 m/s.
Case 2.1: Constant Partical Size of 5 μm and Varying Flow velocity / particle velocity 5 m/s.
Please refer the below photo for the Set-up applied for the case 2.1
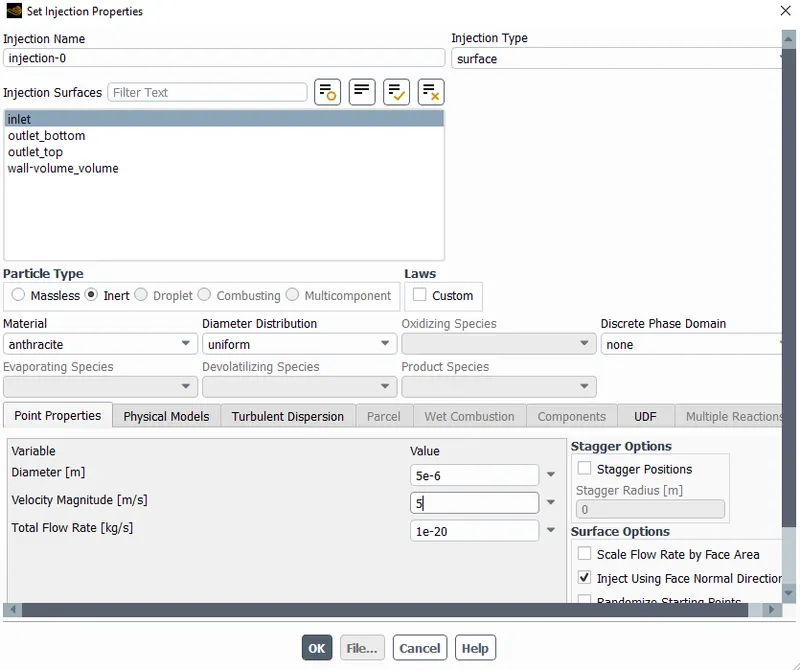
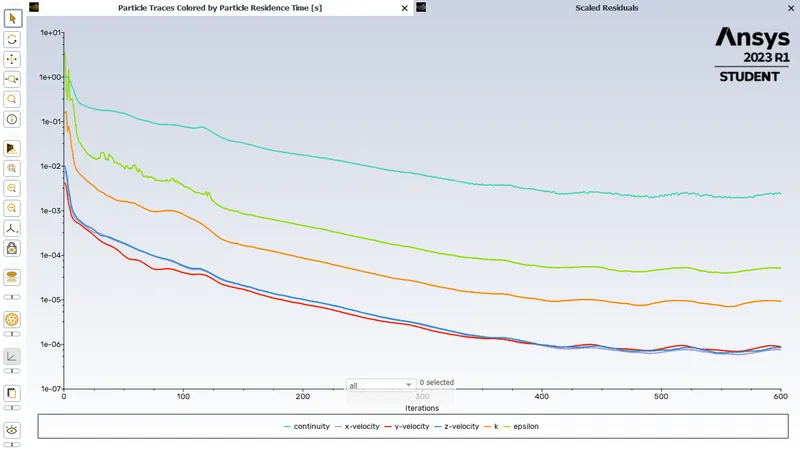
Please refer the below photo for the residuals obtained.
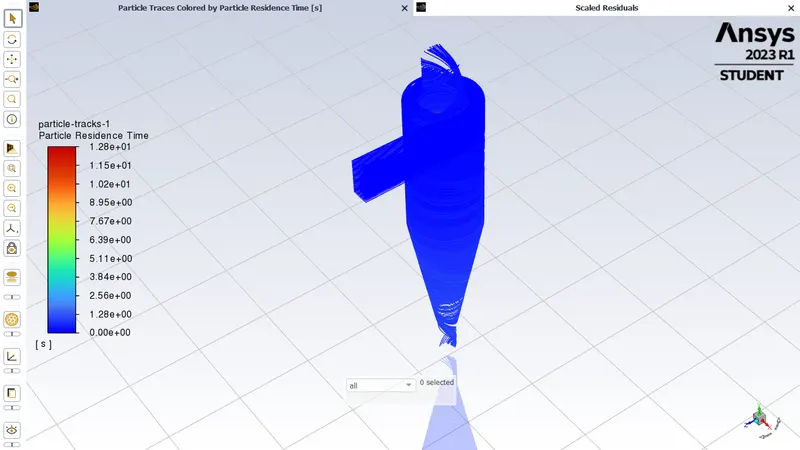
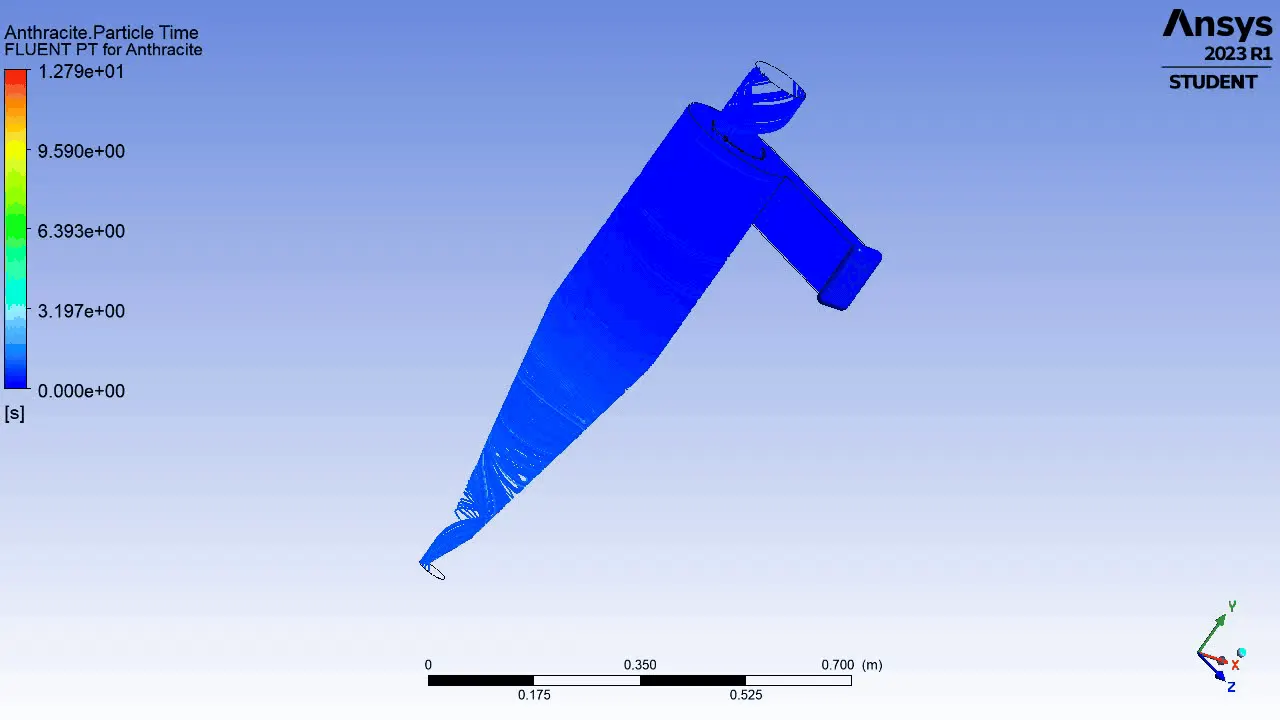
Please refer the below photo for the Partical residence time obtained.
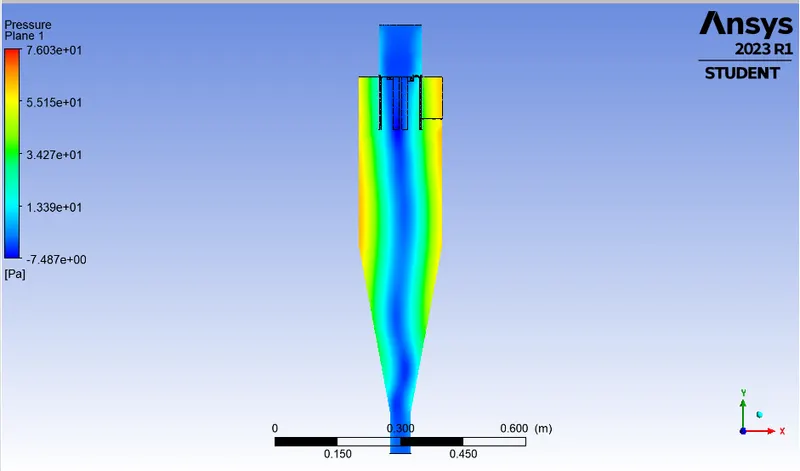
Please refer the below photo for the Pressure distribution in XY plane of the cyclone seperator obtained. Near the wall of the cyclone seperator the pressure is high due to centrifugal force.
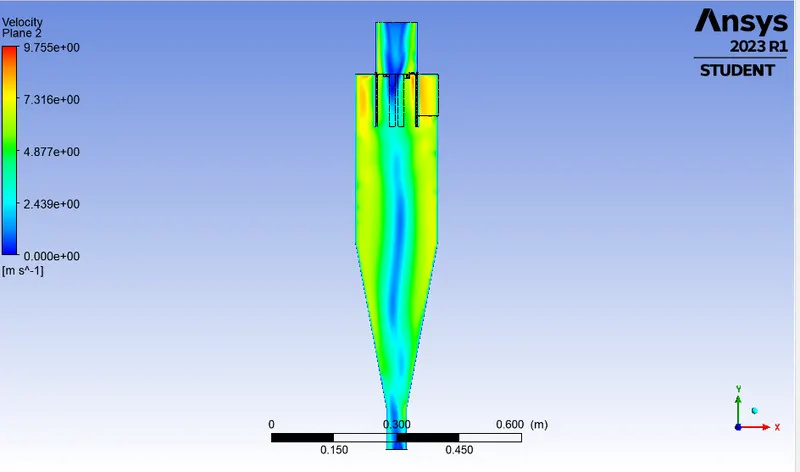
Please refer the below photo for the velocity distribution in XY plane of the cyclone seperator obtained. Near the wall of the cyclone seperator the velocity is high due to centrifugal force.
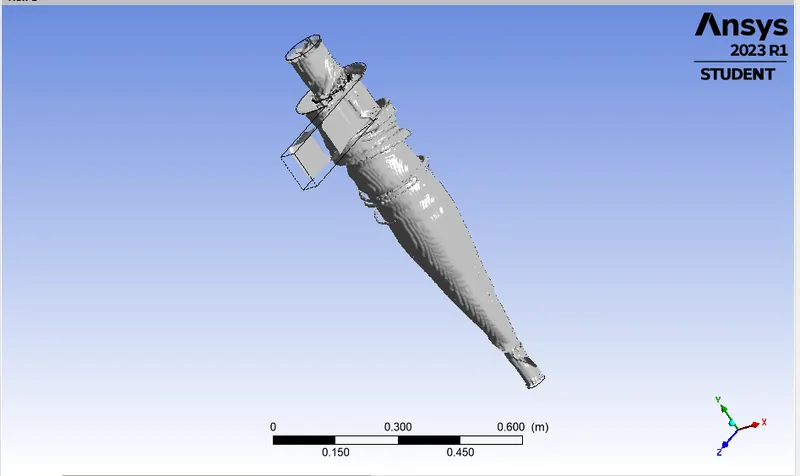
Please refer the below photo for the Vortex core region obtained.
Please refer the below animation for the Constant Flow velocity / particle velocity of 5 m/s and Varying Partical Size of 5 μm simulated.
Please refer the below photo for the results obtained.
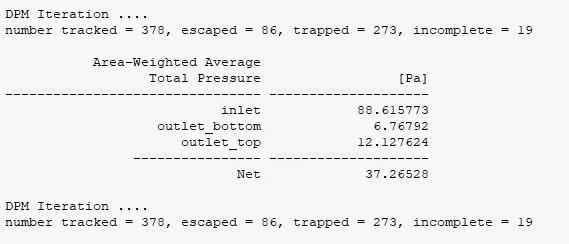
i) Collection or Separation efficiency = (No of particle trapped)/ (No of particles tracked)
Collection or Separation efficiency =(273)/(378)
Collection or Separation efficiency =0.7222x100
Collection or Separation efficiency =72.22%.
ii) Pressure difference= (Total inlet pressure)-(Total Outlet top pressure)
Pressure difference=88.615-12.127
Pressure difference=76.488 Pa
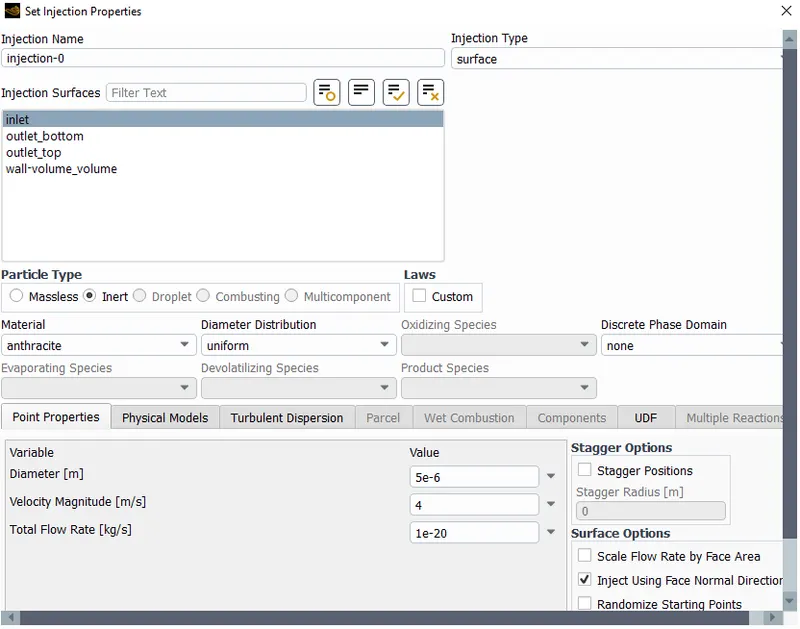
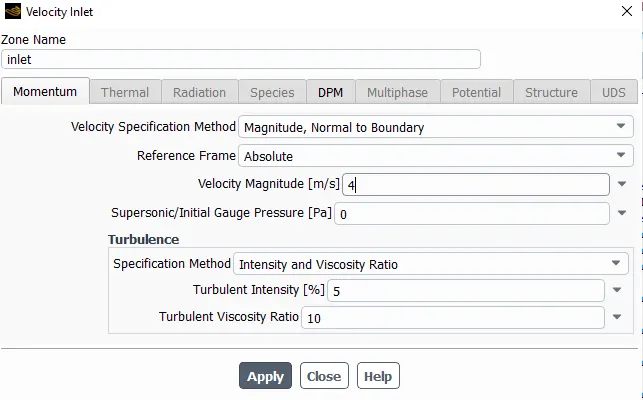
Case 2.2: Constant Partical Size of 5 μm and Varying Flow velocity / particle velocity 4 m/s.
Please refer the below photo for the Set-up applied for the case 2.2
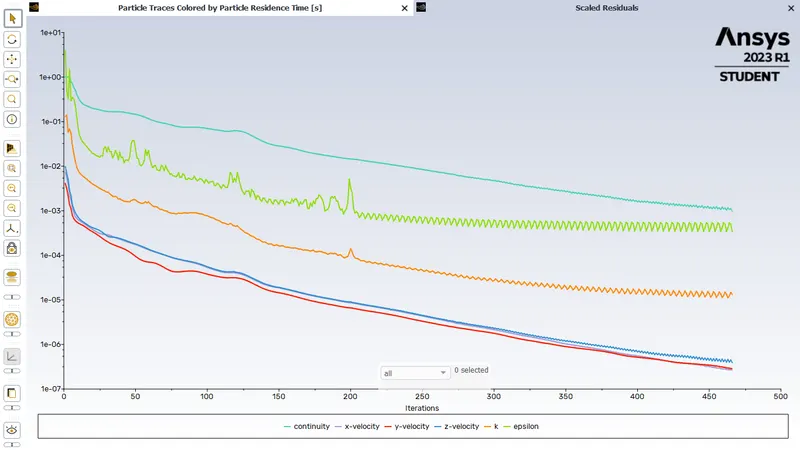
Please refer the below photo for the residuals obtained.
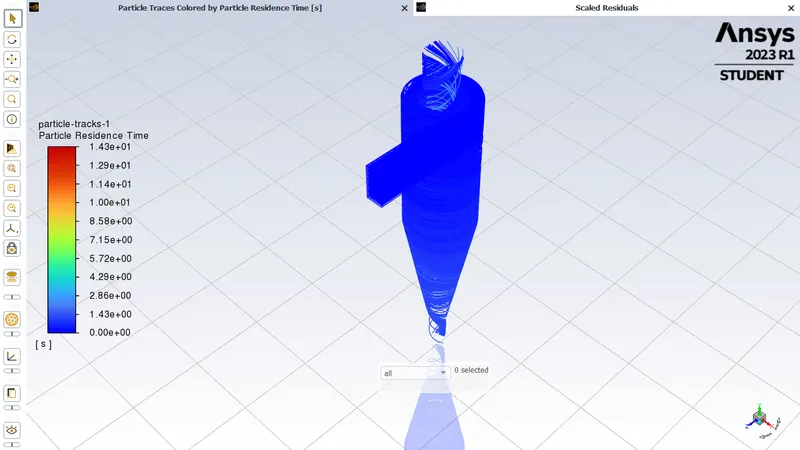
Please refer the below photo for the Partical residence time obtained.
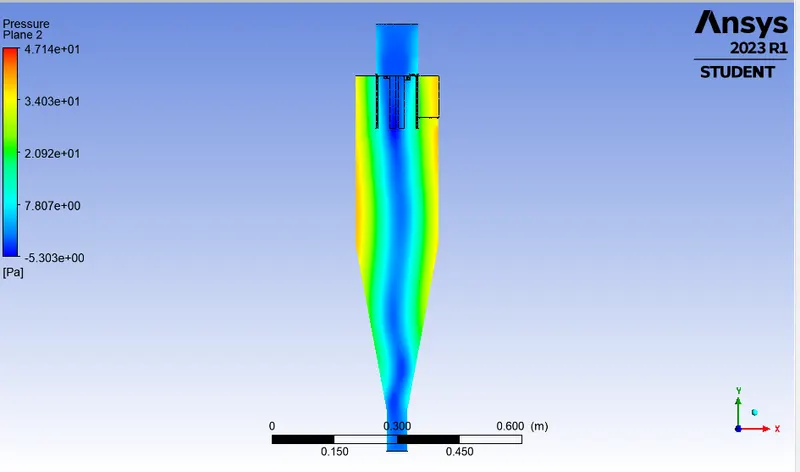
Please refer the below photo for the Pressure distribution in XY plane of the cyclone seperator obtained. Near the wall of the cyclone seperator the pressure is high due to centrifugal force.
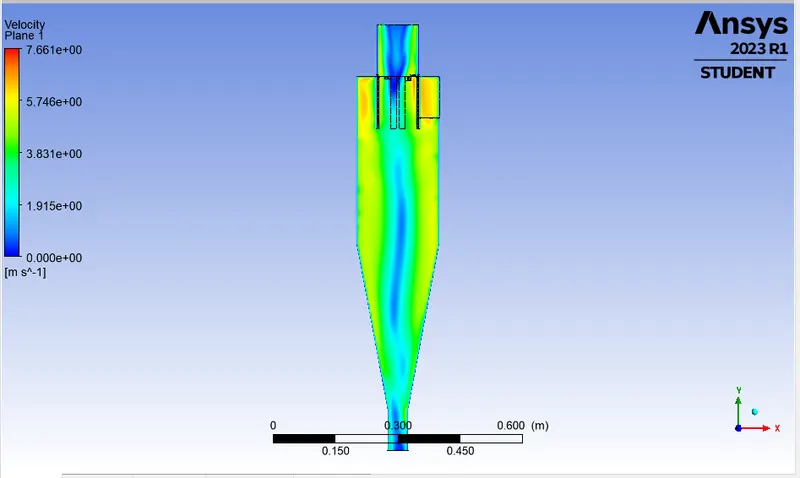
Please refer the below photo for the velocity distribution in XY plane of the cyclone seperator obtained. Near the wall of the cyclone seperator the velocity is high due to centrifugal force.
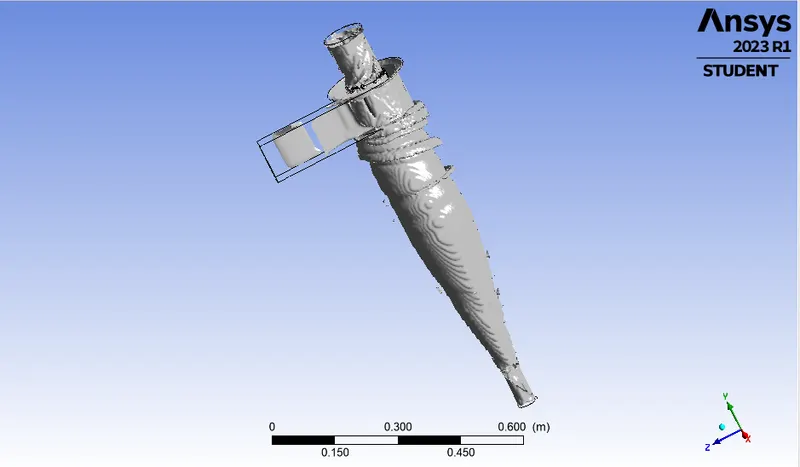
Please refer the below photo for the Vortex core region obtained.
Please refer the below animation for the Constant Flow velocity / particle velocity of 4 m/s and Varying Partical Size of 5 μm simulated.
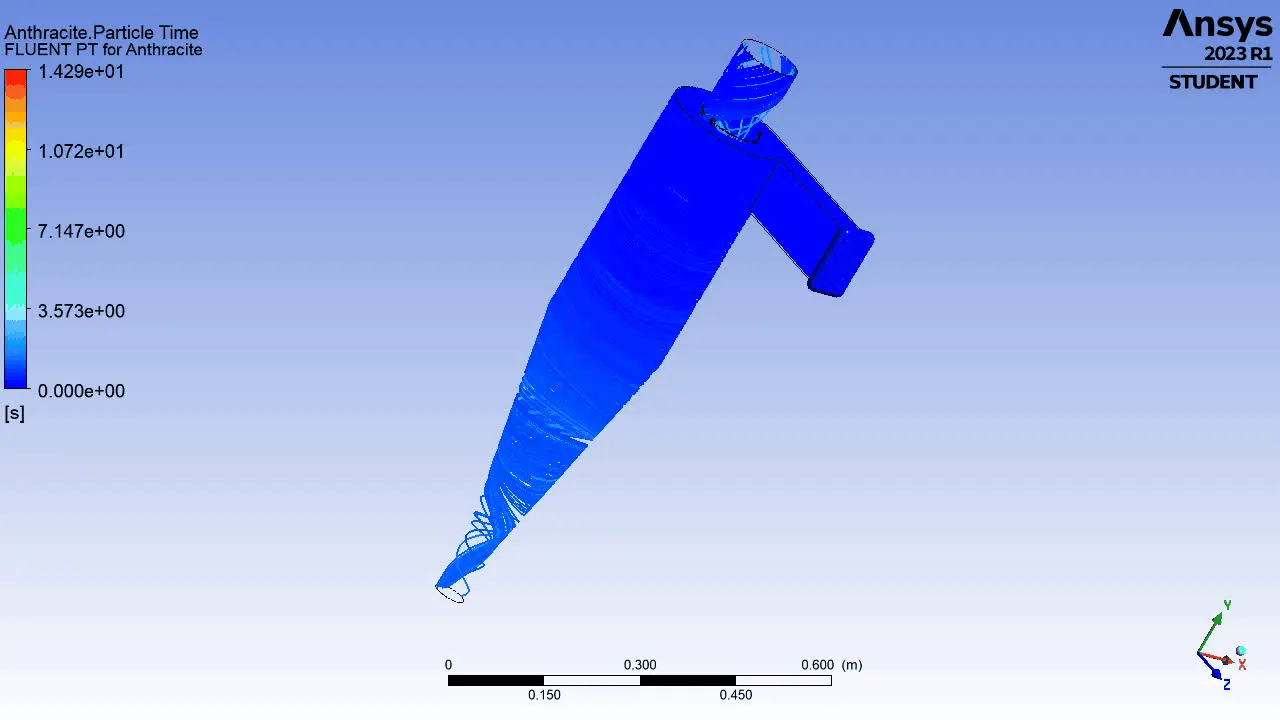
Please refer the below photo for the results obtained.
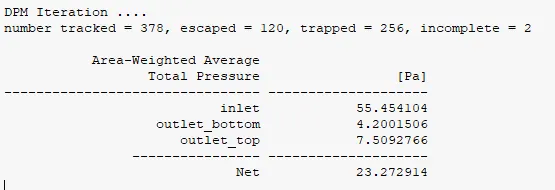
i) Collection or Separation efficiency = (No of particle trapped)/ (No of particles tracked)
Collection or Separation efficiency =(256)/(378)
Collection or Separation efficiency =0.6772x100
Collection or Separation efficiency =67.72%.
ii) Pressure difference= (Total inlet pressure)-(Total Outlet top pressure)
Pressure difference=55.454-7.509
Pressure difference=47.945 Pa
Case 2.3: Constant Partical Size of 5 μm and Varying Flow velocity / particle velocity 3 m/s.
Please refer the below photo for the Set-up applied for the case 1.1
Please refer the below photo for the residuals obtained.
Please refer the below photo for the Partical residence time obtained.
Please refer the below photo for the Pressure distribution in XY plane of the cyclone seperator obtained. Near the wall of the cyclone seperator the pressure is high due to centrifugal force.
Please refer the below photo for the velocity distribution in XY plane of the cyclone seperator obtained. Near the wall of the cyclone seperator the velocity is high due to centrifugal force.
Please refer the below photo for the Vortex core region obtained.
Please refer the below animation for the Constant Flow velocity / particle velocity of 3 m/s and Varying Partical Size of 5 μm simulated.
Please refer the below photo for the results obtained.
i) Collection or Separation efficiency = (No of particle trapped)/ (No of particles tracked)
Collection or Separation efficiency =(335)/(378)
Collection or Separation efficiency =0.8862x100
Collection or Separation efficiency =88.62%.
ii) Pressure difference= (Total inlet pressure)-(Total Outlet top pressure)
Pressure difference=30.121-3.9946
Pressure difference=26.127 Pa
Case 2.4: Constant Partical Size of 5 μm and Varying Flow velocity / particle velocity 2 m/s.
Please refer the below photo for the Set-up applied for the case 2.4
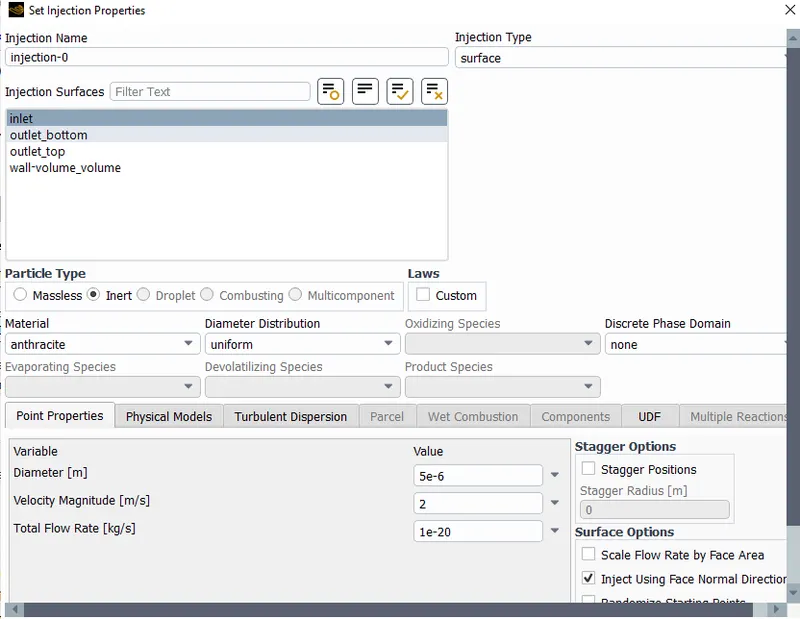
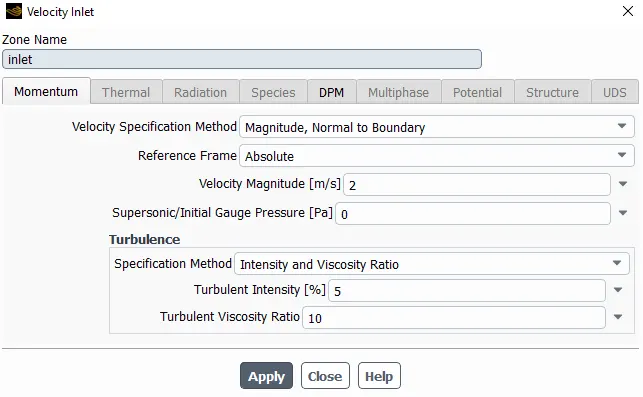
Please refer the below photo for the residuals obtained.
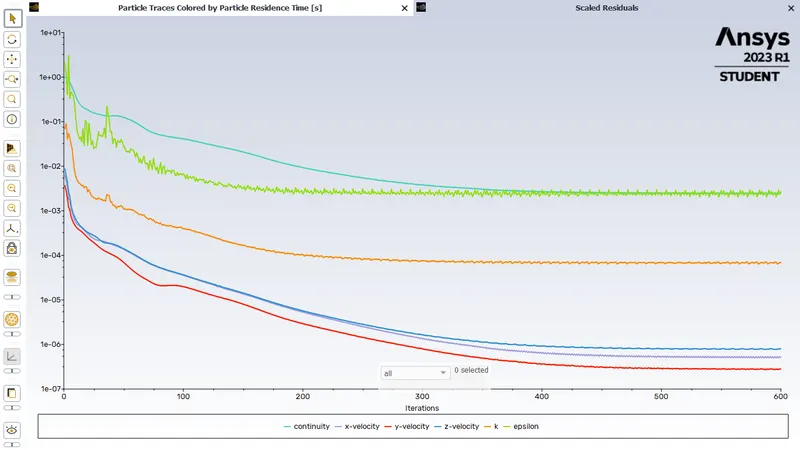
Please refer the below photo for the Partical residence time obtained.
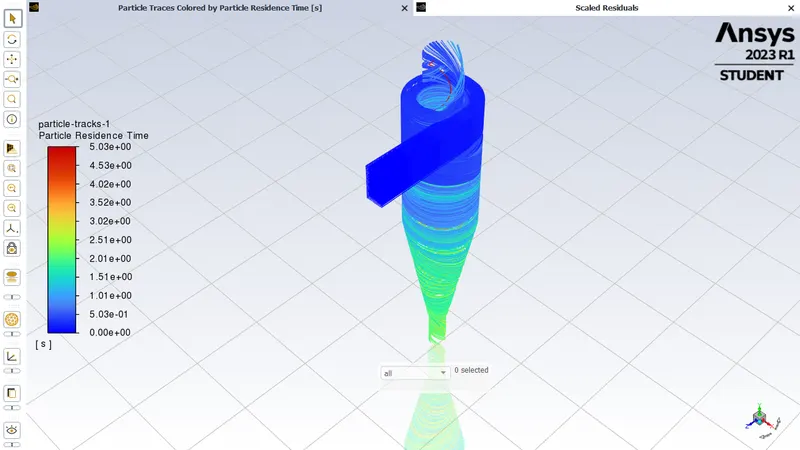
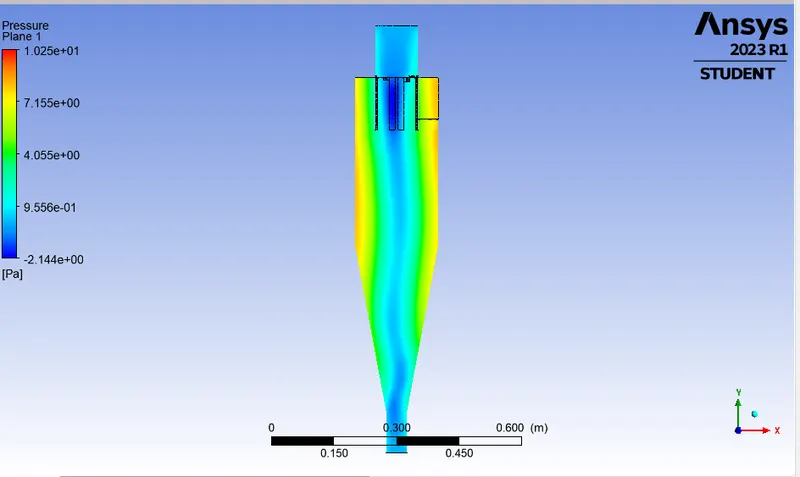
Please refer the below photo for the Pressure distribution in XY plane of the cyclone seperator obtained. Near the wall of the cyclone seperator the pressure is high due to centrifugal force.
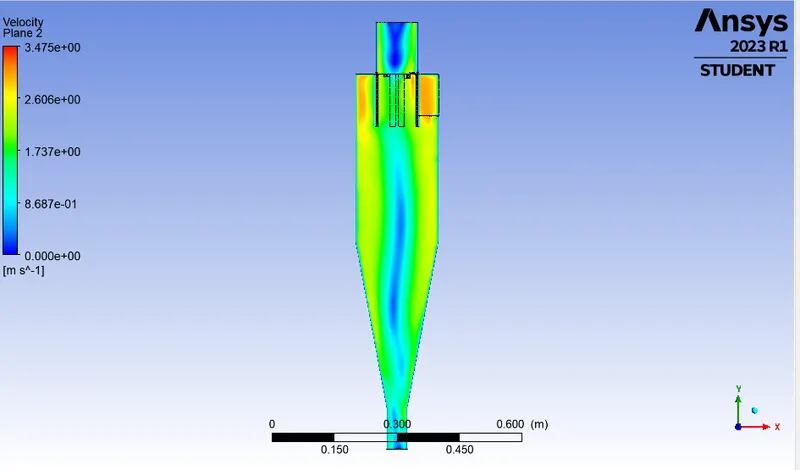
Please refer the below photo for the velocity distribution in XY plane of the cyclone seperator obtained. Near the wall of the cyclone seperator the velocity is high due to centrifugal force.
Please refer the below photo for the Vortex core region obtained.
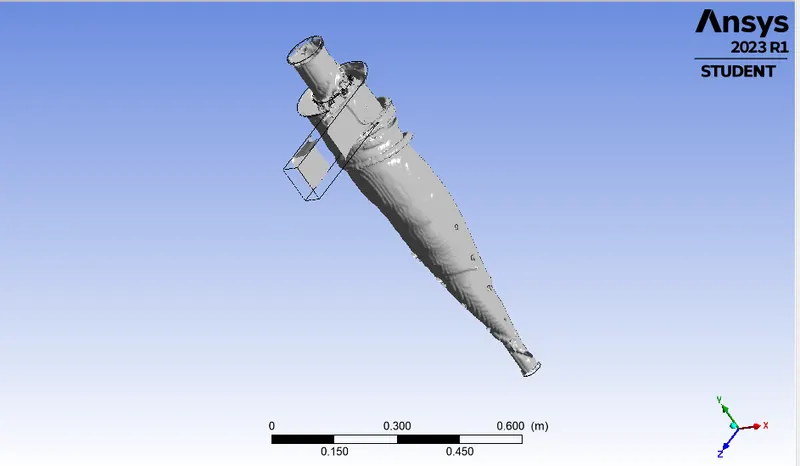
Please refer the below animation for the Constant Flow velocity / particle velocity of 3 m/s and Varying Partical Size of 5 μm simulated.
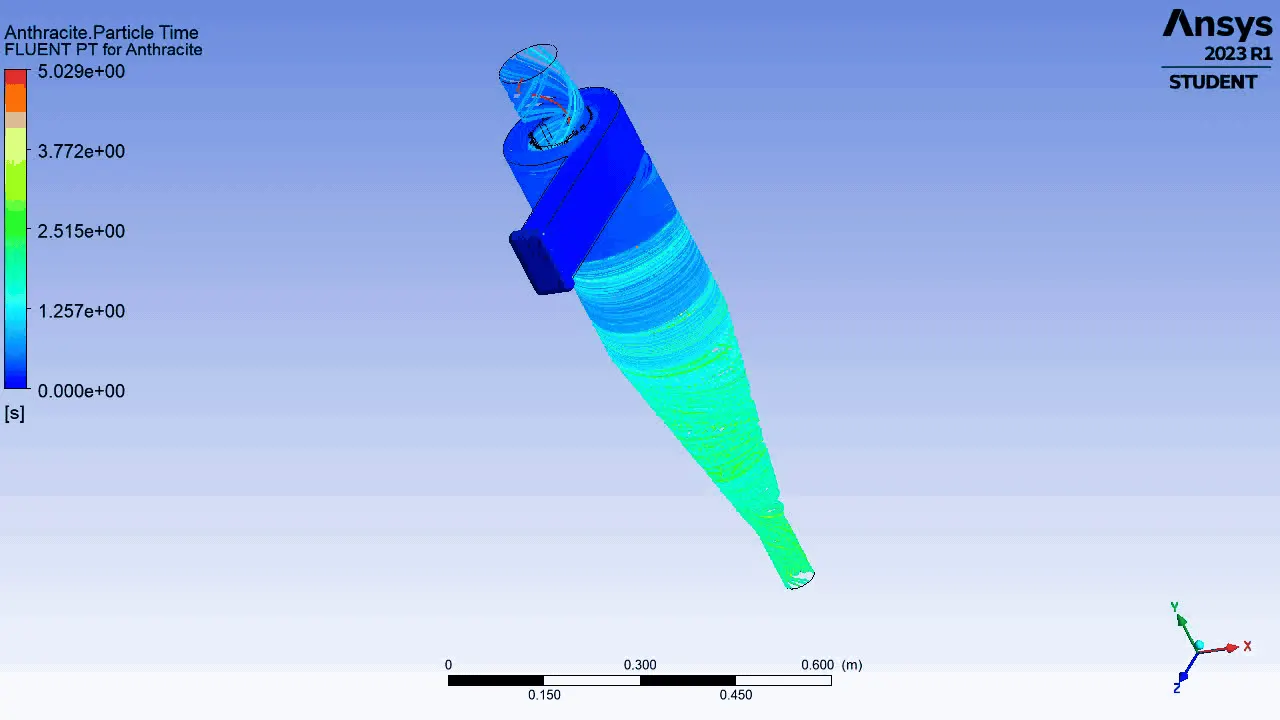
Please refer the below photo for the results obtained.
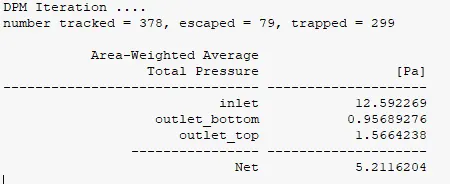
i) Collection or Separation efficiency = (No of particle trapped)/ (No of particles tracked)
Collection or Separation efficiency =(299)/(378)
Collection or Separation efficiency =0.791x100
Collection or Separation efficiency =79.10%.
ii) Pressure difference= (Total inlet pressure)-(Total Outlet top pressure)
Pressure difference=12.592-1.566
Pressure difference=11.026 Pa
Case 2.5: Constant Partical Size of 5 μm and Varying Flow velocity / particle velocity 1 m/s.
Please refer the below photo for the Set-up applied for the case 2.5
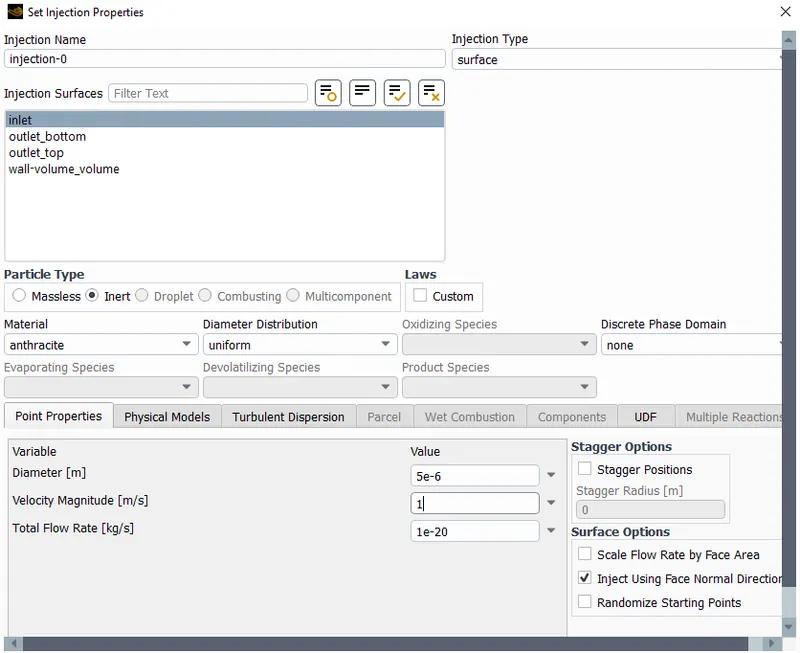
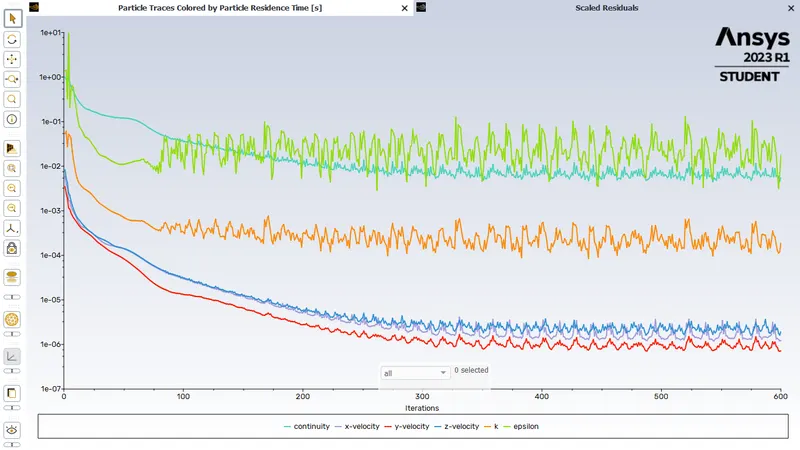
Please refer the below photo for the residuals obtained.
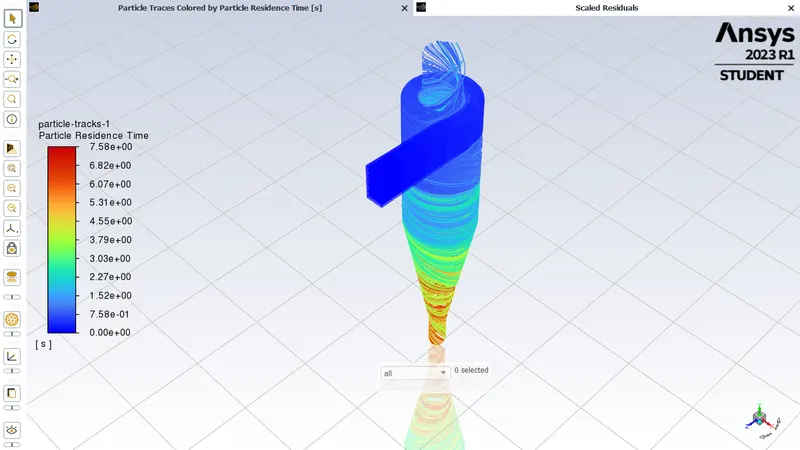
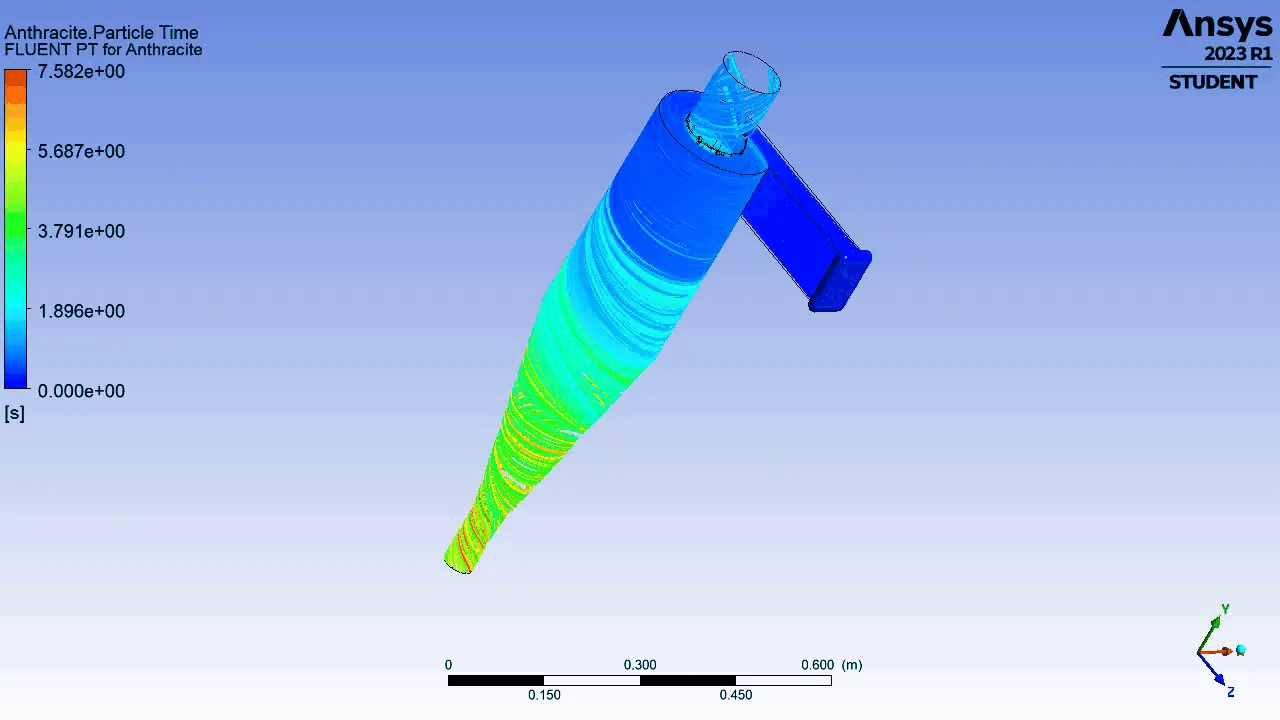
Please refer the below photo for the Partical residence time obtained.
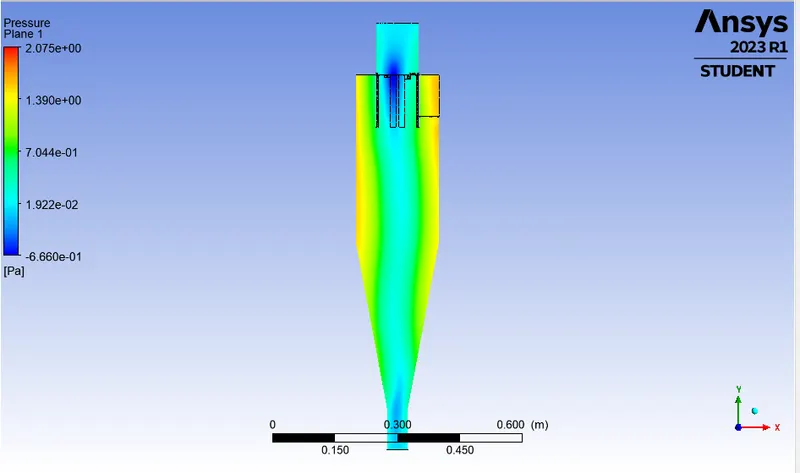
Please refer the below photo for the Pressure distribution in XY plane of the cyclone seperator obtained. Near the wall of the cyclone seperator the pressure is high due to centrifugal force.
Please refer the below photo for the velocity distribution in XY plane of the cyclone seperator obtained. Near the wall of the cyclone seperator the velocity is high due to centrifugal force.
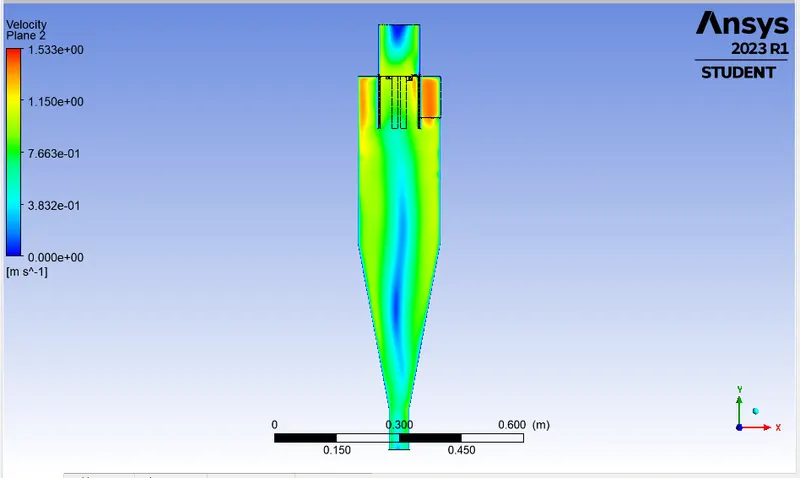
Please refer the below photo for the Vortex core region obtained.
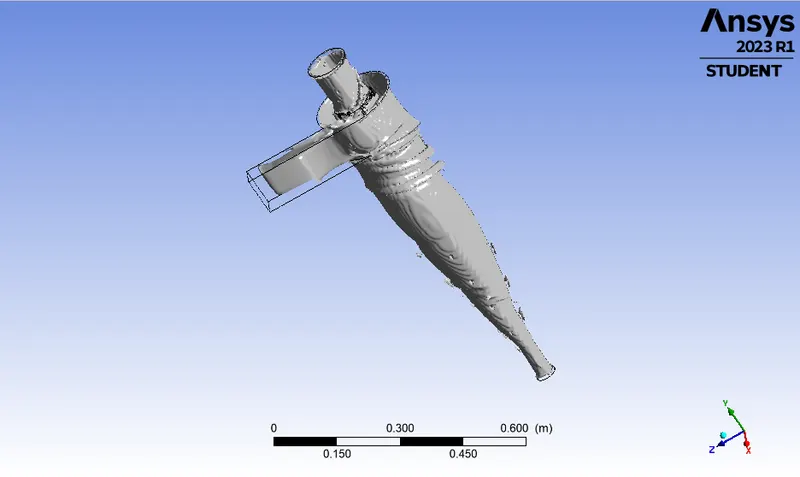
Please refer the below animation for the Constant Flow velocity / particle velocity of 1 m/s and Varying Partical Size of 5 μm simulated.
Please refer the below photo for the results obtained.
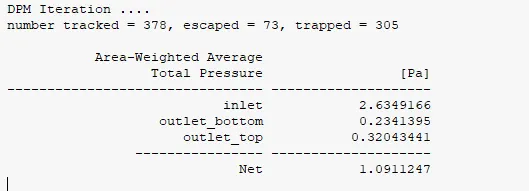
i) Collection or Separation efficiency = (No of particle trapped)/ (No of particles tracked)
Collection or Separation efficiency =(305)/(378)
Collection or Separation efficiency =0.8069x100
Collection or Separation efficiency =80.69%.
ii) Pressure difference= (Total inlet pressure)-(Total Outlet top pressure)
Pressure difference=2.634-0.320
Pressure difference=2.314 Pa
Please refer the below table for the results obtained:
Results discussion:
- The collection efficiency of cyclones varies as a function of particle size, density, and cyclone design. Cyclone efficiency will generally increase with the increase in particle size, density, inlet duct velocity, cyclone body length, number of gas revolutions in the cyclone, the ratio of cyclone body diameter to gas exit diameter, inlet dust loading, smoothness of the cyclone inner wall.
- Due to higher pressure near the wall low-pressure region is created at the center of the cyclone separator because of which the lighter particles escape from the top outlet and heavier particles are collected at the bottom outlet.
- The collection efficiency of the cyclone separator is related to the pressure drop across the cyclone. Here pressure drop is the indirect measure of the energy required for the gas to move the particles. Pressure drop is related to the inlet velocity of air and particle size.
- From the observations of cases 1 & cases 2, we can conclude that Separation efficiency of Cyclone Separator depends on both Diameter of Particles and also on the Velocity of the Particles.
- Efficiency of a Cyclone Separator has direct effect on the Pressure Drop. Higher the Velocity, higher the Pressure Drop and highest the Efficiency
- Pressure drop only depends on the velocity of the particulate. As the velocity increases the pressure difference between inlet and outlet pressure increases.
- The main reason for the Pressure Drop is due to expansion of gas in the cyclone chamber, rotational energy and wall frictional force.