Week 7 - CHT Analysis on a Graphics card
Challenge No-6 Graphics Card Simulation.
Aim – Perform a steady state conjugate heat transfer analysis on a model of a graphics card.
Challenge Objective –
01. Run the simulation by varying the velocity from 1m/sec to 5m/sec for at least 3 velocities and discuss the results.
02. Find out the maximum temperature and heat transfer coefficient attained by the processor.
03. Prove that the simulation has achieved convergence with appropriate images and plots.
04. Identify potential hotspots on the model.
Objective – Conjugate heat transfer refers to the combined analysis of both fluid flow and heat transfer in systems where there are solid structure interacting with the fluid flow, leading to heat transfer between the solid structure and the surrounding fluid.
In traditional heat transfer analysis, such as in convective heat transfer analysis, only the heat transfer with in the fluid domain is considered, neglecting the thermal interaction with solid structure. However, in many real world scenarios, such as in electronics cooling, engine cooling and industrial processes, the interaction between solid components and surrounding fluid significantly affects the overall heat transfer behavior.
CHT analysis is crucial in understanding these systems accurately because it accounts for the thermal conduction with in solid structure as well as the convective heat transfer between the fluid and the solid surfaces. This enables engineers to predict more realistic temperature distribution, optimize design for better performance and ensure the structural integrity of components subjected to thermal loads.
CHT analysis finds applications in various fields including aerospace engineering, automotive engineering, electronics cooling, power generation and industrial processes. Computational fluid dynamics coupled with the heat transfer solver in commonly used to perform conjugate heat transfer simulation, allowing engineers to simulate complex fluid flow and heat transfer phenomena accurately.
Geometry in space claim – We have to do some operation in the predefined geometry.
01. Insert a plain in ‘z’ axis and split the geometry in to half
Enable the geometry share ready by ‘share prep’ in the work bench

01. For calculating the heat generation for the processor. We have to calculate the dimensions of the processor. It is 8 x 8 x 1 = 64 mm
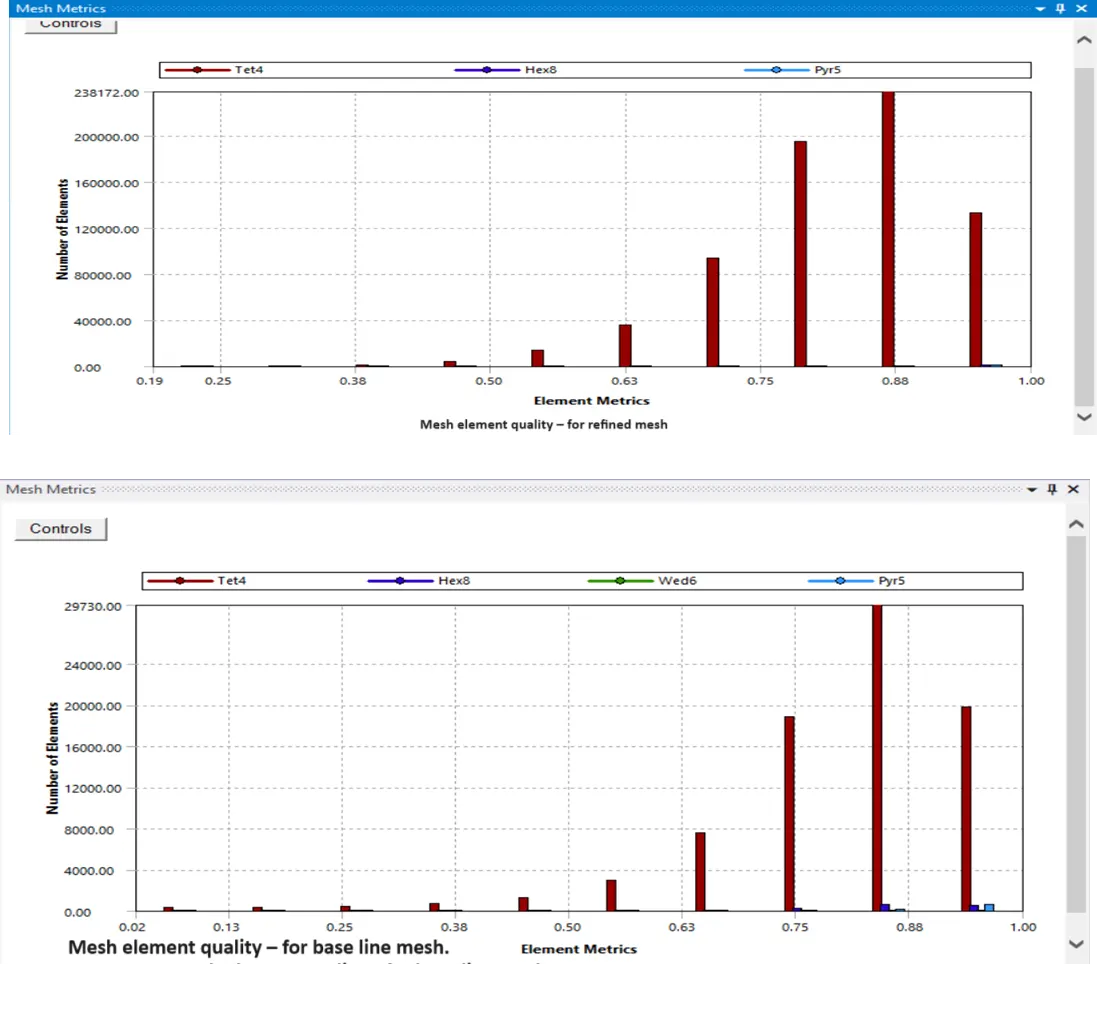
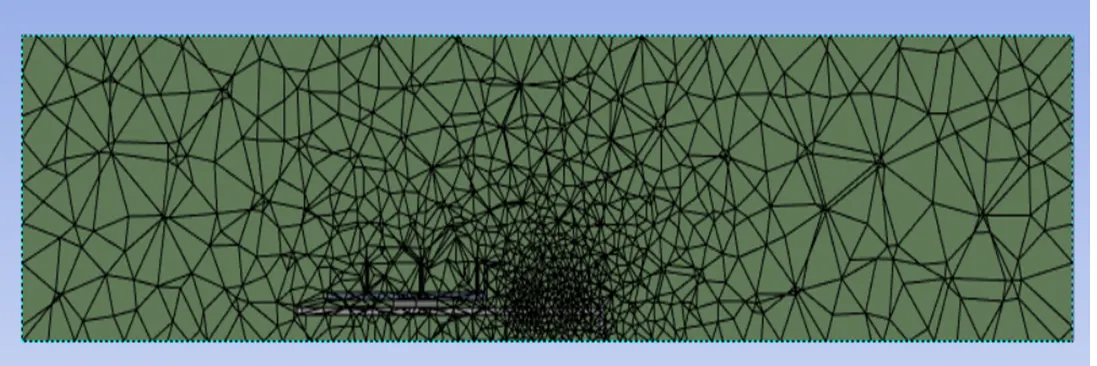
Meshing Creation – For mesh creation & named selection, we have to select the faces as per the location & name them accordingly. For simulation activity, firstly it was done with base line mesh. And then by refined mesh.
Base line mesh parameters –
01. Total mesh element numbers – 83625
02. Base line mesh element size – 0.010 m.
Refined mesh parameters –
01. Total mesh element numbers – 715773.
02. Processor mesh size – 0.0005 m
03. Fins mesh size – 0.0005 m
01. Base mesh size – 0.0005 m
02. Body walls mesh size – 0.250 m
03. Minimum mesh quality – 19 %.
Total names selection –
01. Inlet
02. Outlet
03. Walls
04. Fins walls
05. Fins volume
06. Processor volume
07. Base walls
Base volume
Simulation Setup & Solution –
Step 1 - Perform mesh check.
Step 2 - Material creation
01. For fluid – Air (with default properties)
02. For Solid – Aluminum, Steel, Gold (With default properties)
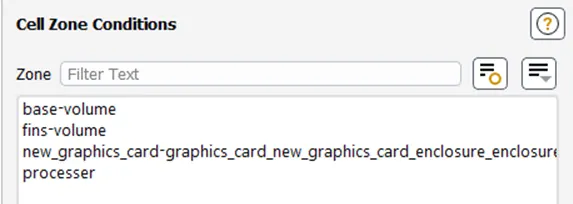
Step 3 – Defining Cell zone condition (Material Selection for graphics card body)
01. Base Volume – Steel
02. Fins Volume – Aluminum
03. Processor – Silicon
Encloser Walls – Air
Material selection for the different cell zone used to be done here only.
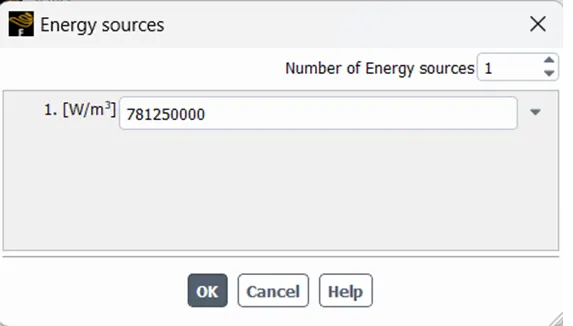
Defining heat source in the processor – The processor is assumed to be powered with 50 W supply and further it is assumed that entire power is converted into heat energy. Therefore, from simple energy density calculation we can determine the thermal source term.
S – 50W/0.000000064 = 78,12,50,000 W/m^3.
Step 4 - Setup Boundary condition – Define the inlet & outlet air condition, through boundary condition defining. It should be start from inlet to outlet.
Step 5 – Hybrid initialization & defining contours.
Step 6 – Define proper definition
01. Area weighted average for Heat transfer coefficient for ‘Fins’
02. Vertex average of temperature at ‘Monitor point’ placed inside the processor.
Simulation & Post Processing – BASE LINE MESH
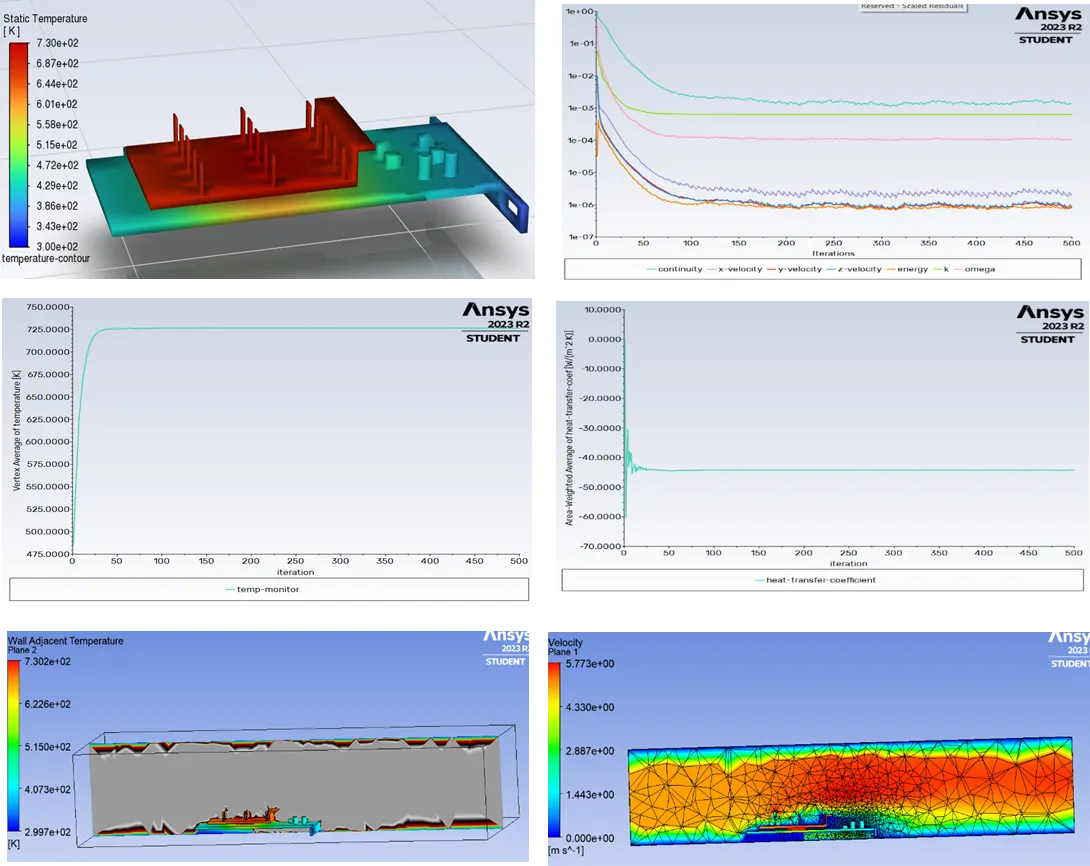
Case -1 With Base line mesh setup.
Air Velocity – 5 m/s
Total numbers of mesh count – 83625.
Area weighted average of heat transfer coefficient (Fins Volume) – - 44.221 [W/(m^2 K)]
Monitor point temperature - 726.37976 [K]
Case -2 With Base line mesh setup.
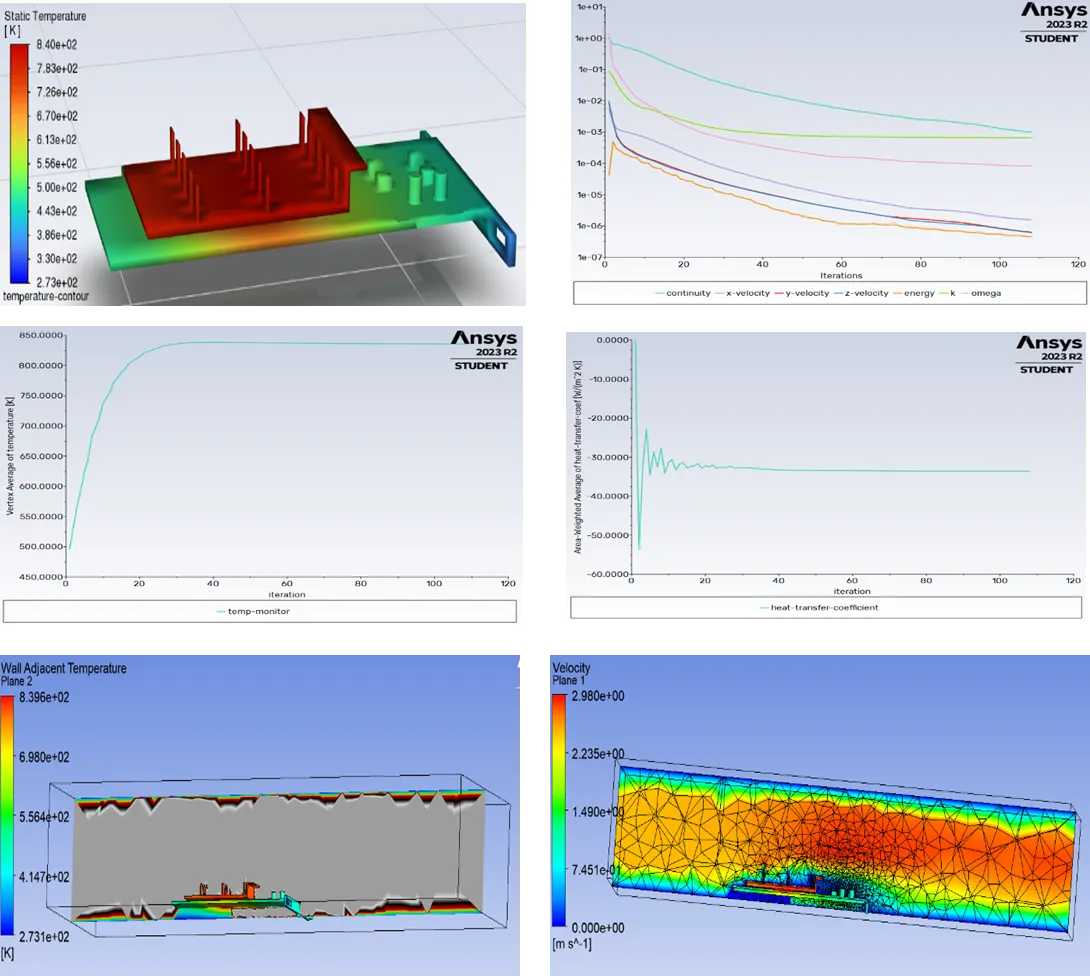
Air Velocity – 2.5 m/s
Total numbers of mesh count – 83625.
Area weighted average of heat transfer coefficient (Fins Volume) – -33.591232 [W/(m^2 K)]
Monitor point temperature - 835.57715 [K]
Case -3 With Base line mesh setup.
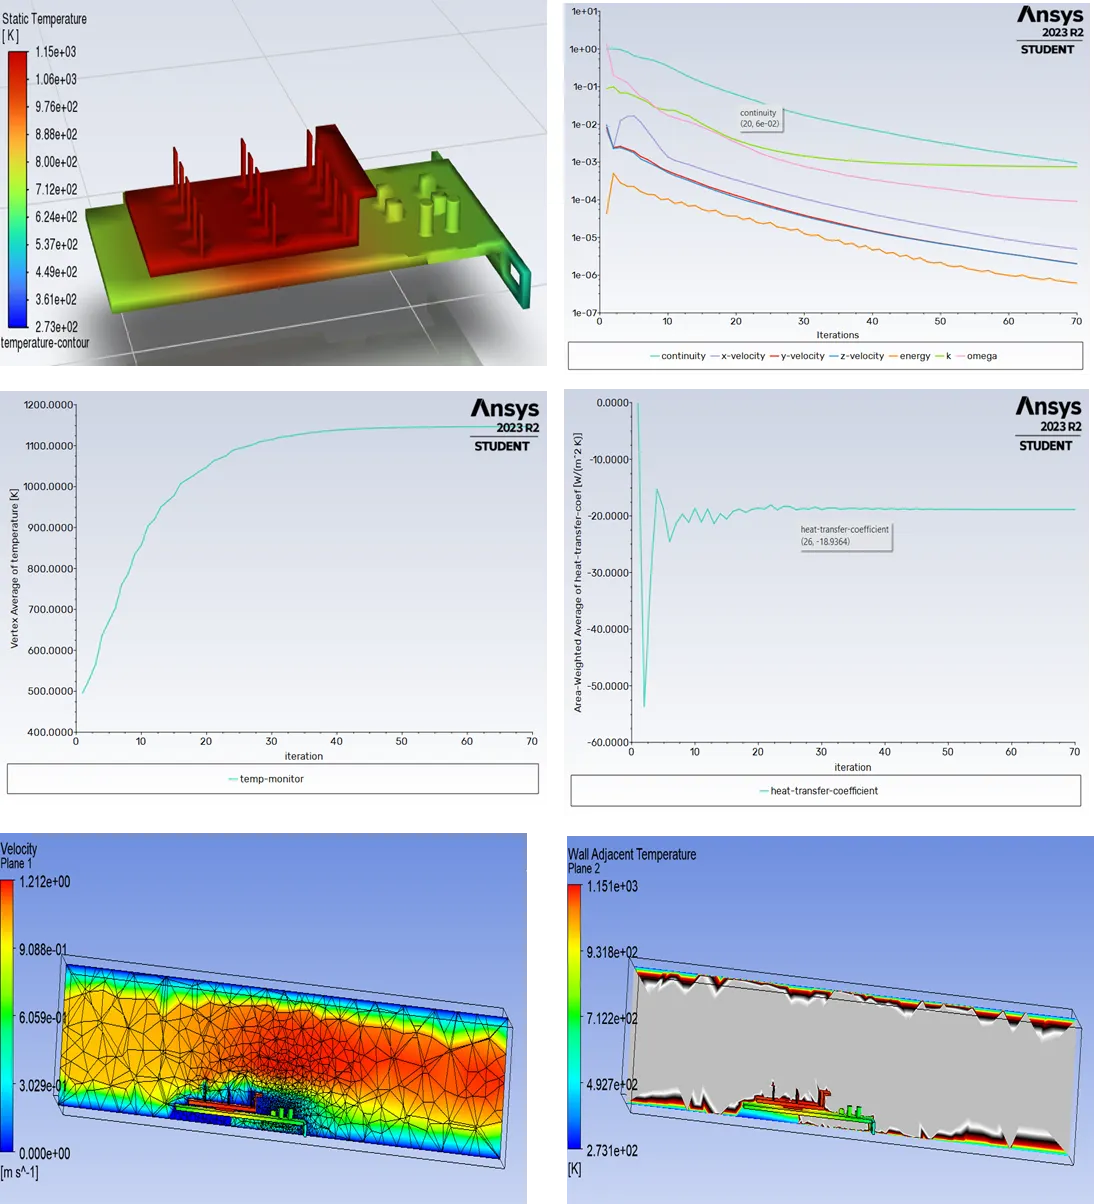
Air Velocity – 1 m/s
Total numbers of mesh count – 83625.
Area weighted average of heat transfer coefficient (Fins Volume) – -18.882498 [W/(m^2 K)]
Monitor point temperature - 1146.6759 [K]
REFINED MESH
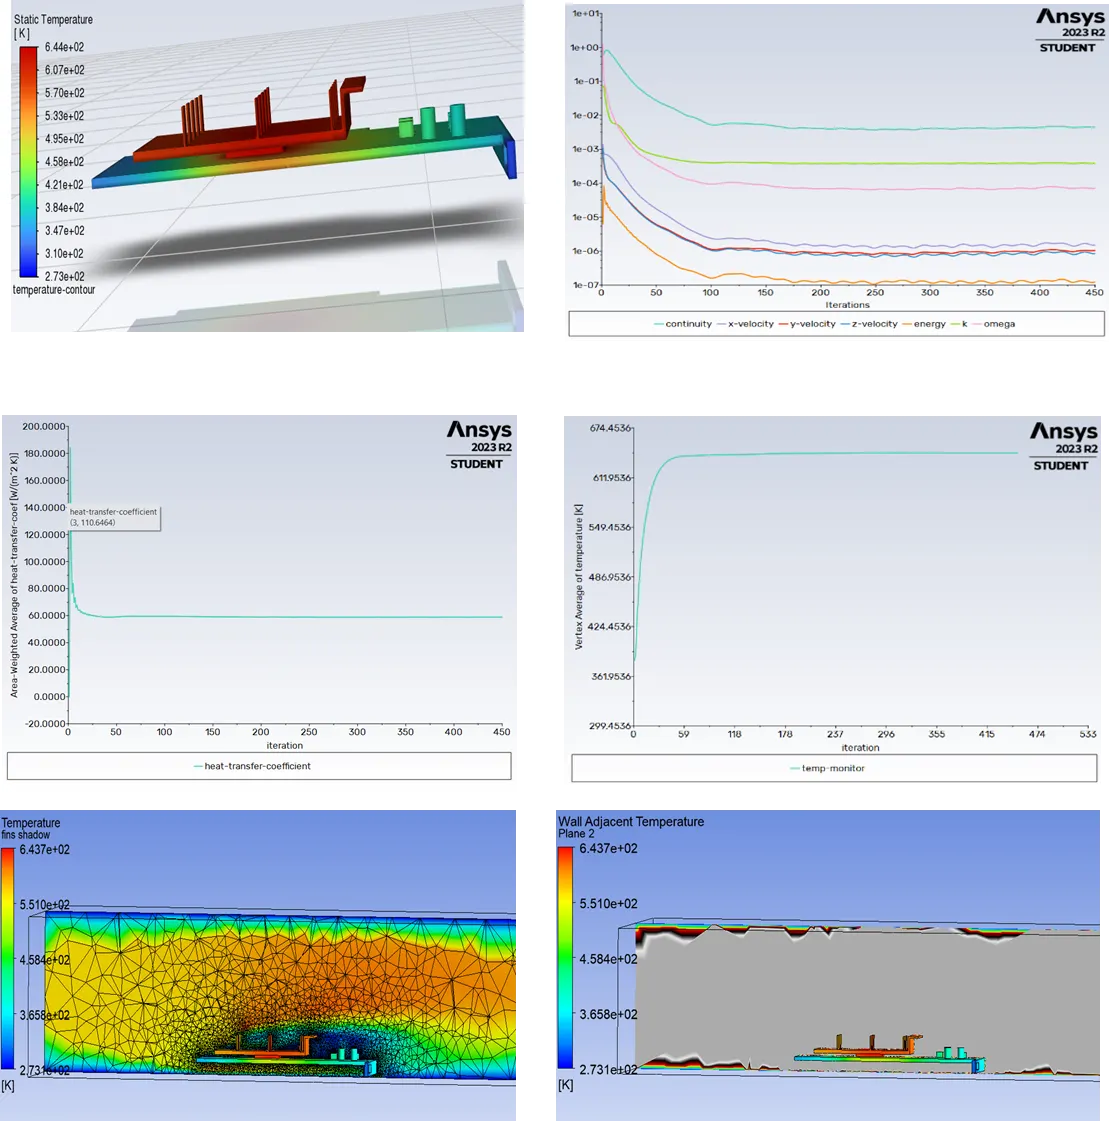
Case – 1 with refined mesh setup.
Air Velocity – 5 m/s
Total numbers of mesh count – 715773
Heat transfer coefficient – 58.868909 W/m^2 K
Monitor Point temp – 642.96 K
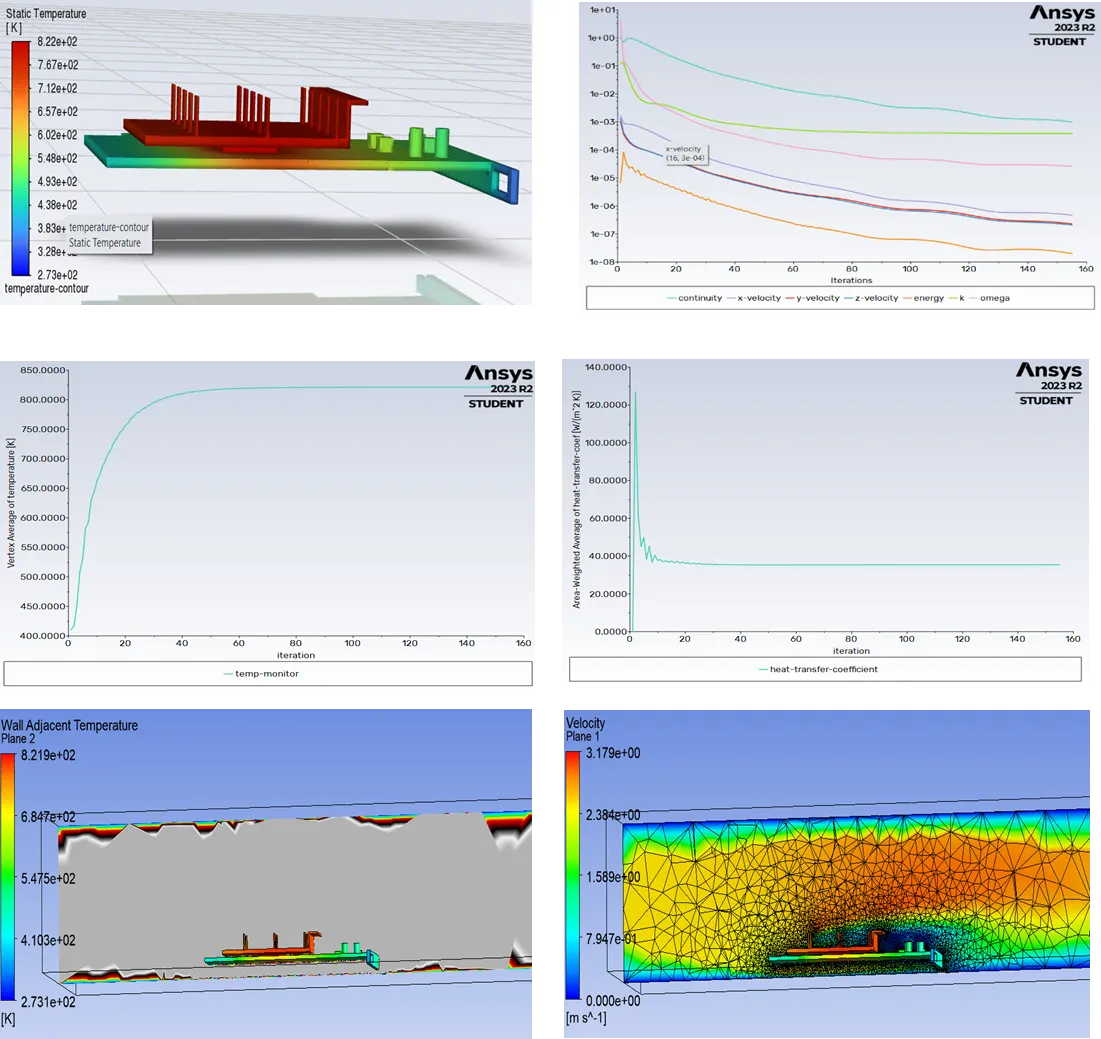
Case – 2 with refined mesh setup.
Air Velocity – 2.5 m/s
Total numbers of mesh count – 715773
Heat transfer coefficient – 35.405139 W/m^2 K
Point temp – 821.29065 K
heat-transfer-rate
-------------------
Total Heat Transfer Rate [W]
-------------------------------- -------------------
heat-transfer-rate 29.104102
User Energy Source 50
---------------- -------------------
Net 79.104102
Case – 3 with refined mesh setup.
Air Velocity – 1 m/s
Total numbers of mesh count – 715773
Heat transfer coefficient – 17.502309 W/m^2 K
Point temp – 1213.6467 K
Heat transfer rate - 25.761279
Total Heat Transfer Rate [W]
-------------------------------- -------------------
total-heat-transfer-rate 25.761279
User Energy Source 50
---------------- -------------------
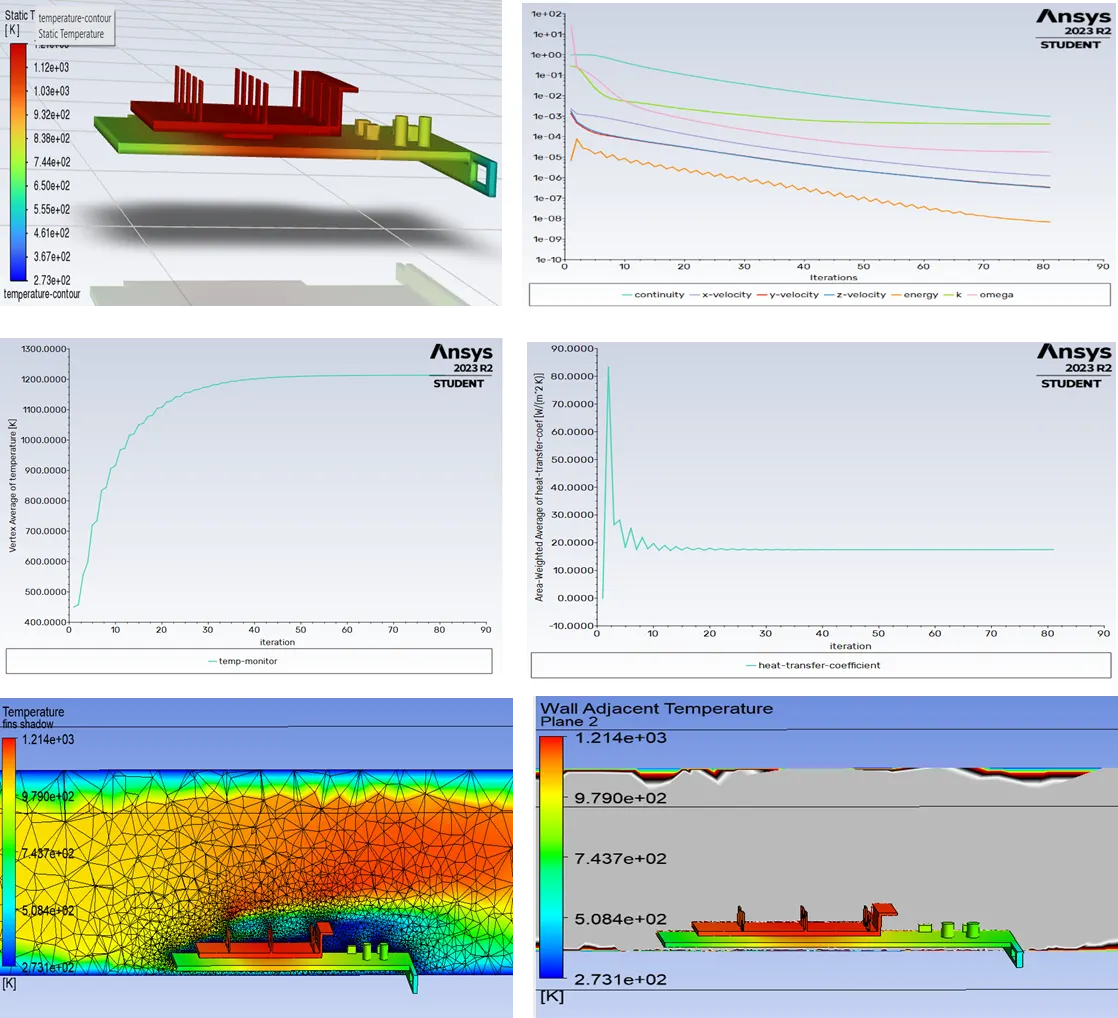 Net 75.761279
Conclusion –
From the above plots and contours we note that the following observations.
01. Residuals do not provide information on the convergence to the steady state flow.
02. From the above plot, we have noticed that as the air velocity is decreasing, we are noticing higher temperature on the other portion of the geometry.
03. From the below table & differences between the base line mesh & refined mesh, it was observed that there is no major differences between the monitor point temperature.
04. But the coefficient of heat transfer is showing in negative in the base line mesh setup and positive in the refined mesh. So we can conclude that increasing the numbers of cells & reducing the mesh length is showing positive results.
05. From the below results, it can be concluded that while reducing the incoming velocity of the air is resulting the higher monitor point temperature & reduction in the over all heat transfer coefficient.
06. From the above conclusion that it was fully worth it with simulation over refined mesh.
|
Case No |
Definition |
Base Line mesh |
Refined Mesh |
|
1 |
Mesh Count |
83625 |
715773 |
|
Monitor point temperature [k] |
726.37976 |
642.96 |
|
|
inlet air velocity [m/s] |
5 |
5 |
|
|
Coefficient of heat transfer[W/(m^2 K)] |
-44.221 |
58.868909 |
|
|
2 |
Mesh Count |
83625 |
715773 |
|
Monitor point temperature [k] |
835.57715 |
821.29065 |
|
|
inlet air velocity [m/s] |
2.5 |
2.5 |
|
|
Coefficient of heat transfer[W/(m^2 K)] |
-33.591232 |
35.405139 |
|
|
3 |
Mesh Count |
83625 |
715773 |
|
Monitor point temperature [k] |
1146.6759 |
1213.6467 |
|
|
inlet air velocity [m/s] |
1 |
1 |
|
|
Coefficient of heat transfer[W/(m^2 K)] |
-18.882498 |
17.502309 |