Week 6 - Data analysis
Aim:
Data visualizer
- Your script should take column numbers as the input and plot the respective columns as separate images.
- Each file should be saved by the name of the column.
- The plot labels should be extracted from the file. If, I request for a plot between column 1 (crank angle) and column 8(volume), then the label information should automatically be extracted and must appear as labels in the plots. THIS SHOULD NOT BE DONE MANUALLY.
Compatability check
- You code should exit gracefully, if a non-compatible file is provided as an input. It should say something like "File not recognized. Please provide a valid CONVERGE output file".
Basic performance calculation
- Calculate the area under the P-V diagram. P is in column 2 and V is in column 8.
- Calculate the power output of this engine. Assume that RPM is 1500
- This engine consumed 20 micro grams of fuel (per 1 stroke cycle). Calculate its specific fuel consumption.
#CONVERAGE data file:
Attached to the challenge problem Link to data file (engine_data).
Python code for Data analysis:
"""
Demonstrating file parsing in python
by velama girish
"""
#import module
import matplotlib.pyplot as plt
#basic initialisation
line_count = 1
crank = []
pressure = []
# File parsing starts here
for line in open('engine_data.out'):
if '#' not in line:
crank.append(float(line.split()[0]))
pressure.append(float(line.split()[1]))
line_count = line_count+1
#figure
plt.plot(crank, pressure, linewidth=3)
plt.xlabel('crank')
plt.ylabel('pressure')
plt.show()
Output:
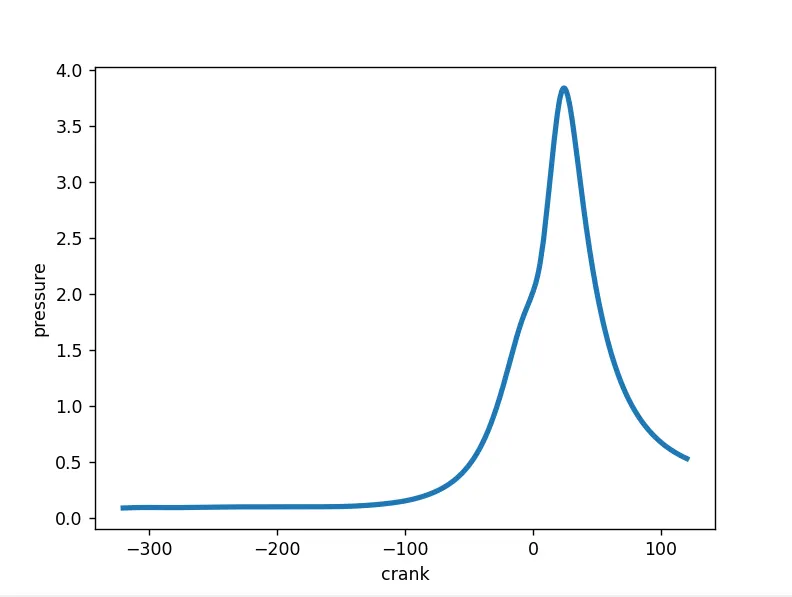
Compatability check:
import math
import matplotlib.pyplot as plt
import numpy as np
from scipy.integrate import simps
#Compatibility check
open('engine_data.out')
# Creating an empty array to store the values of Volume and pressure respectively
Volume = []
pressure = []
line_count = 1
for line in open('engine_data.out'):
if '#' not in line:
Volume.append(float(line.split()[7]))
pressure.append(float(line.split()[1]))
line_count = line_count + 1
#plotting p-v diagram
plt.plot(Volume, pressure, linewidth = 2, color = 'b')
plt.xlabel('Volume')
plt.ylabel('pressure')
plt.title("p-v diagram of engine")
plt.show()
Output:
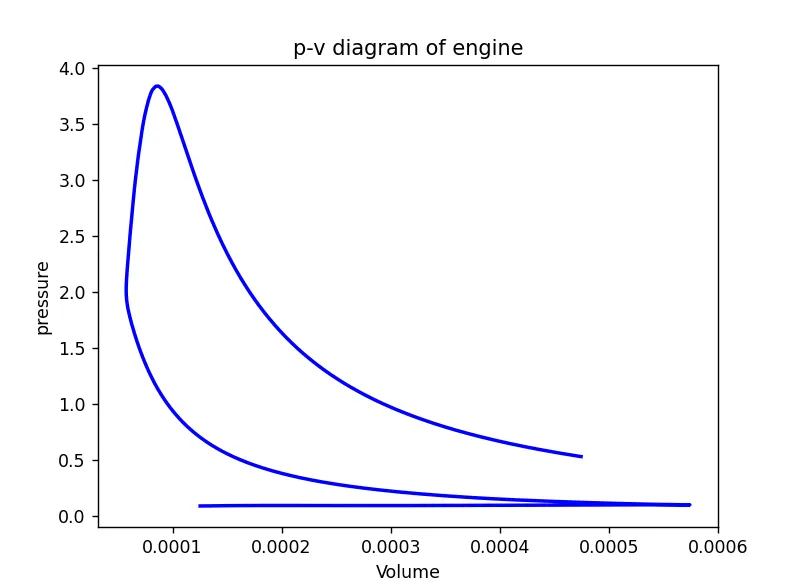
For the compatability check we use:
import math
import matplotlib.pyplot as plt
import numpy as np
from scipy.integrate import simps
#Compatibility check
fname = input("engine_data:")
if fname == 'engine_data.out':
print('file is valid')
else:
print('file is invalid')
exit()
def compatibility_check(a):
if 'CONVERGE' not in a:
print('Please provide converge output file to process')
exit()
else:
print('Compatibility check is successful')
pass
Output:
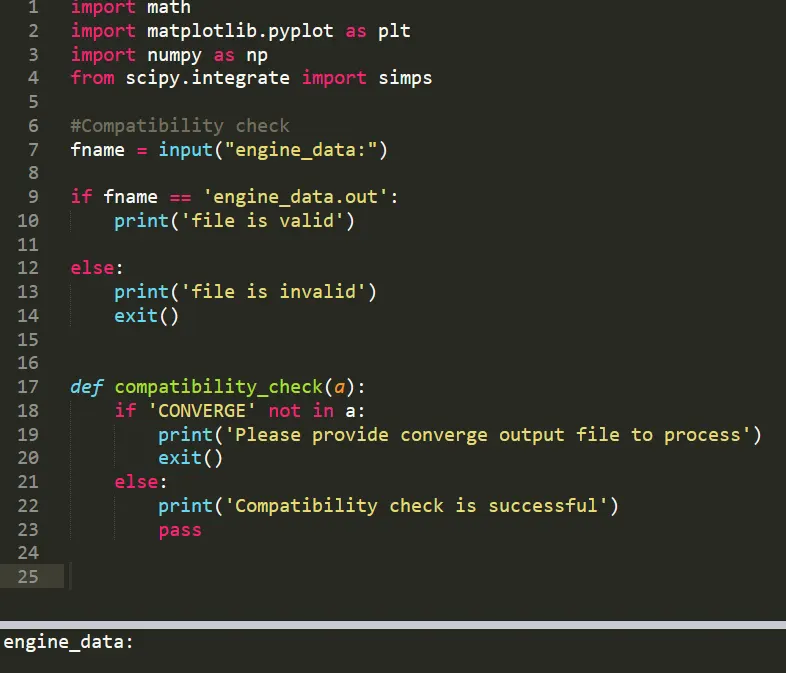
Python code for power output for the engine:
import math
import matplotlib.pyplot as plt
import numpy as np
from scipy.integrate import simps
#Compatibility check
open('engine_data.out')
# Creating an empty array to store the values of Volume and pressure respectively
Volume = []
pressure = []
line_count = 1
for line in open('engine_data.out'):
if '#' not in line:
Volume.append(float(line.split()[7]))
pressure.append(float(line.split()[1]))
line_count = line_count + 1
#plotting p-v diagram
plt.plot(Volume, pressure, linewidth = 2, color = 'b')
plt.xlabel('Volume')
plt.ylabel('pressure')
plt.title("p-v diagram of engine")
plt.show()
# Inputs
# Speed of an Engine
rpm = 1500
rps = 1500/60
stroke_cycle = rps/2
# Fuel consumption in micrograms per 1 stroke cycle
fuel_consumption = 20
# Engine specifications
# Number of cylinder
n = 1
# 4 stroke engine
# Calculation of power output and Specific fuel consumption
power_output = n*stroke_cycle/(1000)
print('power output from engine : ' + str(power_output) + 'KW')
SFC = (fuel_consumption*pow(10,-6)*stroke_cycle*3600)/(power_output*1000)
print('Specific Fuel consumption, SFC = ' + str(SFC) + ' (kg/hr)/KW')
print('t')
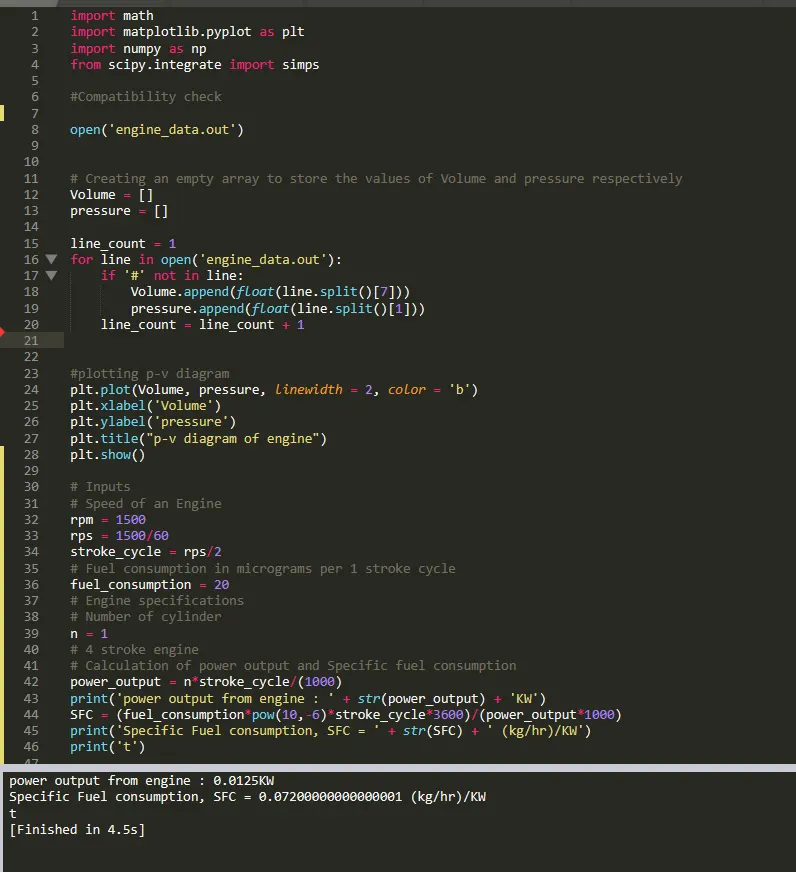
Result:
power output from engine: 0.0125 KW
specific fuel consumption, SFC = 0.07200000000000001 (kg/hr)/kwt