Week 5 - Curve fitting
Popt and pcov fuctions actually used for:
popt, pcov = curve_fit(func), The function returns an array popt and pcot with the optimal parameters obtained using a non-linear least squares.
np.array(temperature):
The diagonals provide the variance of the parameter estimate. And, the curve fit function returns two values, popt and pcov popt returns the value if co-efficient of the polynomial used and pcos refers to the co-variance of these coefficients. #2. np.array (temperature) it is an array to store values of different temperature.
*in*popt:
The popt argument is the 'best-fit parameters for Coefficients' defined in the function for the curve fit. The popt holds the Coefficients.
In order to make the curve fit perfect:
we must consider error 'estimates' as well. Perfect fit means, the curve should fit the original curve without showing any errors.
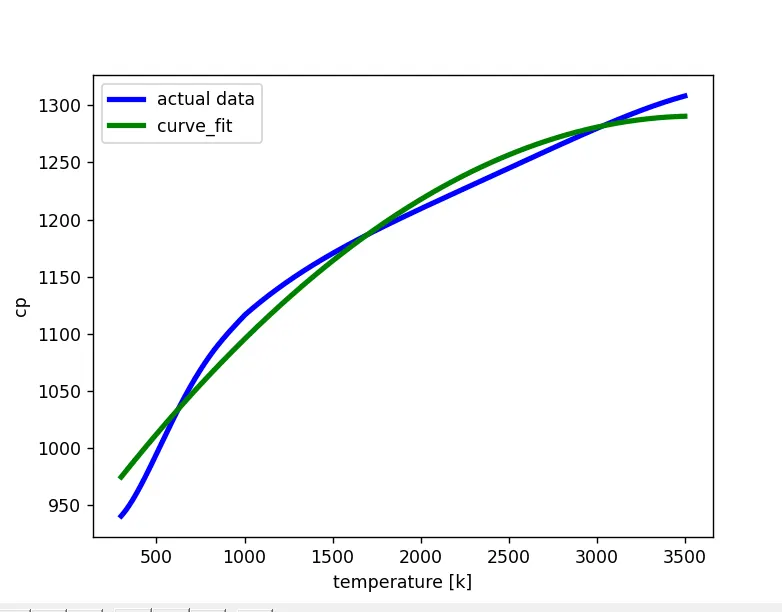
Actual curve fitting code:
import numpy as np
import matplotlib.pyplot as plt
from scipy.optimize import curve_fit
# curve fit function
def func(t,a,b,c):
return a*pow(t,2) + b*t +c
# Reading thermodynamic data file
def read_file():
temperature = []
cp = []
for line in open('data', 'r'):
values = line.split(',')
temperature.append(float(values[0]))
cp.append(float(values[1]))
return [temperature, cp]
# main program
temperature, cp = read_file()
popt, pcov = curve_fit(func, temperature, cp)
fit_cp = func(np.array(temperature), *popt)
plt.plot(temperature, cp, color='blue', linewidth=3)
plt.plot(temperature, fit_cp, color='green', linewidth=3)
plt.legend(['actual data', 'curve_fit'])
plt.xlabel('temperature [k]')
plt.ylabel('cp')
plt.show()
Result: