


Courses by Software
Courses by Semester
Courses by Domain
Tool-focused Courses
Machine learning
POPULAR COURSES
Success Stories

Week 6 - CHT Analysis on a Graphics card
Video rendering card Video rendering card is responsible for accelerating the rendering of graphics on display. And it continuously takes electric energy and dissipates the heat energy like a hot heat sink. Also if heat dissipation is not managed the rendering processes may fail, reduce time to render or in the worst conditions…
saurabh talele
updated on 23 Aug 2021


Video rendering card
Video rendering card is responsible for accelerating the rendering of graphics on display. And it continuously takes electric energy and dissipates the heat energy like a hot heat sink.
Also if heat dissipation is not managed the rendering processes may fail, reduce time to render or in the worst conditions it may burn out and the total product and it may take flame, so it’s necessary to dissipate heat into cold heat sink through some design like fins which is connected to an upper surface of the processor.
Problem statement description, method, application and limitation of the following simulation
This problem comes under fluid mechanics and heat transfer with the name of Conjugate heat transfer simulation in which solid generate fluid it conducted heat from one place to another place with a combination of cold fluid flow across that body to cool that body by convection.
Conjugate heat transfer simulation used in application or comes handy in boiler design, reactor design muffler design, computer processor design, internal combustion engine design, solar panel design, rocket nozzle design, muffler design, high performance computing centre ventilation design, high volume air conditioning products design, refrigeration design etc.
Problem statement description limitation of the following simulation
In this simulation graphics card is under forced air condition of air which having velocity of 1, 4,7 metre per second. Processor is generation heat of 156250000 w/m^3 of energy because of a processor having a volume of 6.4*e8 m^3 with it consumes 10-watt energy continuously. So processor conducts heat to fins and base plate and whole assembly of base plate processor and fins are subject to forced air in which air taking heat off from assembly.
Also in this simulation only aluminium is only material is taken under consideration for processor, fins and base plate and only three type of mesh with 10.28,2,1.5 mm is simulated and that is only limitation. Also checking whether simulation converged or not and maximum temperature in fins and heat transfer coefficient
Geometry
Below image shows complete assembly of graphics card

The below image shows a side view of the inner fluid volume which is used to refined mesh inside the volume.

Below image shows top view dimension of inner fluid volume

Below image shows side view dimension of outer fluid volme
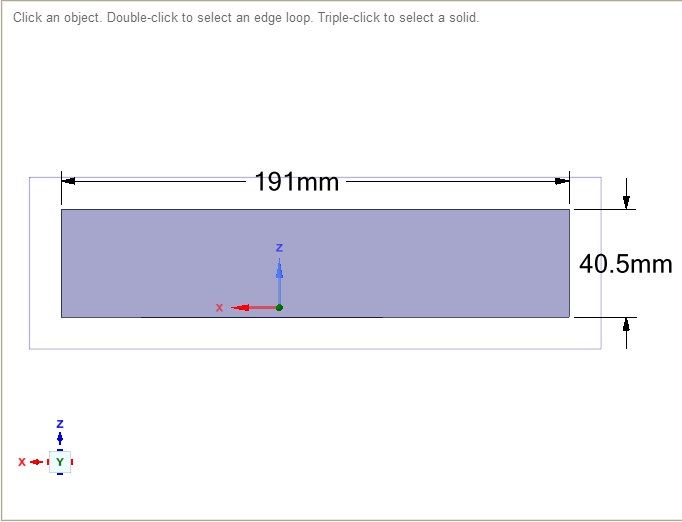
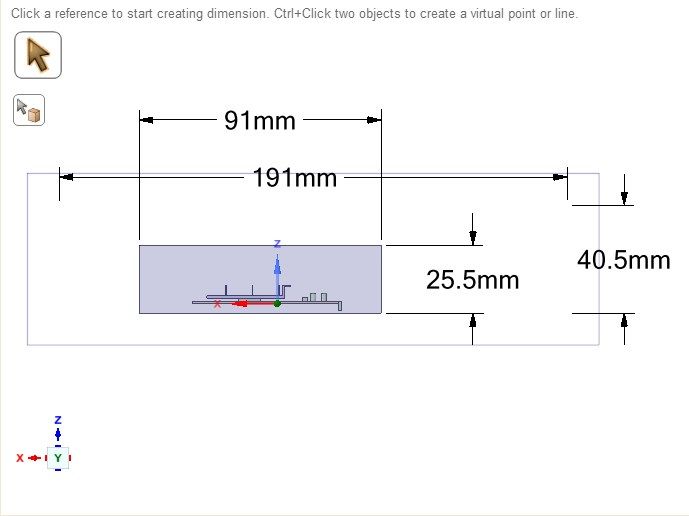
Below image shows side view dimension of outer fluid volume and inner fluid volume
After this Workbench-interface check for multizone mesh generation

below image shows Inlet dimensions

from above area is 2632.832mm^2 and perimeter of 211.01 mm which gives a hydraulic diameter of 0.049m
Mesh
Conformal mesh
a mesh that is generated by share topology which shares common nodes in solid and fluid regions is necessary for this type of simulation.
below mesh shows a conformal mesh of 10.98mm which give a floating point exception error

The below image shows how conformal mesh looks like of 2.5mm is given in global

The below image shows the boundary of fluid volume boundary

The below image shows inlet boundary

The below image shows outlet boundary

The below image shows the processor volume boundary

The below image shows sidewalls

The below image shows fins solid volume

The below image shows the base plate boundary

meshing strategy
The below image shows multizone mesh is set

The below image shows body sizing of 2.5 mm element size given

skewness above 75% mesh in good quality for 1.5mm mesh
below image shows outer of a mesh of whole fluid region

Setup
general setting

energy on and K-E realizable model with enhanced wall treatment

material

aluminium for whole assembly one can add as many materials in simulation and set cell zone condition accordingly

below image shows Air properties of a fluid zone

cell zone condition are like below image

The setting of heat generation source

Inlet condition of 4m/s with 0.049 hydraulic diameter

The below image shows a wall which in contacted with fluid which is actually a couple wall and for every convection wall shadow wall is generated automatically in CHT simulation no need to change any setting its auto generated by softwaer

Results
residuals and max temperature occurrence in fins volume
residuals of mesh size of 2mm mesh inlet 4m/s

from the above image its seen that it's converging after 190 iteration
How one can say convergence occurred?
- by watching residuals
- in conjugate heat transfer simulation if same resulted repeat itself in a cycle or doesn't change by next iteration (solution animation)
- watching particular max temperature in solid volume
watching max temperature in fin solid volume
2 mm mesh 1 m/s inlet condition max temperature occurred in fin volume

from the above image convergence od fin, solid volume max temperature gets varied repeatedly in cycle near 768k means convergence observed at 190 iterations for this 2mm mesh.
2 mm mesh 4 m/s inlet condition max temperature occurred in fin volume

from the above image convergence od fin, solid volume max temperature gets varied repeatedly in cycle near 815k means convergence observed at 180 iterations for this 2mm mesh.
2 mm mesh 7 m/s inlet condition max temperature occurred in fin volume

from the above image convergence od fin, solid volume max temperature gets varied repeatedly in cycle near 819.2k means convergence observed at 170 iterations for this 2mm mesh.
1.5 mm mesh 1 m/s inlet condition max temperature occurred in fin volume

from the above image convergence od fin, solid volume max temperature gets varied repeatedly in cycle near 4957k means convergence observed at 120 iterations for this 1.5mm mesh.
1.5 mm mesh 7 m/s inlet condition max temperature occurred in fin volume

from the above image convergence od fin, solid volume max temperature gets varied repeatedly in cycle near 4908k means convergence observed at 150 iterations for this 2mm mesh.
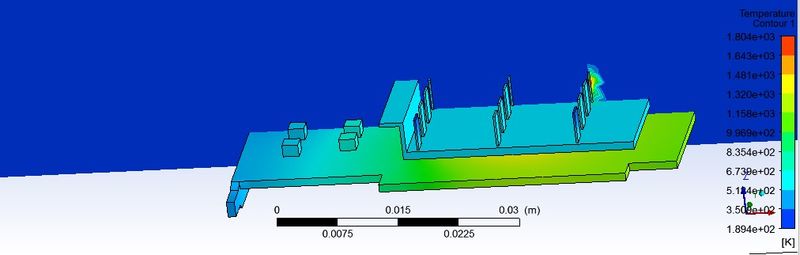
below shows 2mm mesh with 1m/s temperature plane contour and graphics card in the variable set as temperature contor

from the above image its seen that potential hotspot means the max temperature in fin solid is at the back of L shaped fin Also its shown at near fins plane 515k max temperature occurred in air volume due to convection
velocity vector contour on a plane and comparative explanation for 2mm meshes for inlet 1,4,7 meter per seconds respectively for forced air.
below shows 2mm mesh with 1m/s velocity vector on plane

below shows 2mm mesh with 4m/s velocity vector on plane

below shows 2mm mesh with 7m/s velocity vector on plane

from the above image, it observes that fewer circular velocity vectors in one meter per second air for than seven its means there is more time to heat convection to the fluid also back of fins circulatory vectors observed which further leads to the insufficient shape of fins that means the air will not take any heat from solid efficiently.
wall heat transfer coefficient and comparative explanation for 2mm mesh for inlet 1,4,7 meter per seconds respectively for forced air.
below shows 2mm mesh with 1m/s velocity wall fluid volume shadow shows how wall heat transfer coefficient distributed over fins wall

below shows 2mm mesh with 4m/s velocity wall fluid volume shadow shows how wall heat transfer coefficient distributed over fins wall

below shows 2mm mesh with 7m/s velocity wall fluid volume shadow shows how wall heat transfer coefficient distributed over fins wall

From above its observed that as the velocity of air increased from one to seven wall heat transfer coefficient for fin shadow gets increases which means more and more heat drowns by air out of solid by convection.
The below image shows that 2mm mesh with 7m/s with it shows how fluid temperature gets due to increased due to convection and processor temperature wall

Plane of temperature which shows air volume's temperature gets increased near max temperature occurred in fin means its drawing heat with.
2mm mesh with 4m/s with it velocity vector and fins temperature

from the above image, it observes that wake circulatory patter of air behind the fins may cause the insufficient way of geometry design to vacant that circulatory fluid slowly.
Animation of 4 m/s inlet air with 2mm mesh
from the above solution animation, it's observed that solution repeated in a cycle
Results for 1.5 mm mesh for forced air convection of one and seven-meter per second airflow velocity for conductive graphics card
velocity vector contour on a plane and comparative explanation for 1.5mm meshes for inlet 1,7 meters per seconds respectively for forced air.
1.5 mm mesh 1 m/s inlet air velocity vector contour near graphic wall

1.5 mm mesh 7 m/s inlet air velocity vector contour near a graphic wall

from the above image, it observes that behind fins wake is found which also not good for convection because more the fluid attached to solid it will form good boundary layers so that more temperature withdraw from the air.
temperature contour in fluid volume plane and comparative explanation for 1.5mm meshes for inlet 1,7 meters per seconds respectively for forced air.
1.5 mm mesh 1 m/s temperature contour on plane which in fluid volume (shows convection is done by softwaer)

1.5 mm mesh 7 m/s temperature contour on plane wich in fluid volume (shows convection is done by software)
from above its observe that air gets heated by convection nearer by fins in case of one meter per seconds air than the seven-meter per second forced convection, so more the airflow more the convection and solid body cools more quickly.
wall temperature of a base plate and fins wall temperature contour in solid volume and comparative explanation for 1.5mm mesh for inlet 1,7 meters per seconds respectively for forced air
below image shows 1.5 mm mesh 1 m/s inlet air ,wall temperature of a base plate and fins wall temperature contour

below image shows top view of 1.5 mm mesh 1 m/s inlet air temperature contour in fins and base plate

below image shows 1.5 mm mesh 7 m/s inlet air ;temperature contour in fins and base plate

from above image shows that the base plate gets heat by the processor at the middle that is also potential hotspot and max fin temperature occurred in front of the fin that means more the temperature more the difference in air temperature and solid that leads more heat gets convicted out of the fin body.
below image shows 1.5 mm mesh 7 m/s inlet air;velocity vector on plane and temperature contour on plane perpendicular to velocity vector plane

from above image, its observe clearly that circular wake is behind fins wich may leads to lower convection from solid to fluid also plane of the fluid volume shows air gets more temperature near a fin
1.5mm mesh 1m/s inlet air solution animation
1.5mm mesh 7m/s inlet air solution animation
from the above solution animations, it's observed that solution repeated in a cycles
Below table shows max value of wall heat transfer coefficient processor and fin shadow
| mesh element | 29210 | 111731 | 207131 | 471129 | 207131 | 207131 | 471129 |
| mesh | 10.98mm | 2.5mm | 2mm | 1.5mm | 2mm | 2mm | 1.5mm |
| velocity m/s | error due floating point exeception | 1 | 1 | 1 | 4 | 7 | 7 |
| max value of wall heat transfer coefficient processor [W m^-2 K^-1] | error due floating point exeception | 61.2691 | 575.181 | 671.908 | 595.23 | 611.72 | 671.908 |
| max value of wall heat transfer coefficient fins [W m^-2 K^-1] | error due floating point exeception | 968.073 | 21604.8 | 968.088 | 22442.3 | 25335.8 | 1238.64 |
| max value temperature fins temp [k] | error due floating point exeception | 1363.96 | 765.214 | 4902.94 | 815.264 | 819.269 | 4829.93 |
from the above table, it observed that the max value of wall heat transfer coefficient fins gets increased as increases of inlet air velocity also with that there is a decrement in max temperature in fins volume for 1.5 mm mesh and also wall heat transfer coefficient at processor stays same for 1.5mm mesh.
The below image shows output parameter of max temperature achieved in fins volume

Conclusion
- Hence graphics card is simulated under conjugate heat transfer simulation in which graphics card subject to force air of 1, 4,7 meters per sec respectively air with different mesh size also a hot spot in the model is where max temperature achieved in simulation and that is due to circulation or wake generation due obstacle in airflow; That potential hot spot is one is processor because its obvious that generating heat and behind the fins on graphics card where the wake is made and sometimes in the frontal part of fins which been disused above.Also potential hotspot lies below the processor on a base plate.
- Wherever speed of air increases heat transfer from solid to fluid is increased but wherever wake is made by air by which air is not vacant that region quickly and thus its increases heat transfer from air to solid so rapture than cooling graphics card reversed effect is observed and it’s not beneficial for design point of view also.
- As inlet speed increase wall transfer coefficient near fins gets increases mean more heat dissipated to air. As the temperature in fins gets to increase the temperature difference between air and fins increases that leads to more convection of heat from solid to fluid.
Future scope
Also, it observes that this mesh is also not suitable for good simulation need to go beyond 512k so that result may not accurate and can’t be validated, mesh affect solution greatly we can’t rely on this mesh also this simulated under steady-state solver but the transient case may be given different solution also fins position can be varied so that more convection may be done.
Leave a comment
Thanks for choosing to leave a comment. Please keep in mind that all the comments are moderated as per our comment policy, and your email will not be published for privacy reasons. Please leave a personal & meaningful conversation.
Other comments...
Be the first to add a comment
Read more Projects by saurabh talele (28)
Week 10 - Simulating Combustion of Natural Gas.
Combustion and reaction chemistry model Combustion and reaction chemistry model used in an internal combustion engine, gas turbine engine, rocket propulsion, gas flares, steel making, boilers, cement kilns, biomedical applications, fire safety, fuel cell, battery cell modelling, environment safe product…

05 Sep 2021 03:52 PM IST
Week 6 - CHT Analysis on a Graphics card
Video rendering card Video rendering card is responsible for accelerating the rendering of graphics on display. And it continuously takes electric energy and dissipates the heat energy like a hot heat sink. Also if heat dissipation is not managed the rendering processes may fail, reduce time to render or in the worst conditions…
23 Aug 2021 08:51 AM IST
Cyclone Separator Challenge
Aim To simulate anthracite particle-based cyclone separator with varying particle size from one micron to five microns with same particle velocity and inlet air velocity that is flow velocity, Also this particle velocity and flow velocity are varied from one to five with same five microns i.e. uniform particle size,…
31 Aug 2020 12:01 PM IST
simulation of Rayleigh Taylor Instability using ansys
Introduction In this Rayleigh – Taylor instability simulation the lighter fluids are above the lighter fluid and regime is accelerated by gravity. Also, phase between two fluids is marked H(x)/patch by 1 for heavier fluid and zero for lighter fluid. Rayleigh–Taylor instability…
28 May 2020 07:10 PM IST
Related Courses


0 Hours of Content
Skill-Lync offers industry relevant advanced engineering courses for engineering students by partnering with industry experts.


Our Company

4th Floor, BLOCK-B, Velachery - Tambaram Main Rd, Ram Nagar South, Madipakkam, Chennai, Tamil Nadu 600042.

Top Individual Courses
Top PG Programs
Skill-Lync Plus
Trending Blogs
© 2025 Skill-Lync Inc. All Rights Reserved.