Week 10 - Simulating Combustion of Natural Gas.
Combustion and reaction chemistry model
Combustion and reaction chemistry model used in an internal combustion engine, gas turbine engine, rocket propulsion, gas flares, steel making, boilers, cement kilns, biomedical applications, fire safety, fuel cell, battery cell modelling, environment safe product designed
To solve combustion means to predict chemical reaction rate and to predict sox, NOx, soot by burning of gas their different model present in Ansys fluent under species transport like finite rate chemistry model, finite rate of eddy dissipation model, eddy dissipation model, eddy dissipation concept model.
To solve chemical reacting flows conservation equation, convection-diffusion species transport equation and reaction source for component species are required, there are maybe thousands of chemical reaction present in form of reactant and products this reaction are based on the time that is why then are solved by software.
Due to combustion Nitrogen monoxide, Nitrogen dioxide, Sulfur dioxide, soot are formed which are harmful to the environment.
Premixed flame vs non-premixed flame or diffusive flame in a combustion
In premixed combustion fuel and oxidiser are mixed first and then enter in control volume whereas in non-premixed combustion fuel and oxidiser are sent to control volume separately or introduce that fuel and oxidant species in control volume by means of separate streams.
Eddy dissipation model
eddy literally means a small circular moment in fluid due to turbulence; Combustion initiate wherever turbulence is present its based on turbulence time scale based turbulent-chemistry model whereas it can be used with Reynolds average Navier strokes equation, large eddy or direct numerical solution with species transport equation. This is best suitable for a non-premixed model because combustion is in combustion chamber or in computational domain. But for premixed combustion, some fraction of time is required to combust a flame in this flame has travelled some distance of that fraction time.
In the eddy dissipation model, non-premixed flames turbulence is mixed with fuel and oxidiser slowly and burn quickly and it depends upon the value of epsilon.
Problem description and modelling technique
Geometry and solution technique
The below image shows 3d view computational domain
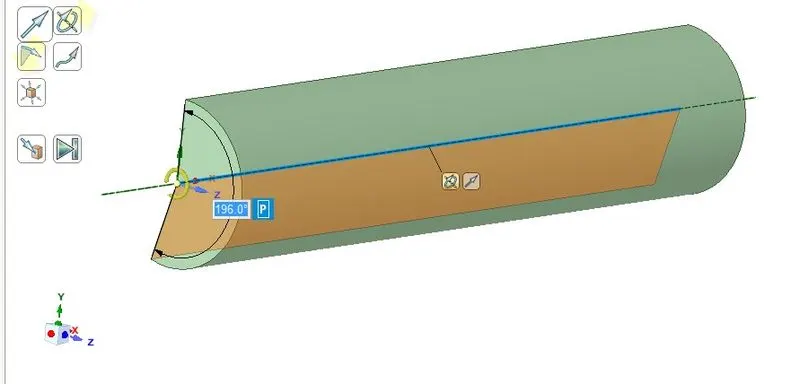
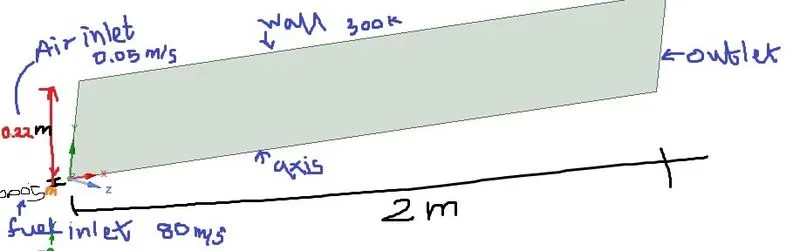
For this type of simulation axisymmetric two-dimensional planar approach is taken because our domain is cyclic and symmetric around the axis of symmetry as shown above to reduce computational expenses while it predicts the same result as 3-dimensional simulation.
Part-1-100% methane enters in domain with air and for that radii direction vs mass fraction of ch4,co2.o2,n2,nox,sox,soots are plotted at different location.
Part-2- 5to 30% water with methane along with the air is entered in a domain the effect of this on nox, soot is predicted also for that radii direction vs a mass fraction of ch4,co2.o2,n2,nox ,sox, soots are plotted at a different location.For this methane air, a two-step mixture s selected.
Meshing
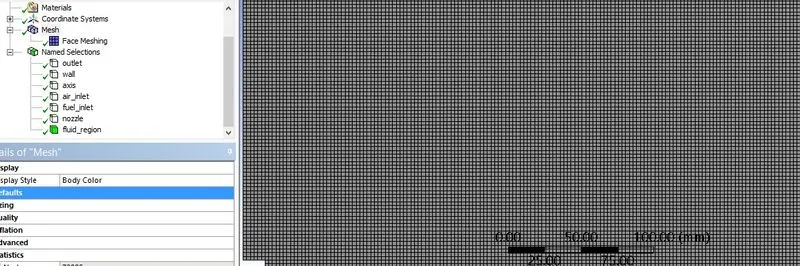
face meshing of 2.5mm is done domain with 71,988 elements
setup
general setting
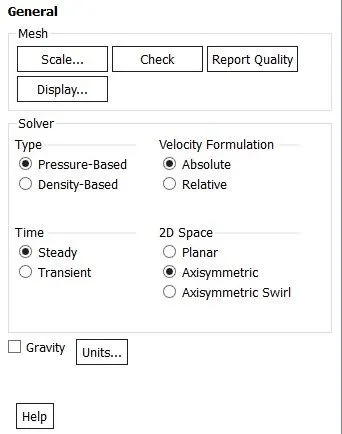
this simulation is under steady-state and axisymmetric two-dimensional planar problem
Models are enabled
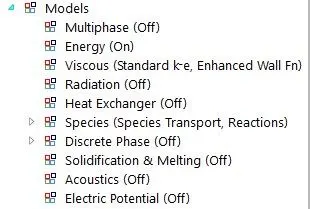
energy is turn on
Viscous model
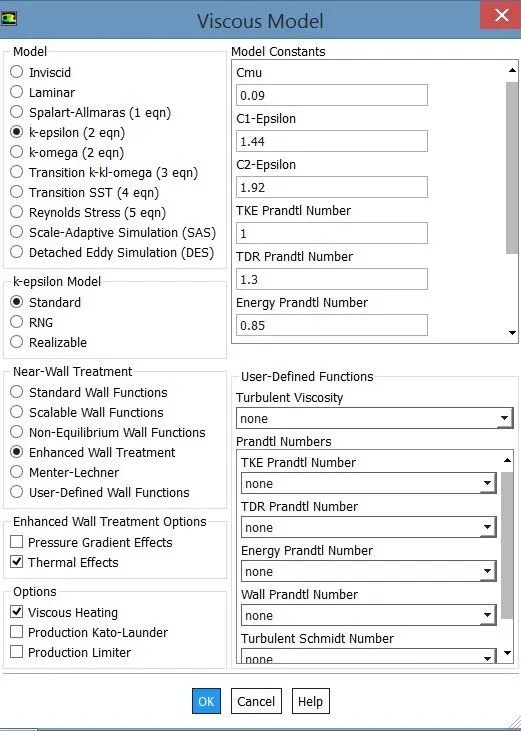
K-E model standard enhanced wall treatment is turn on with default setting
Species model part 1
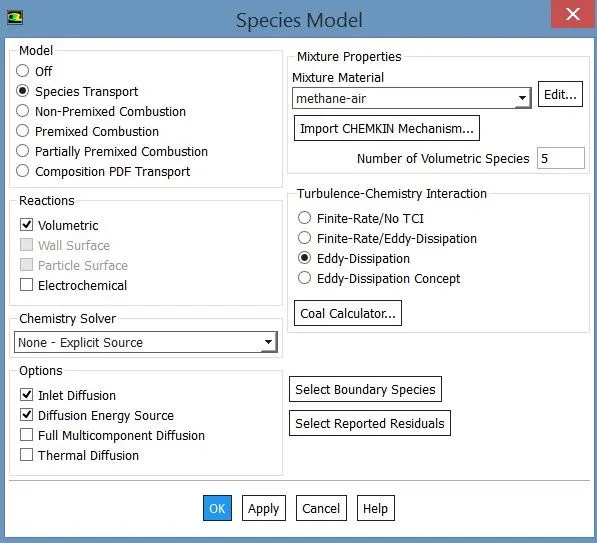
methane-air chemical equation
CH4 + 2O2 → CO2 + 2H2O + energy
CH4 + 2(O2 + 3.76N2) → CO2 + 2H2O + 7.52N2
Lean combustion:
If the amount of air is more than that required for complete combustion,
there will be excess air after combustion. This is called lean combustion.
CH4 + 3(O2 + 3.76N2) → CO2 + 2H2O + O2 + 11.28N2
In lean combustion, the air-fuel ratio is greater than the stoichiometric
air-fuel ratio.
A/F > (A/F)st
a mixture in species model
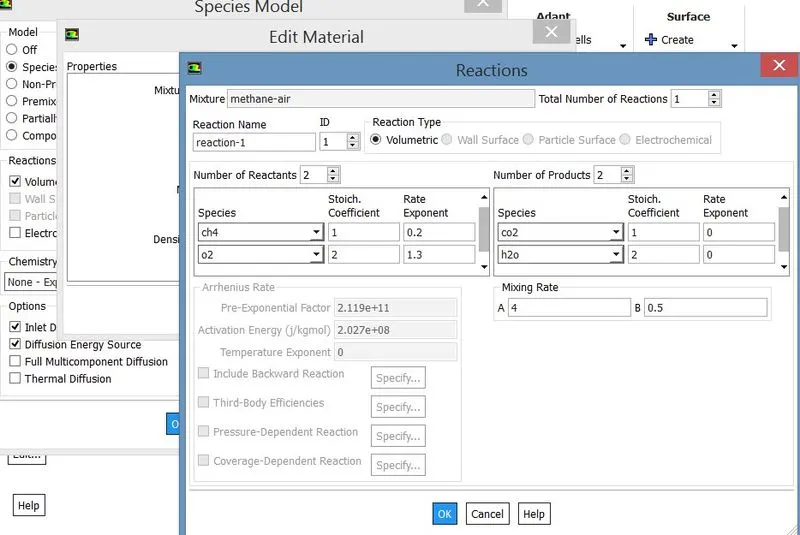
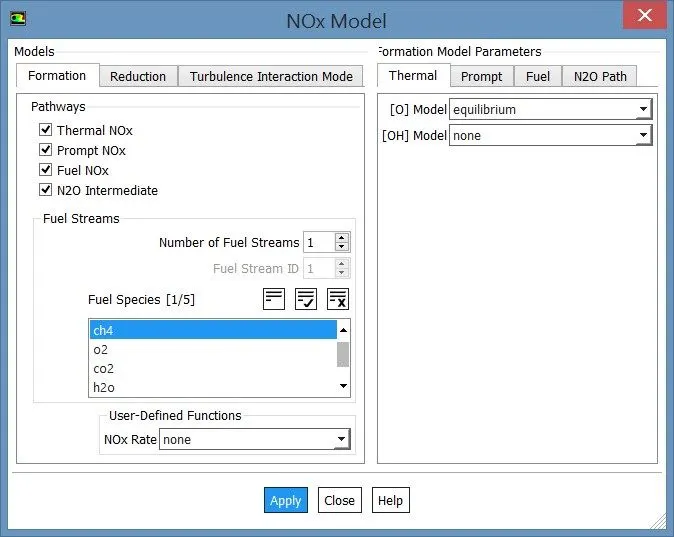
nox model turn on with this following setting
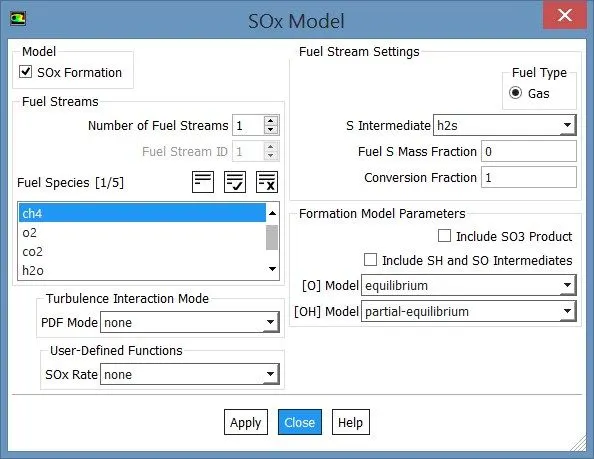
sox model turn on with this following setting
Species model with soot model for part 1
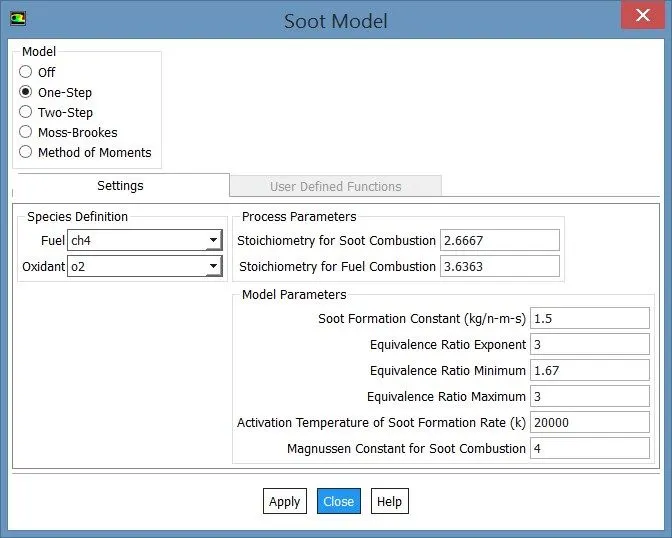
the one-step soot model as oxidant is selected as oxygen.
Species model for part 2
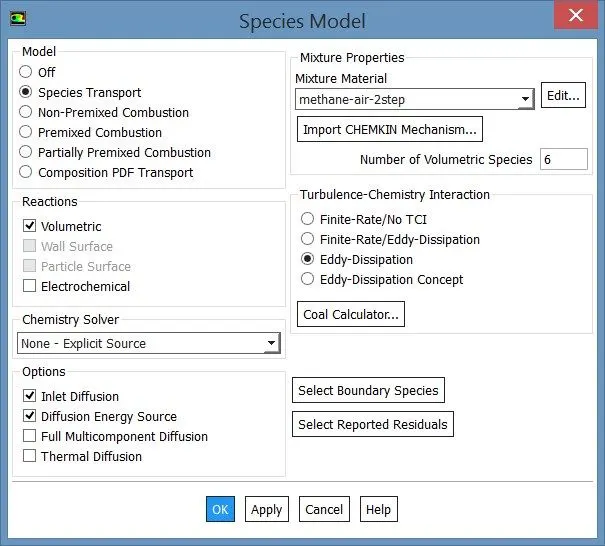
for part 2 methane-air two-step model is selected to add water to the fuel or methane
Species model with soot model of two-step for part 2
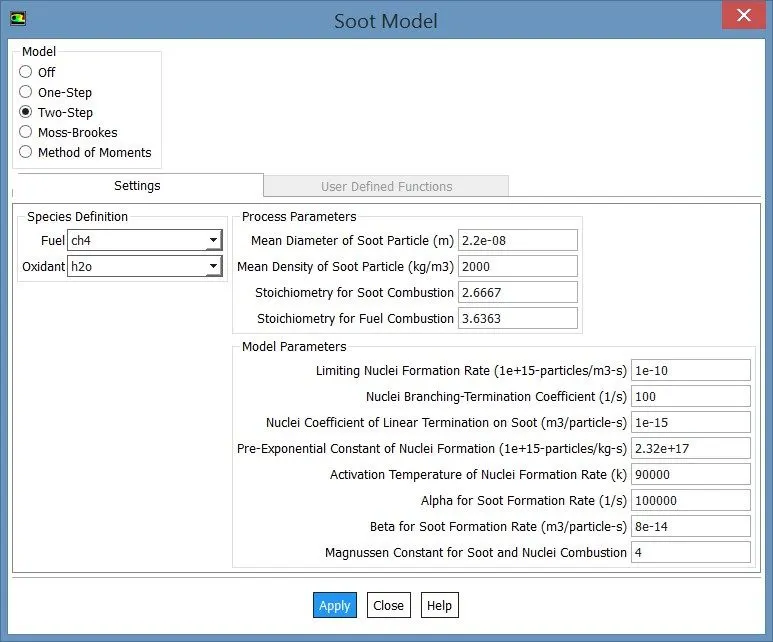
The two-step soot model is more accurate thane the one-step soot model as oxidant is selected as water.
material automatically added by ansys
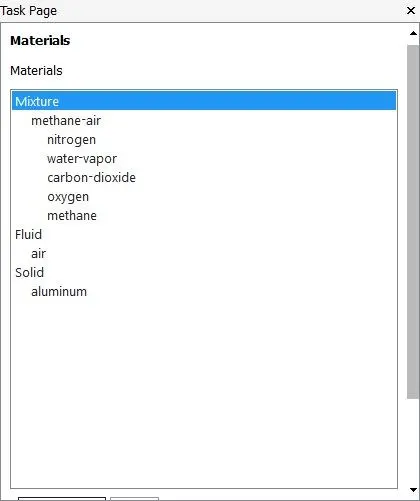
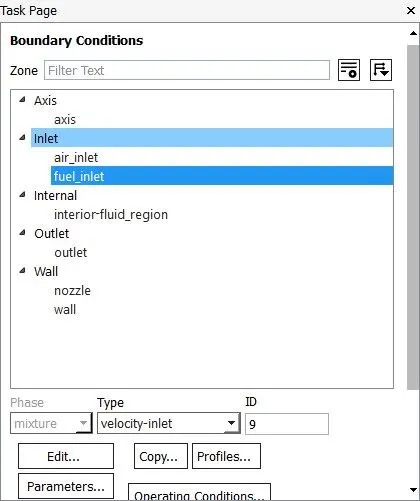
Boundary conditions
the below image shows boundary condition with zone type
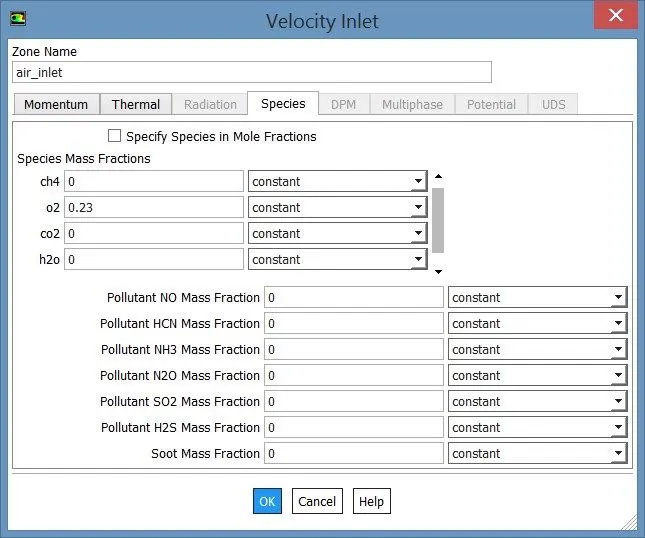
Air Velocity inlet
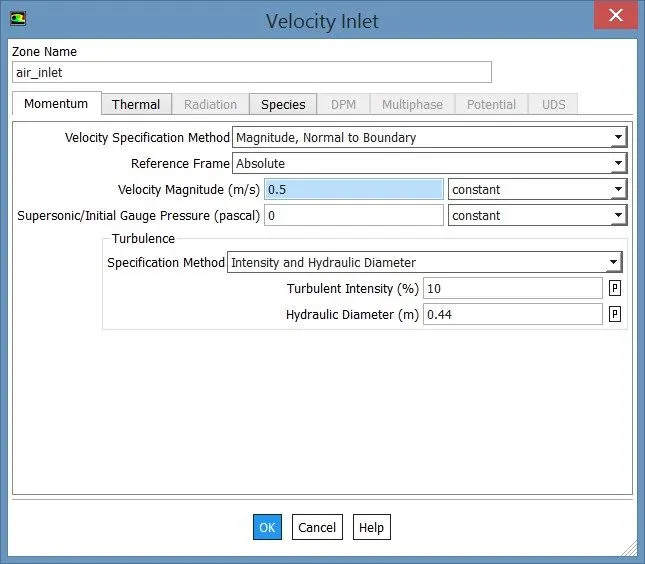
hydraulic diameter as 0.44m is taken because its cylinder with radius as 0.22m.also temperature at inlet air as 300k
species selected as O2=0.23 in air for part 1 and part 2
fuel Velocity inlet
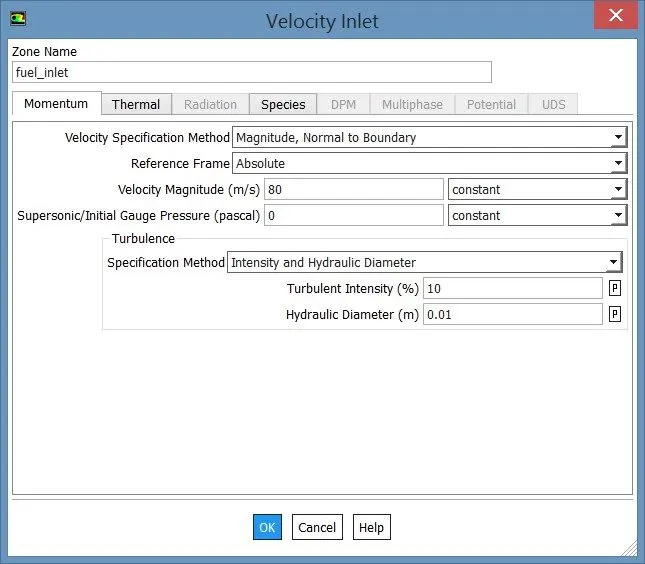
hydraulic diameter as 0.01m is taken because its cylinder with radius as 0.001m.also temperature at inlet fuel as 300k
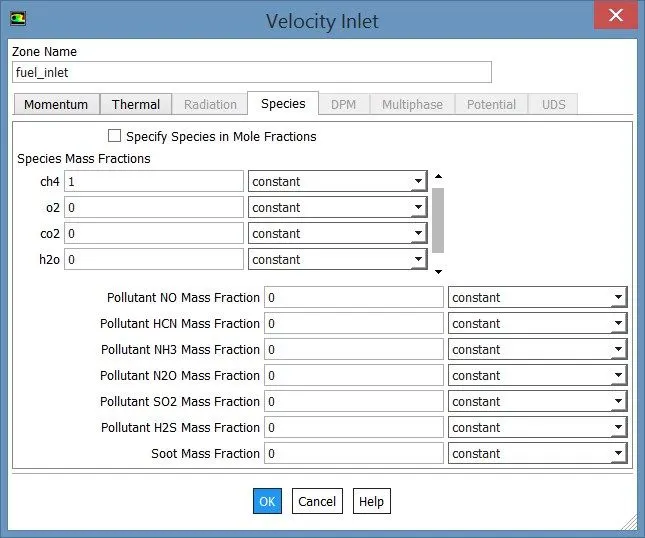
fuel species selected as ch4=1 in air part 1
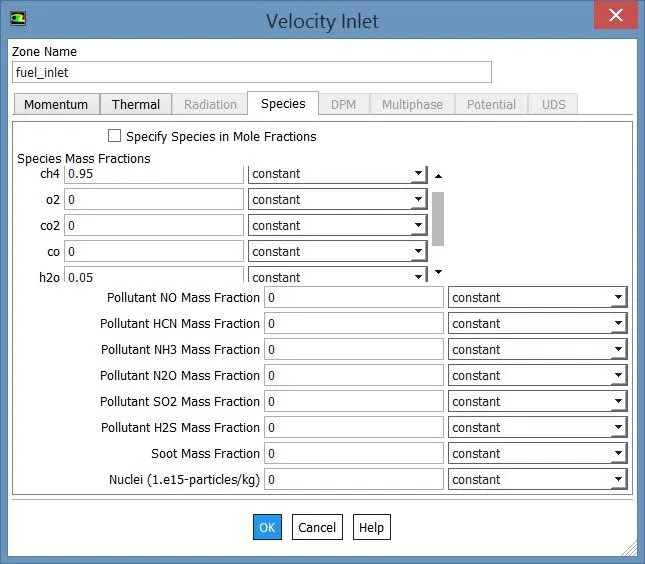
fuel species selected as ch4=0.95 and water as 0.05 in air part 2
outlet as
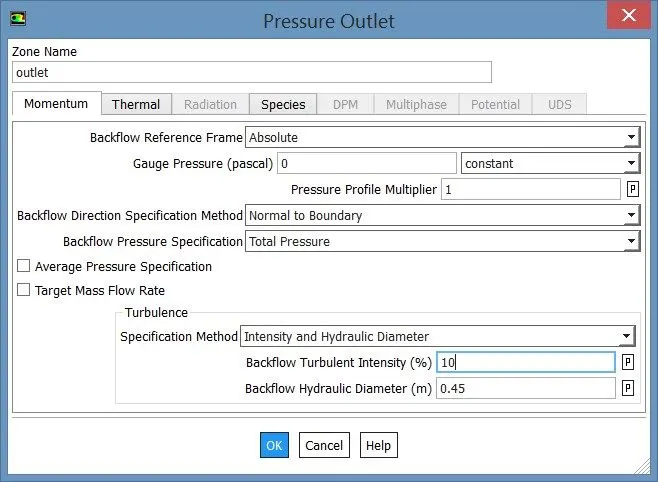
outlet hydraulic diameter as 0.45 for a radius of 0.225m.
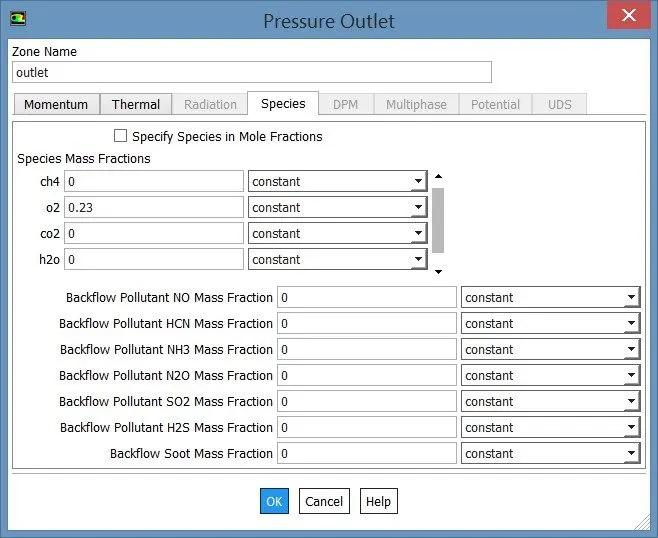
Species as o2=0.23 at the outlet with a temperature of 300k
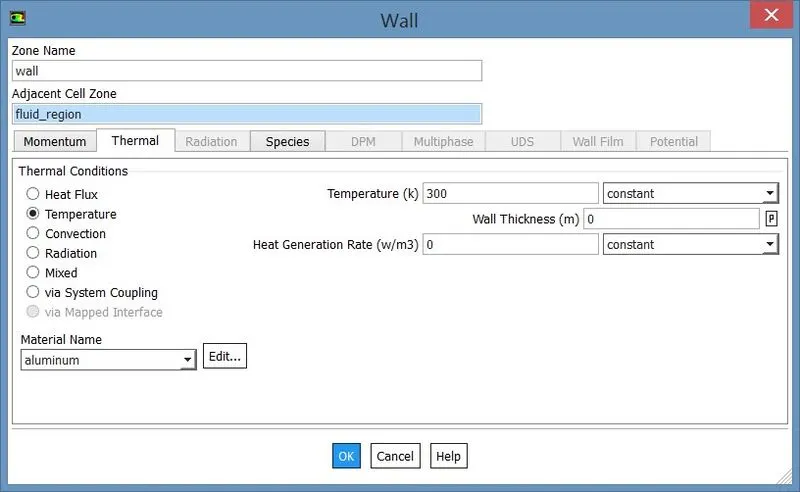
wall at 300k
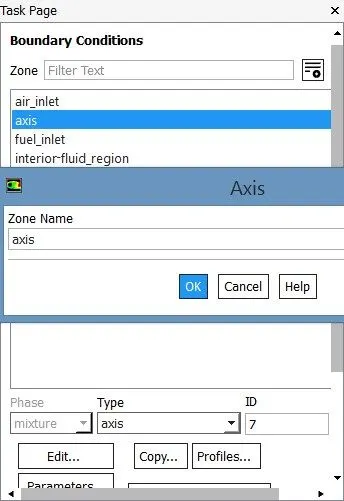
type axis
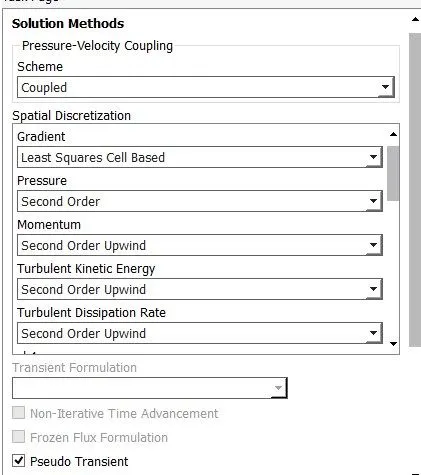
solution method as coupled is selected with Puedo transient
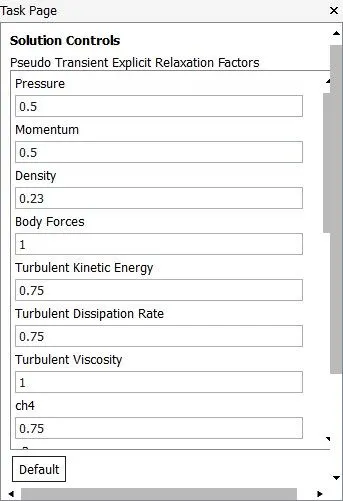
solution control for part 1
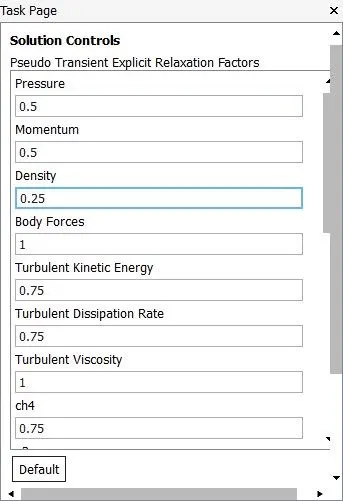
solution control for part 1
Advance in solution control
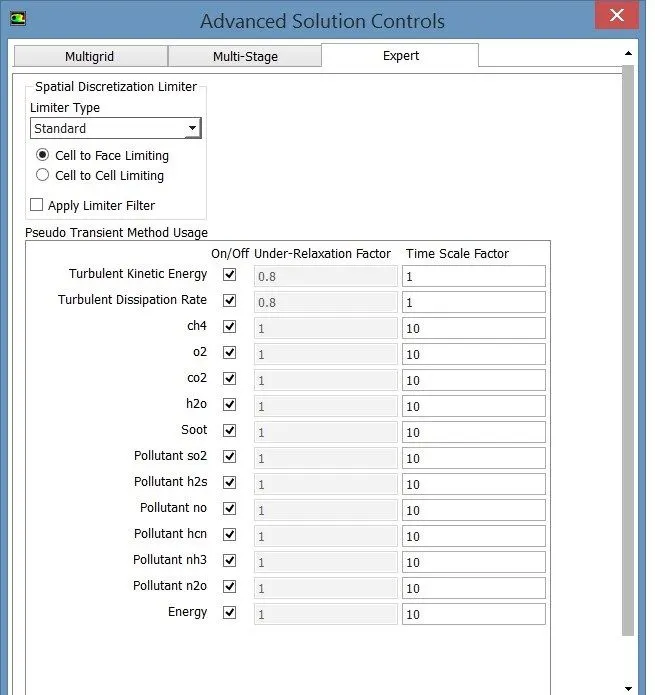
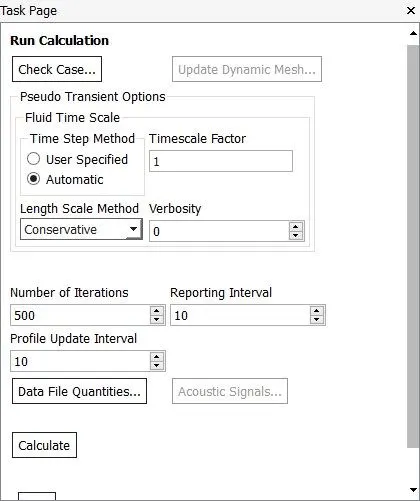
run calculation part 1 conservative length scale model for part 1
run calculation for part 2
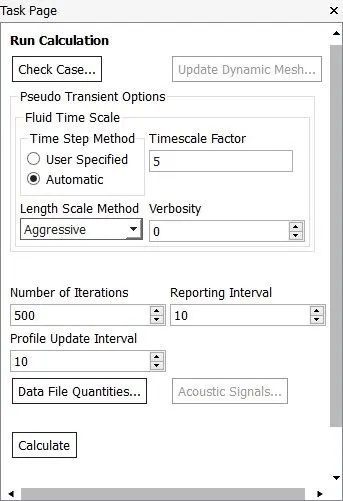
aggressive length scale model for a time scale factor of 5
residual and plots
part 1
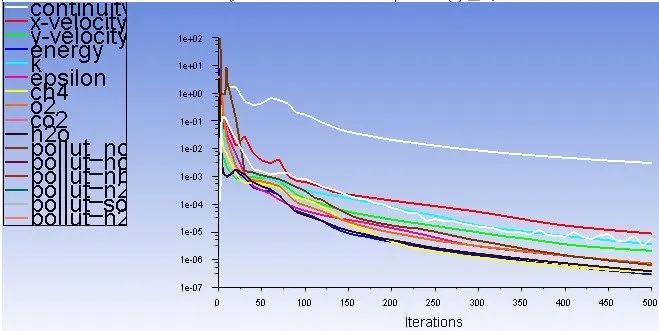
temperature contour part 1 100% methane-air one-step model solution animation
part 2
residual and solution conversion using temperature animation
methane+water-air two-step model
95% methane 5% water
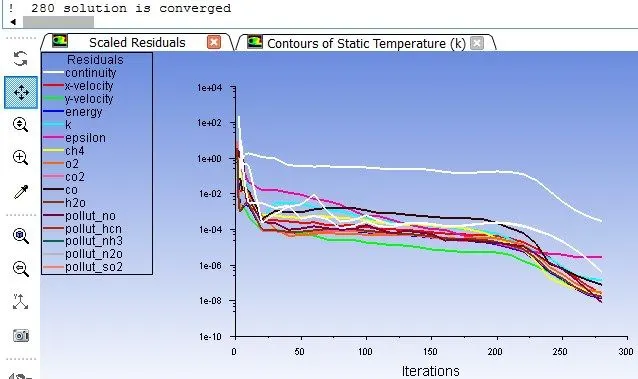
from above solution converged at 280 iteration
temperature contour part 2 95% methane+5%water-air one-step model solution animation
90% methane 10% water
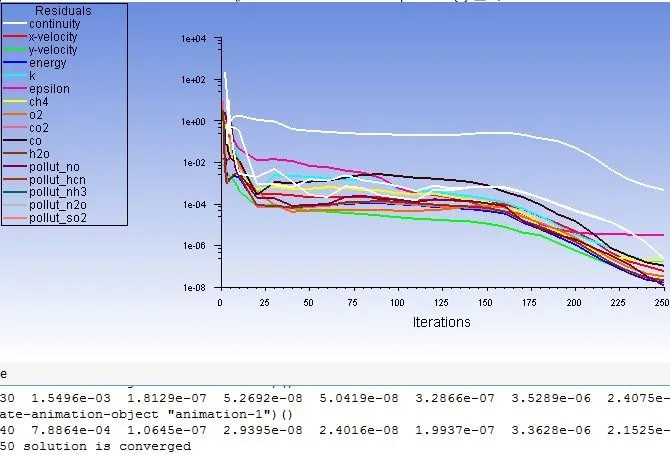
from above solution converged at 250 iteration
temperature contour part 2 90% methane+10%water-air one-step model solution animation
85% methane 15%water
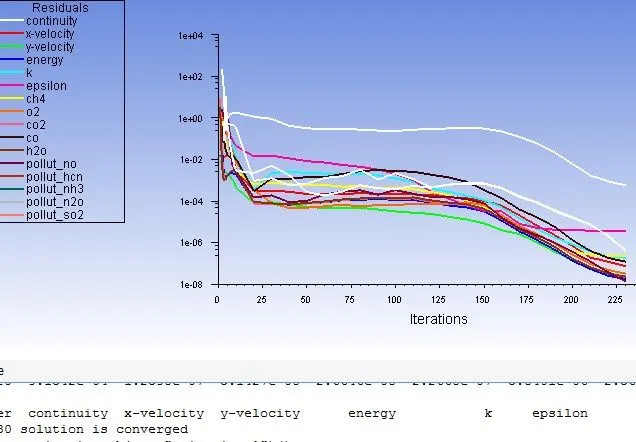
from above solution converged at 230 iteration
temperature contour part 2 85% methane+15%water-air one-step model solution animation
80% methane 20% water
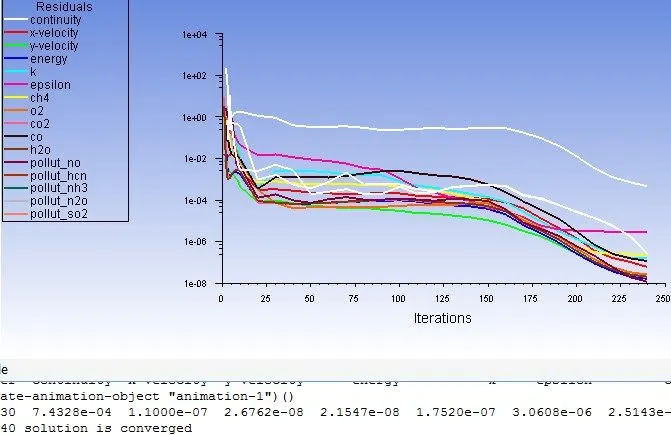
from above solution converged at 240 iteration
temperature contour part 2 80% methane+20%water-air one-step model solution animation
75% methane 25% water
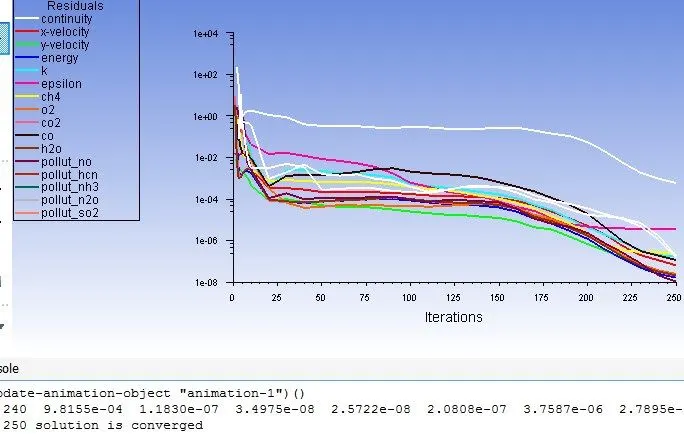
from above solution converged at 250 iteration
temperature contour part 2 75% methane+25%water-air one-step model solution animation
70% methane 30% water
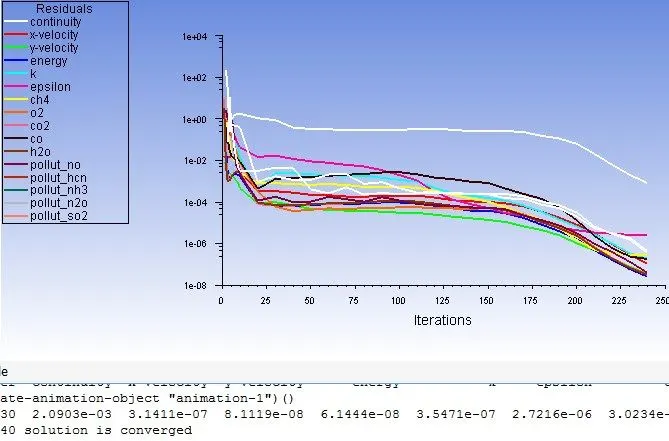
from above solution converged at 240 iteration
temperature contour part 2 70% methane+30%water-air one-step model solution animation
part 1 plotting of radial direction y vs mass fraction
soot volume rendering part 1
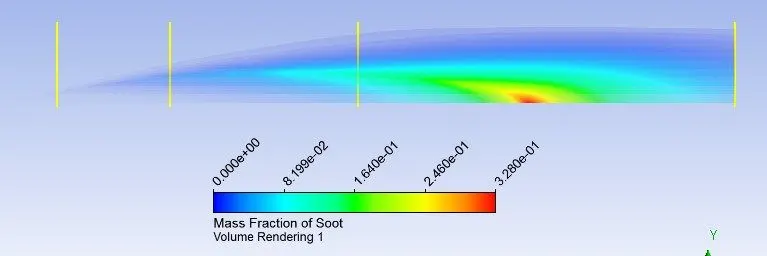
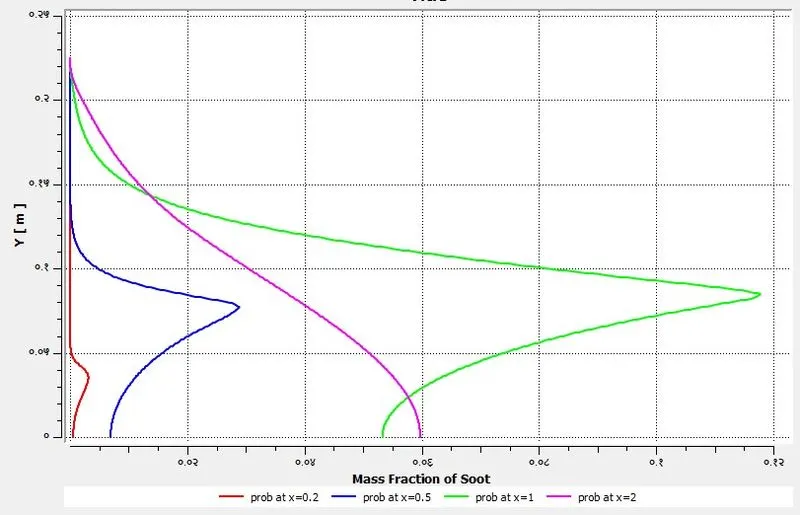
from the above plot its observed that at a location of 1.5 more soot are formed
plot of Line parallel to radius @ x=0.2,0.5,1,2m and explanation
plot of Line parallel to radius @ x=0.2,0.5,1,2m radius y=0.225 vs mass fraction of ch4
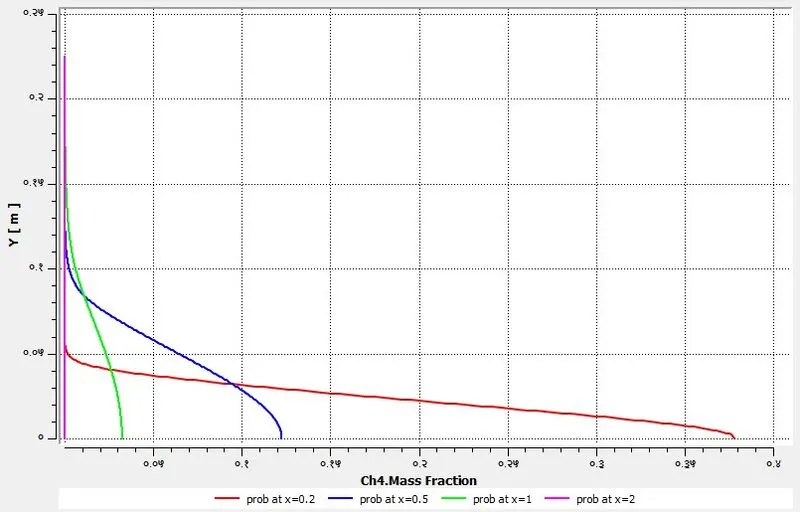
from above its observed that near axis at outlet less mass fraction of ch4 present.
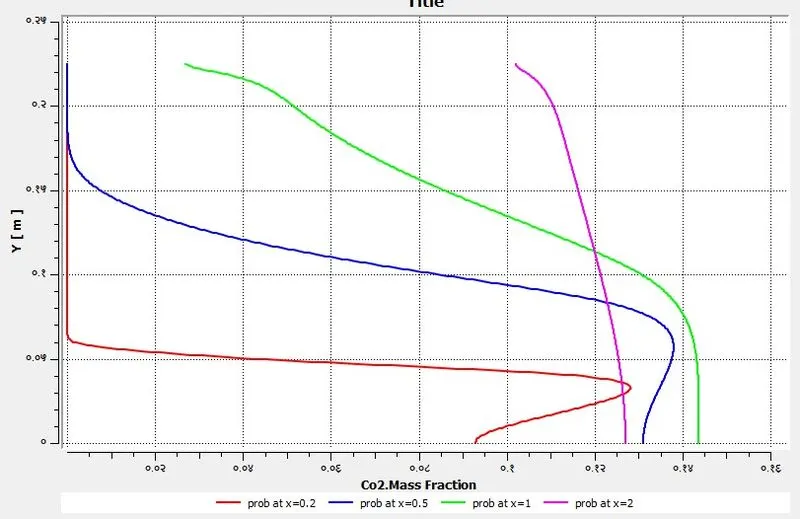
plot of Line parallel to radius @ x=0.2,0.5,1,2m radius y=0.225 vs mass fraction of co2
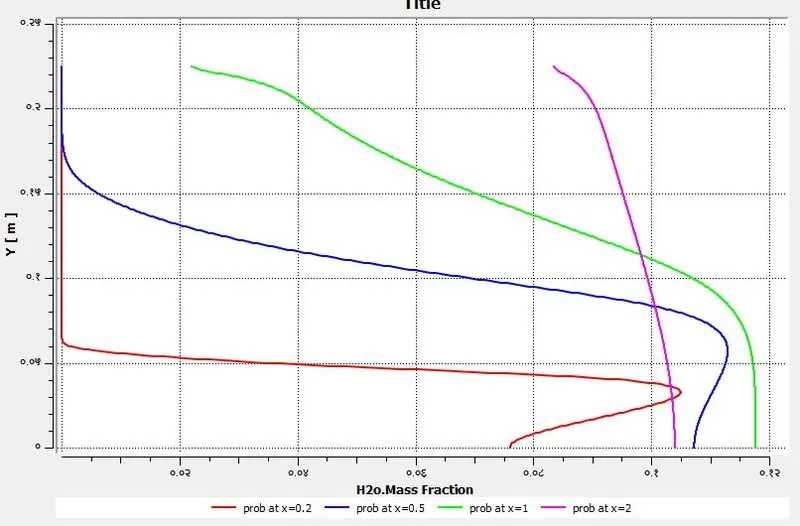
plot of Line parallel to radius @ x=0.2,0.5,1,2m radius y=0.225 vs mass fraction of h2o
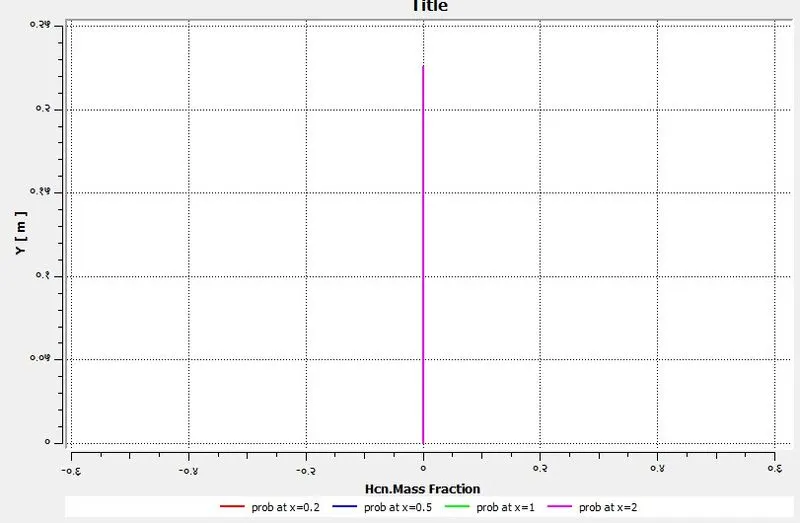
plot of Line parallel to radius @ x=0.2,0.5,1,2m radius y=0.225 vs mass fraction of hcn
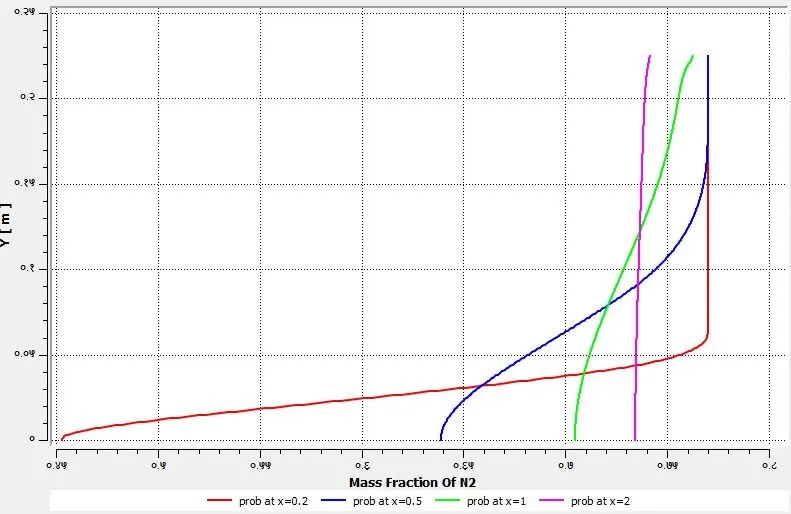
plot of Line parallel to radius @ x=0.2,0.5,1,2m radius y=0.225 vs mass fraction of n2
plot of Line parallel to radius @ x=0.2,0.5,1,2m radius y=0.225 vs mass fraction of soot
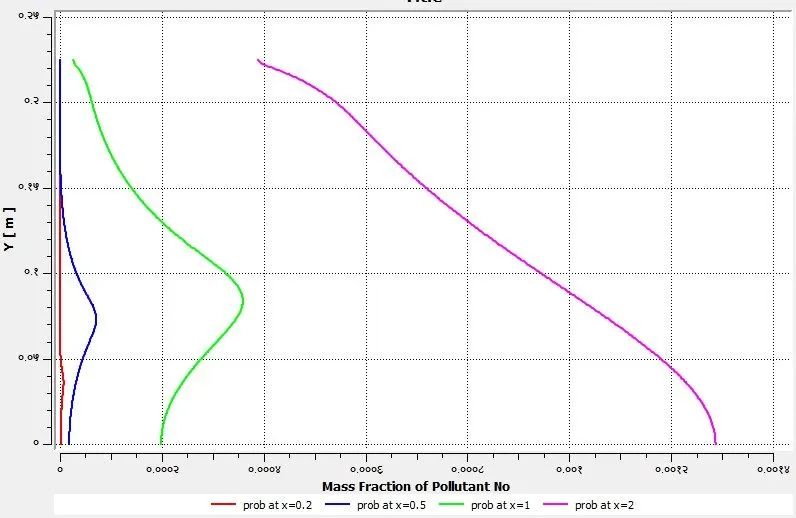
plot of Line parallel to radius @ x=0.2,0.5,1,2m radius y=0.225 vs mass fraction of pollutant no
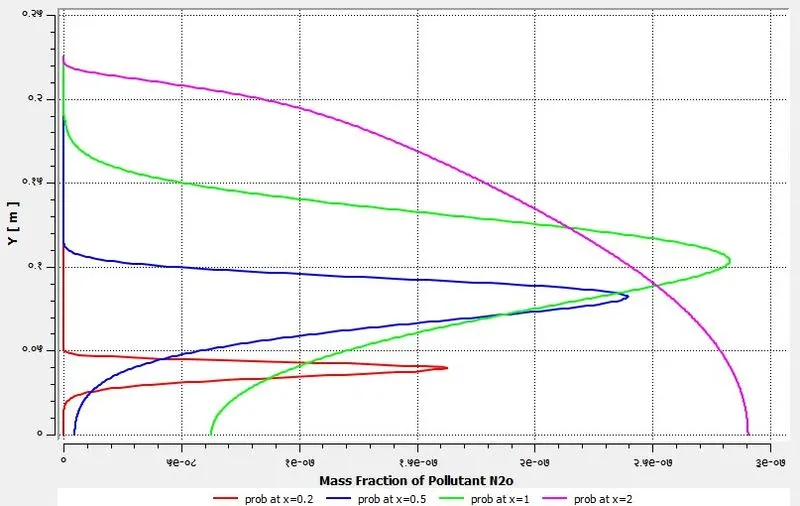
plot of Line parallel to radius @ x=0.2,0.5,1,2m radius y=0.225 vs mass fraction of n2o
plot of Line parallel to radius @ x=0.2,0.5,1,2 m radius y=0.225 vs mass fraction of o2
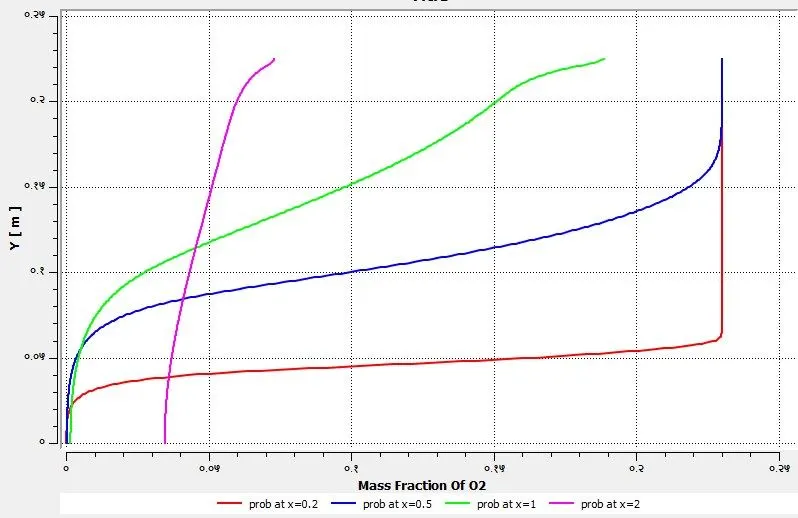
from all the above plots, it observed that more mass fraction of sox, NOx, soot,ch4, co,co2 is present near the axis and less towards a wall except for o2 and n2.
Below table is maximum values of mass fraction in plane 1 that is xy plane and outlet
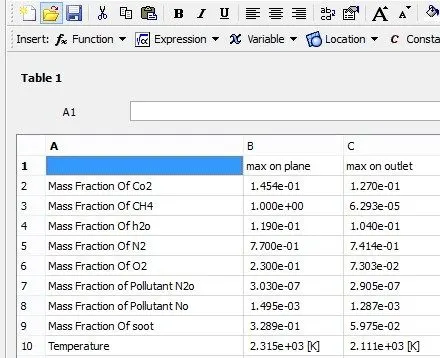
from above it's observed that at an outlet temperature and all other mass fraction is lower than temperature and mass fraction achieved in-plane xy.
Part 2 methane+water and air two step model
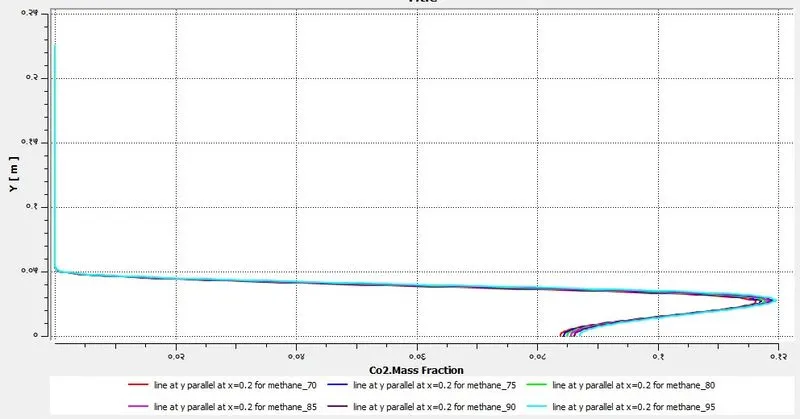
plot of Line parallel to radius @ x=0.2m, radius y=0.225 vs mass fraction of co2,for methane 70,75,85,80,85,90,90% resp.
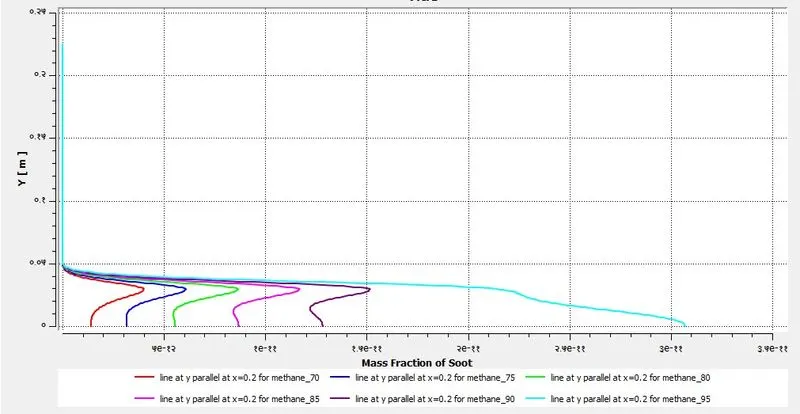
plot of Line parallel to radius @ x=0.2m, radius y=0.225 vs mass fraction of soot,for methane 70,75,85,80,85,90,90% resp.
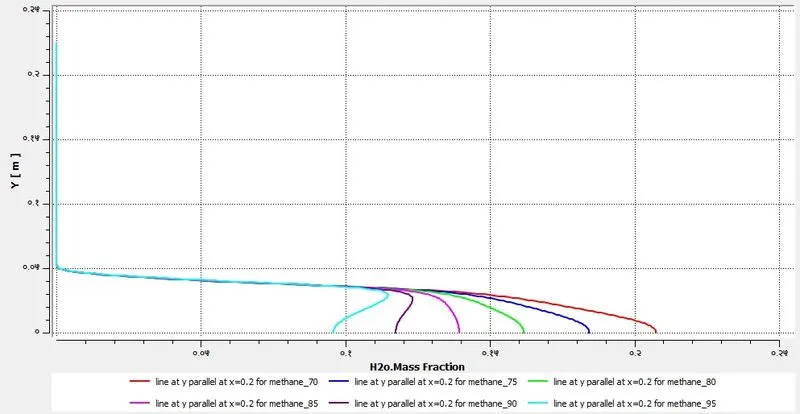
plot of Line parallel to radius @ x=0.2m, radius y=0.225 vs mass fraction of h2o,for methane 70,75,85,80,85,90,90% resp.
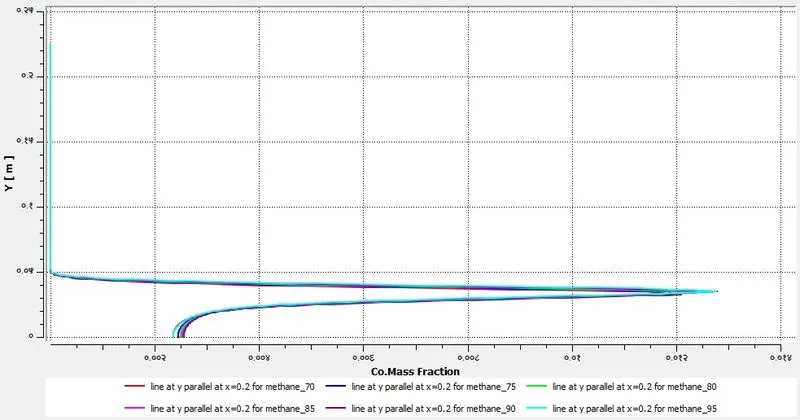
plot of Line parallel to radius @ x=0.2m, radius y=0.225 vs mass fraction of co,for methane 70,75,85,80,85,90,90% resp.
plot of Line parallel to radius @ x=0.2m, radius y=0.225 vs mass fraction of co2,for methane 70,75,85,80,85,90,90% resp.
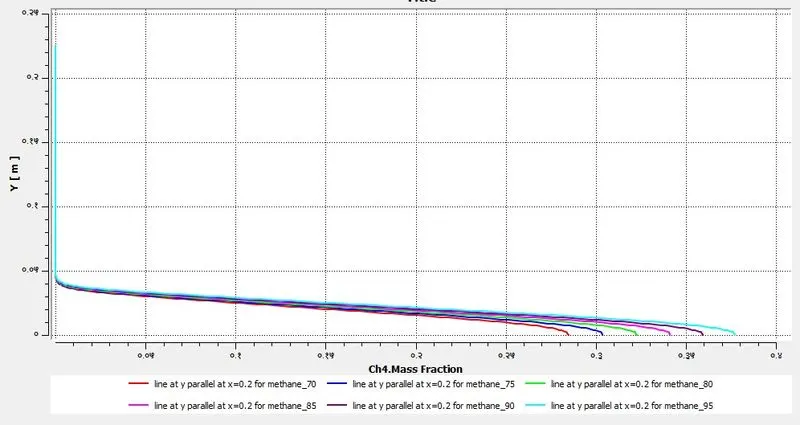
plot of Line parallel to radius @ x=0.2m, radius y=0.225 vs mass fraction of ch4,for methane 70,75,85,80,85,90,90% resp.
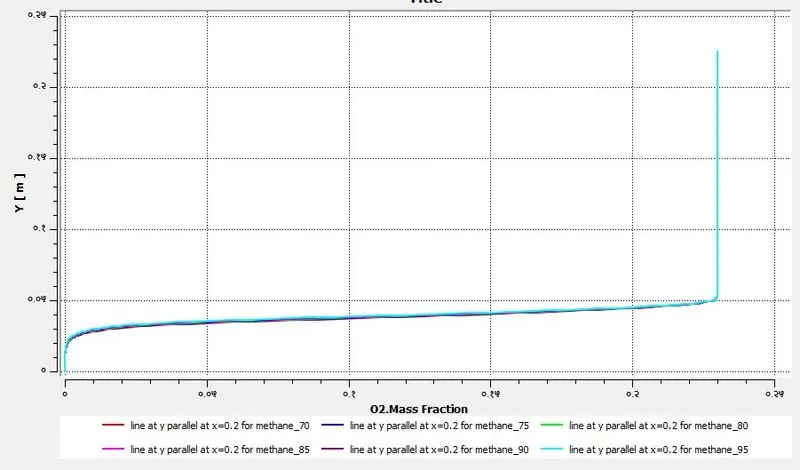
plot of Line parallel to radius @ x=0.2m, radius y=0.225 vs mass fraction of o2,for methane 70,75,85,80,85,90,90% resp.
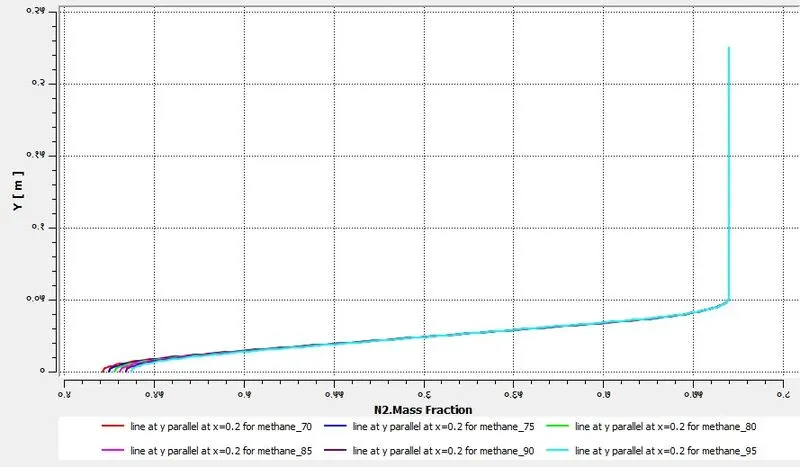
plot of Line parallel to radius @ x=0.2m, radius y=0.225 vs mass fraction of n2,for methane 70,75,85,80,85,90,90% resp.
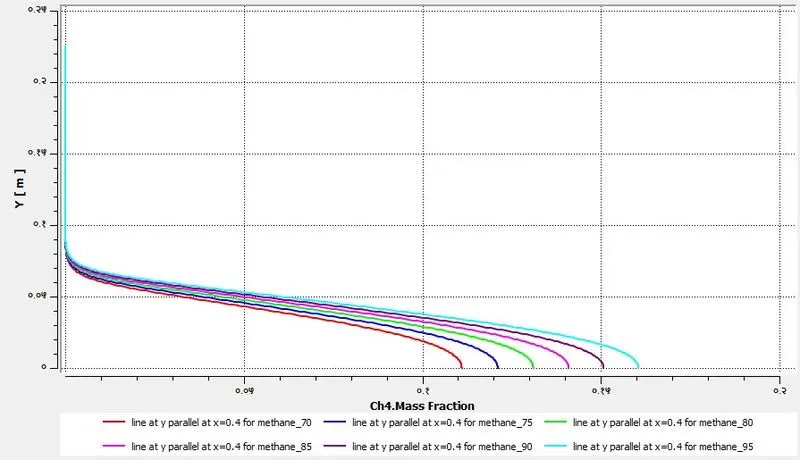
plot of Line parallel to radius @ x=0.4m, radius y=0.225 vs mass fraction of ch4, for methane 70,75,85,80,85,90,90% resp.
plot of Line parallel to radius @ x=0.4m, radius y=0.225 vs mass fraction of co2, for methane 70,75,85,80,85,90,90% resp.
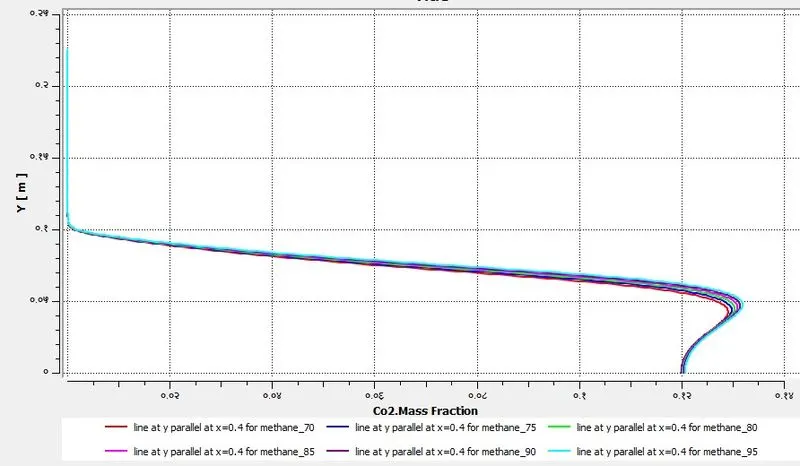
plot of Line parallel to radius @ x=0.4m, radius y=0.225 vs mass fraction of co, for methane 70,75,85,80,85,90,90% resp.
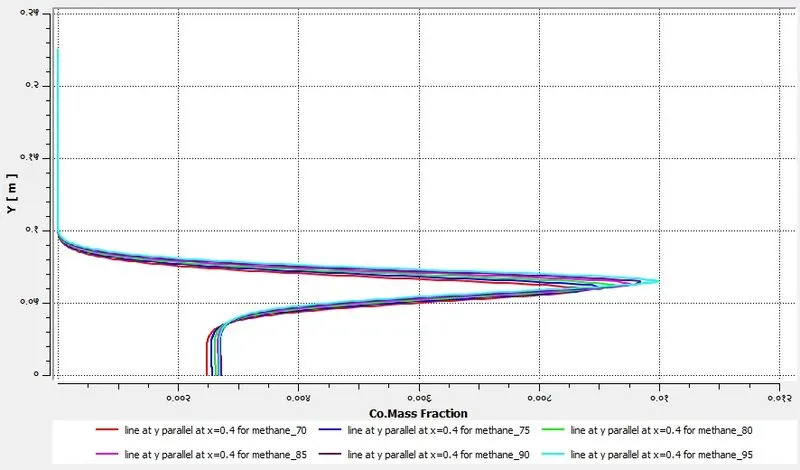
plot of Line parallel to radius @ x=0.4m, radius y=0.225 vs mass fraction of h2o, for methane 70,75,85,80,85,90,90% resp.
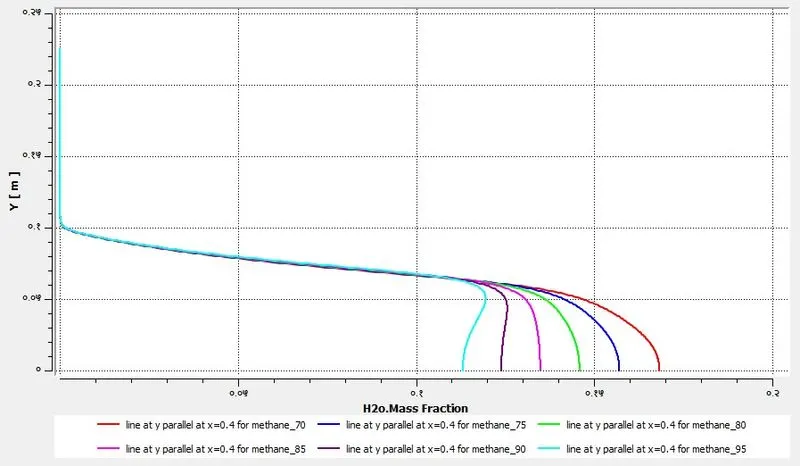
plot of Line parallel to radius @ x=0.4m, radius y=0.225 vs mass fraction of n20, for methane 70,75,85,80,85,90,90% resp.
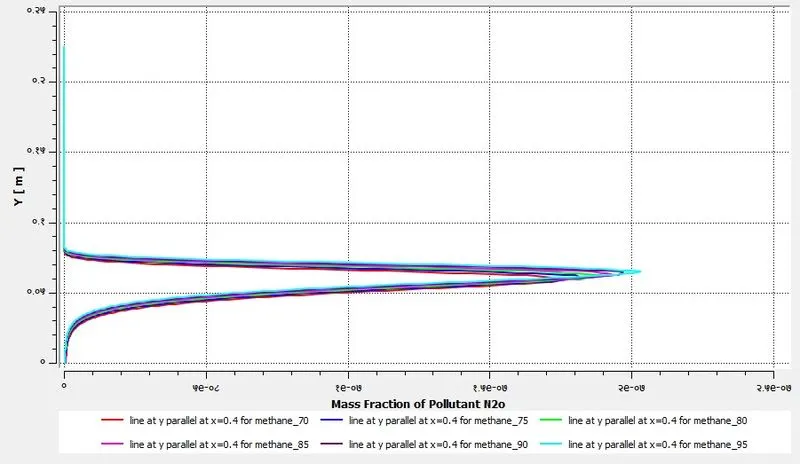
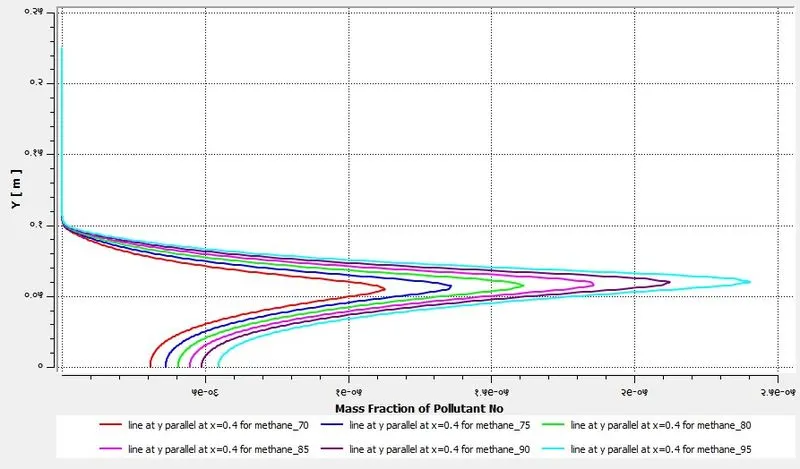
plot of Line parallel to radius @ x=0.4m, radius y=0.225 vs mass fraction of pollutant no, for methane 70,75,85,80,85,90,90% resp.
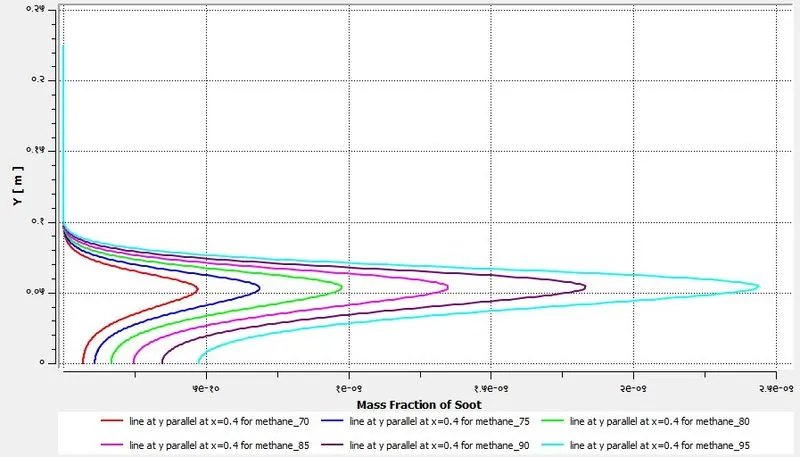
plot of Line parallel to radius @ x=0.4m, radius y=0.225 vs mass fraction of soot, for methane 70,75,85,80,85,90,90% resp.
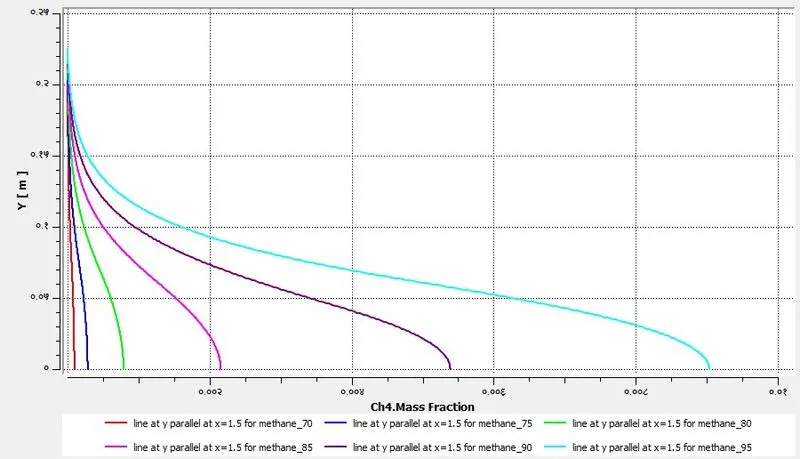
plot of Line parallel to radius @ x=1.5m, radius y=0.225 vs mass fraction of ch4, for methane 70,75,85,80,85,90,90% resp.
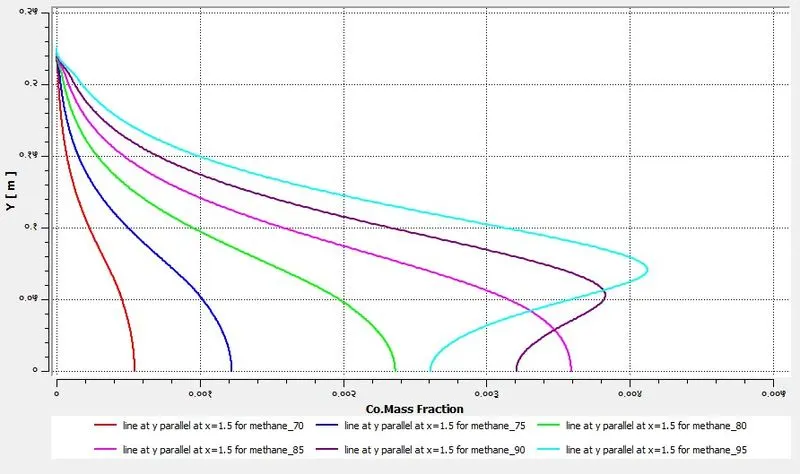
plot of Line parallel to radius @ x=1.5m, radius y=0.225 vs mass fraction of co, for methane 70,75,85,80,85,90,90% resp.
plot of Line parallel to radius @ x=1.5m, radius y=0.225 vs mass fraction of co2, for methane 70,75,85,80,85,90,90% resp.
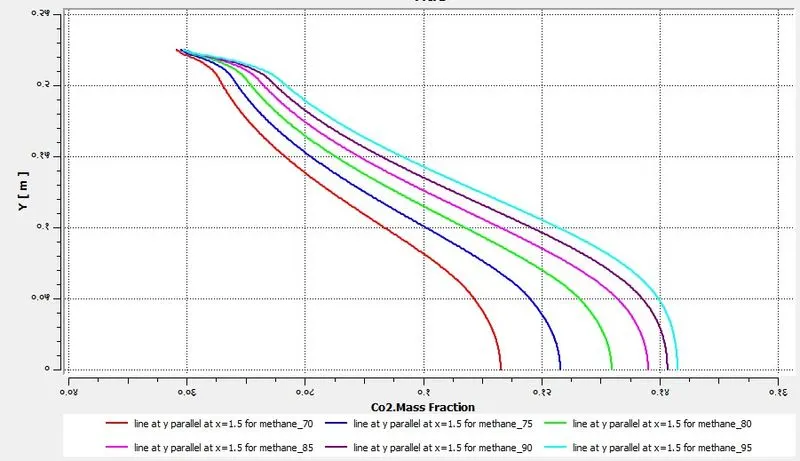
plot of Line parallel to radius @ x=1.5m, radius y=0.225 vs mass fraction of h2o, for methane 70,75,85,80,85,90,90% resp.
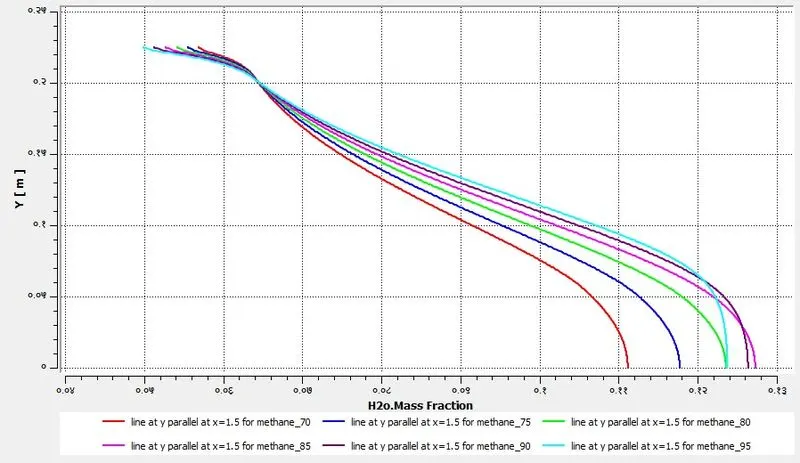
plot of Line parallel to radius @ x=1.5m, radius y=0.225 vs mass fraction of n2o, for methane 70,75,85,80,85,90,90% resp.
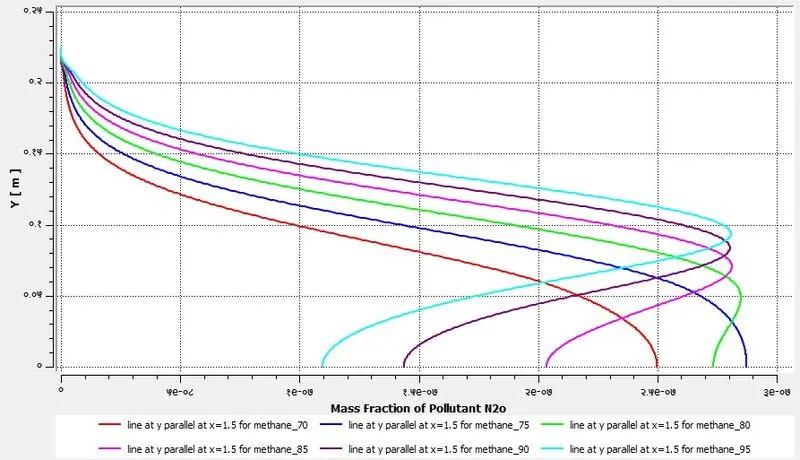
plot of Line parallel to radius @ x=1.5m, radius y=0.225 vs mass fraction of pollutant no, for methane 70,75,85,80,85,90,90% resp.
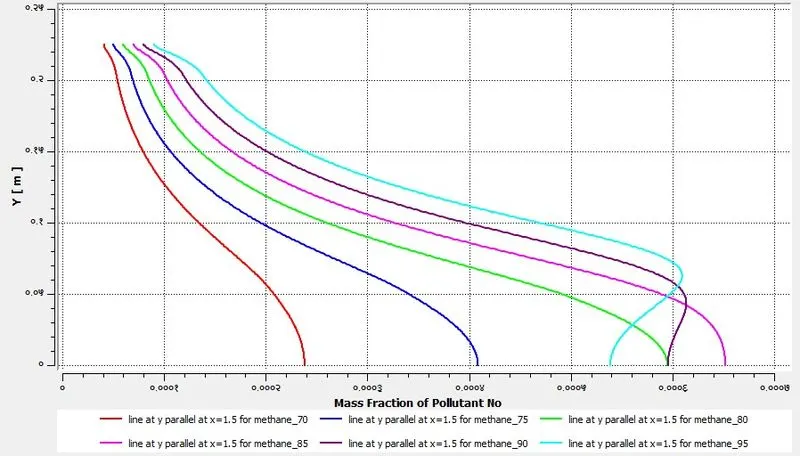
plot of Line parallel to radius @ x=1.5m, radius y=0.225 vs mass fraction of soot, for methane 70,75,85,80,85,90,90% resp.
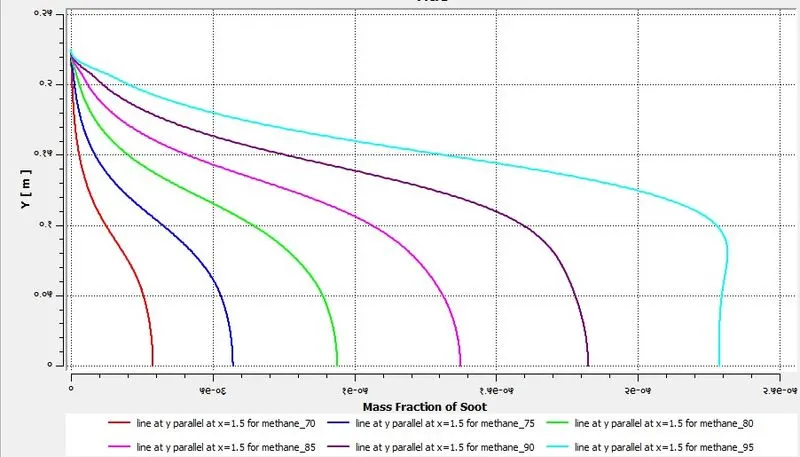
plot of Line parallel to radius @ x=2m, radius y=0.225 vs mass fraction of ch4, for methane 70,75,85,80,85,90,90% resp.
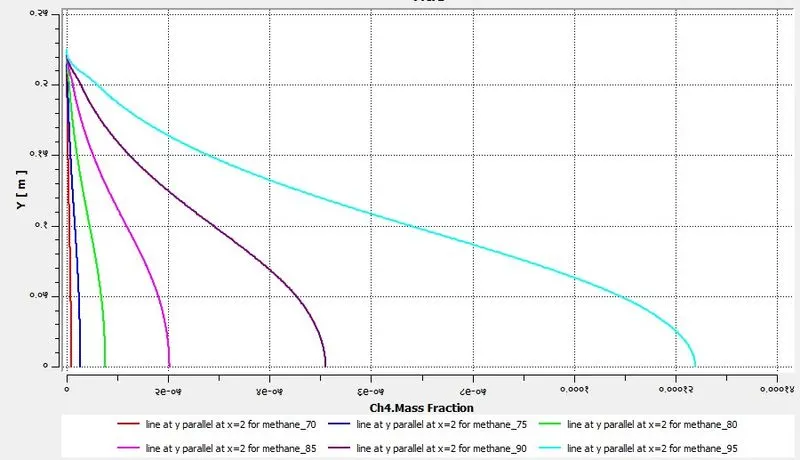
plot of Line parallel to radius @ x=2m, radius y=0.225 vs mass fraction of co, for methane 70,75,85,80,85,90,90% resp.
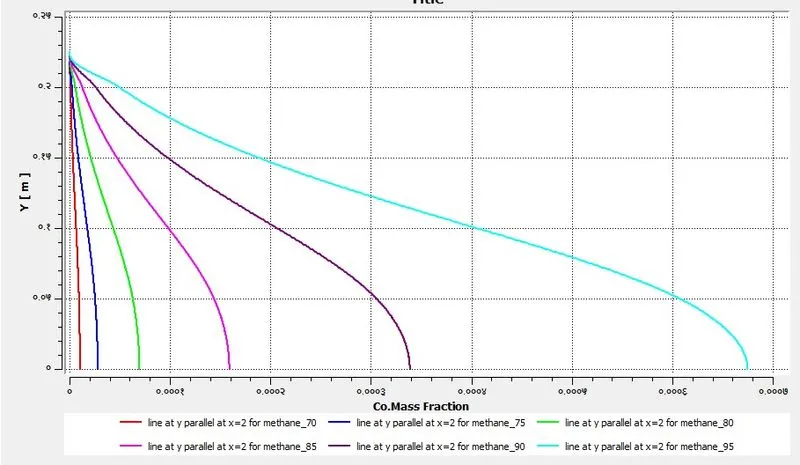
plot of Line parallel to radius @ x=2m, radius y=0.225 vs mass fraction of co2, for methane 70,75,85,80,85,90,90% resp.
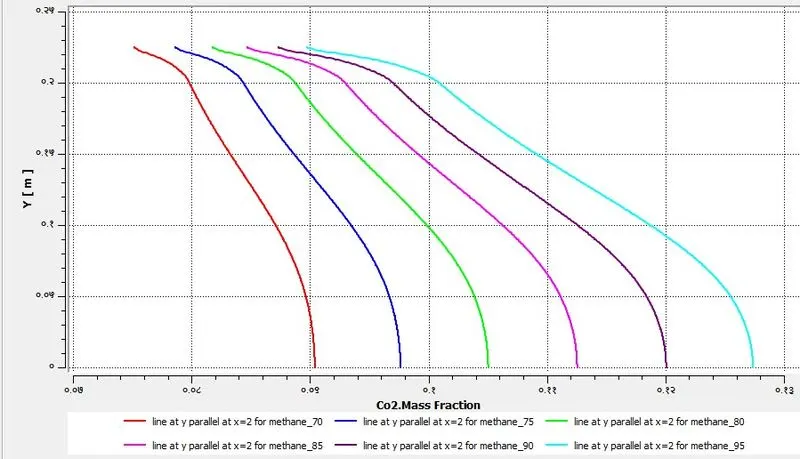
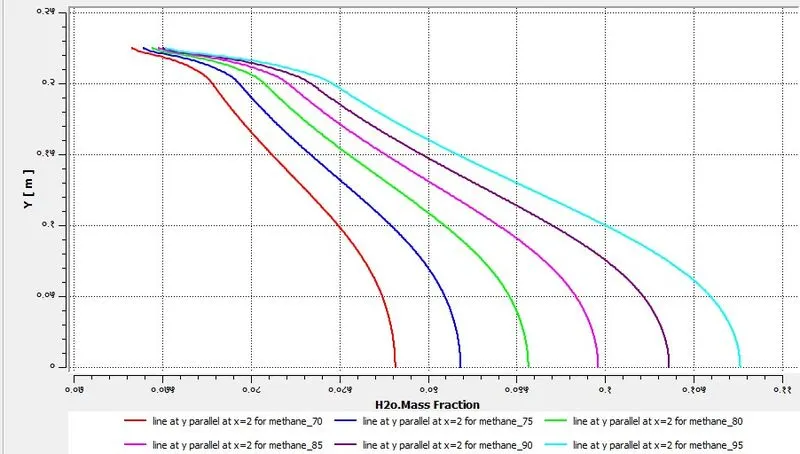
plot of Line parallel to radius @ x=2m, radius y=0.225 vs mass fraction of h2o, for methane 70,75,85,80,85,90,90% resp.
plot of Line parallel to radius @ x=2m, radius y=0.225 vs mass fraction of n2, for methane 70,75,85,80,85,90,90% resp.
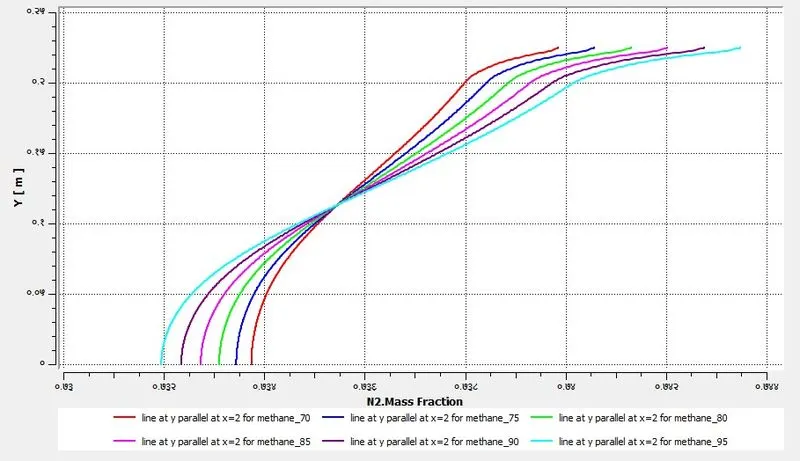
plot of Line parallel to radius @ x=2m, radius y=0.225 vs mass fraction of pollutant no, for methane 70,75,85,80,85,90,90% resp.
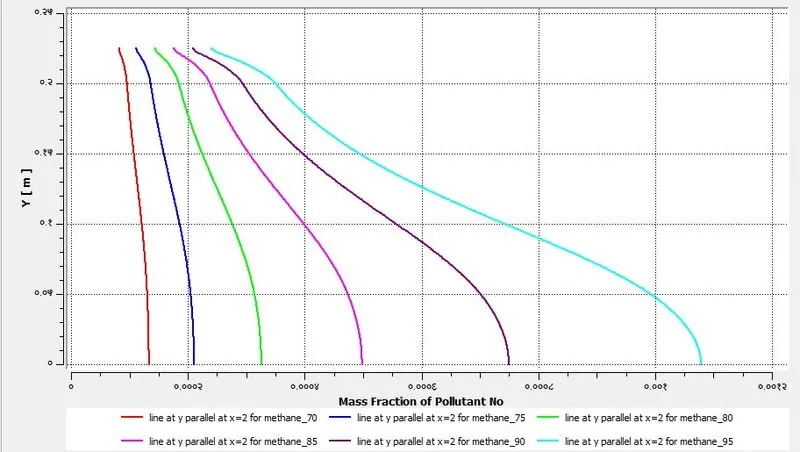
plot of Line parallel to radius @ x=2m, radius y=0.225 vs mass fraction of soot, for methane 70,75,85,80,85,90,90% resp.
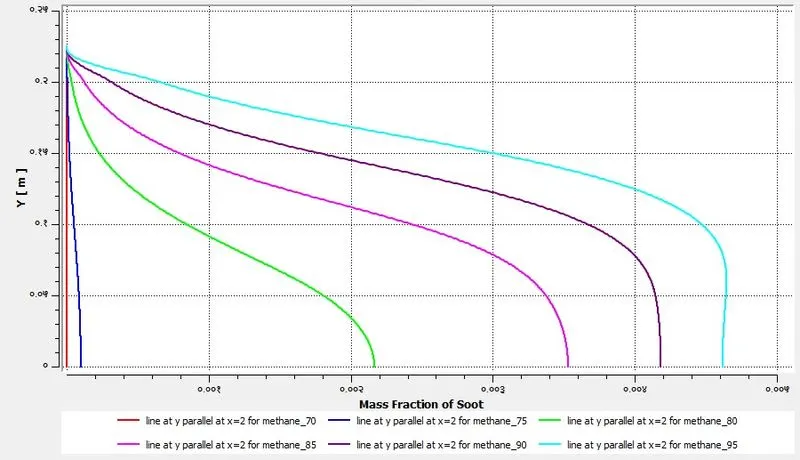
plot of Line parallel to radius @ x=2m, radius y=0.225 vs mass fraction of o2, for methane 70,75,85,80,85,90,90% resp.
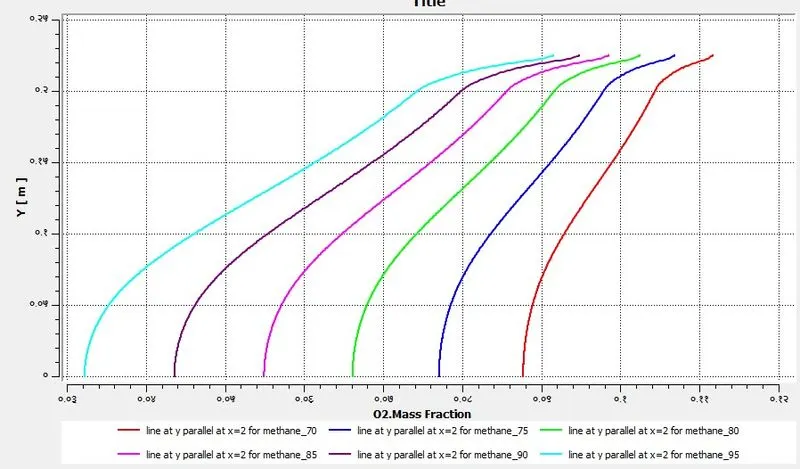
from all above plots its observed that sox,nox,soot are reducing as line approaches toward outlet.Also as content of water increase less mass fraction near axis is observed for soot,mox,co,co2ch4 but vice versa for o2 and n2.
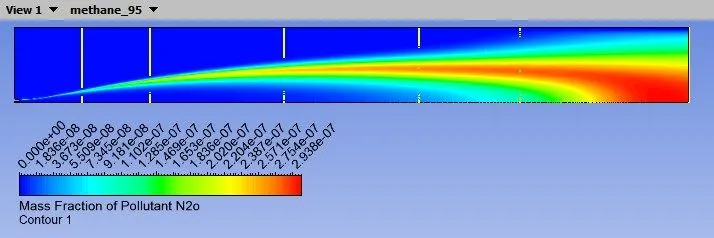
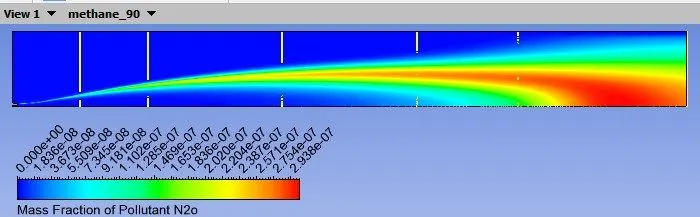
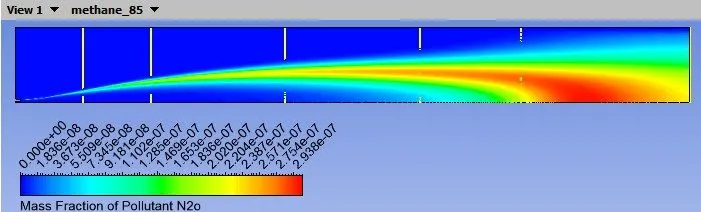
contour of N2 for methane 95to70 percent percent part 2
contour of n2o for methane 95 on plane xy
contour of n2o for methane 90 on plane xy
contour of n2o for methane 85 on plane xy
contour of n2o for methane 80 on plane xy
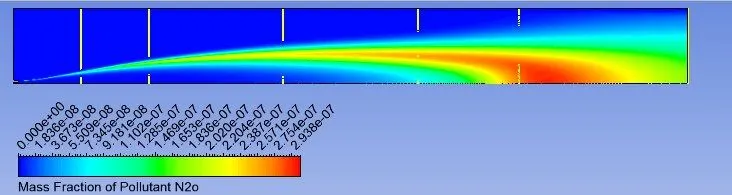
contour of n2o for methane 75 on plane xy
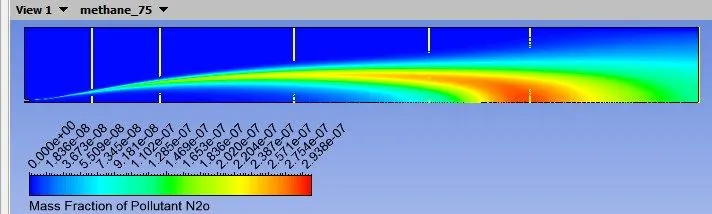
contour of n2o for methane 70 on plane xy
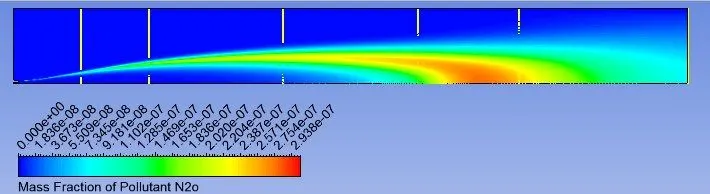
from above contour, its said that as water contain increase there is a decrease in nitrogen dioxide
contour of soot for methane 95 vs methane contains 70 percent part 2
contour of soot for methane 95 on plane XY
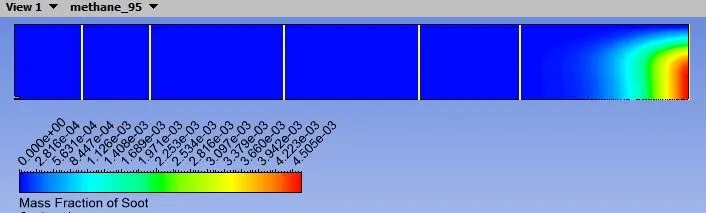
contour of soot for methane 70 on plane XY
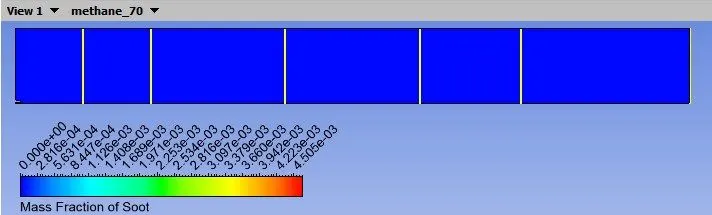
from above its observe that for 30 per cent of water contain fuel no soot are formed.
below table shows max values achieved in plane 1
| methane contant | Ch4 | Co | Co2 | H2o | Pollutant N2o | Mass Fraction of Pollutant No | Soot | N2 | O2 | Temperature |
| methane-70 | 7.00E-01 | 7.12E-02 | 1.40E-01 | 3.00E-01 | 2.78E-07 | 3.24E-04 | 1.00E-05 | 7.70E-01 | 2.30E-01 | 2.238e+03 [K] |
| methane-75 | 7.50E-01 | 6.91E-02 | 1.41E-01 | 2.50E-01 | 3.00E-07 | 4.48E-04 | 1.56E-04 | 7.70E-01 | 2.30E-01 | 2.256e+03 [K] |
| methane-80 | 8.00E-01 | 6.62E-02 | 1.42E-01 | 2.00E-01 | 2.95E-07 | 5.95E-04 | 2.17E-03 | 7.70E-01 | 2.30E-01 | 2.271e+03 [K] |
| methane-85 | 8.50E-01 | 5.52E-02 | 1.42E-01 | 1.50E-01 | 3.00E-07 | 7.65E-04 | 3.53E-03 | 7.70E-01 | 2.30E-01 | 2.285e+03 [K] |
| methane-90 | 9.00E-01 | 3.99E-02 | 1.43E-01 | 1.27E-01 | 3.03E-07 | 9.57E-04 | 4.18E-03 | 7.70E-01 | 2.30E-01 | 2.297e+03 [K] |
| methane-95 | 9.50E-01 | 1.79E-02 | 1.44E-01 | 1.24E-01 | 3.03E-07 | 1.17E-03 | 4.65E-03 | 7.70E-01 | 2.30E-01 | 2.309e+03 [K] |
from above table its observe that max value on plane XY soot,nitrogen dixide,ch4,nitrogen diaoxide achieved less mass fraction but where as carbon monoxide achieved value is increases.But also max temperature on plane XY decreasing as adding percentage of water to the methane.
at outlet max values in part2
| methane contant | Temperature | Soot | Mass Fraction of Pollutant No | n2o | co | co2 | ch4 |
| methane-70 | 1.661e+03 [K] | 2.48E-06 | 1.33E-04 | 8.32E-08 | 1.03E-05 | 9.04E-02 | 8.62E-07 |
| methane-75 | 1.759e+03 [K] | 9.96E-05 | 2.10E-04 | 1.29E-07 | 2.80E-05 | 9.76E-02 | 2.67E-06 |
| methane-80 | 1.857e+03 [K] | 2.17E-03 | 3.26E-04 | 1.81E-07 | 6.95E-05 | 1.05E-01 | 7.60E-06 |
| methane-85 | 1.955e+03 [K] | 3.53E-03 | 4.98E-04 | 2.33E-07 | 1.59E-04 | 1.13E-01 | 2.02E-05 |
| methane-90 | 2.050e+03 [K] | 4.18E-03 | 7.49E-04 | 2.77E-07 | 3.39E-04 | 1.20E-01 | 5.10E-05 |
| methane-95 | 2.141e+03 [K] | 4.65E-03 | 1.08E-03 | 3.00E-07 | 6.75E-04 | 1.27E-01 | 1.24E-04 |
from above table its observe that as water content increase it reduces soot,nox,ch4,co,co2 and temperature at outlet is also decresing.
Conclusion
- Methane with air is simulated in the first part with volumetric eddy dissipation model and in the combustion domain, the maximum temperature achieved by flow and also different mass fraction vs radii is plotted.
- In part two methane is premixed with water and then subjected to computational domain along with the air is simulated in this mass fraction of different species are plotted and it is observed that due to water addition soot and NOx formation are reduce also the lower temperature of exhaust gas are achieved and its also beneficial for the environment.
- Also to reduce computational expense axisymmetric approach is done. By adding Puedo transient control with length scale method of conservative and length time scale as one in part one it is observed that its not converged to criteria of residual which are set but; in part two By adding Puedo transient control with length scale method of aggressive and length time scale as five in part two it's observed that it is converged to criteria of residual which are set. [4]
Future scope
- this simulation can be solved using a finite rate chemistry model and its observed that there is no combustion but not present above and it may be realistic because the temperature at the inlet is not high so a comparative study can be made also mesh convergence and also more cells near the axis incorporated to get a good result.
- Also, it observes that without Puedo transient in steady-state solver to converge to a solution more than 2000 iteration are required but that study is not presented here.[4]
- by changing turbulence intensity value solution also changes crucially as it depends on the eddy dissipation turbulence model which equation solve din small control volume so finding intensity and epsilon value is a crucial part to further compare it with real experimental value and analytical solution.
References
2) https://www.sciencedirect.com/science/article/pii/S1876610217337724
3) https://link.springer.com/article/10.1007/s00773-015-0303-8
4) Ansys fluent theory manual and user guide.