Week-4 Challenge WOT Condition Part-2
Questions :
- What is the difference between mapped and dynamic model of engine, motor and generator? How can you change model type?
- How does the model calculate miles per gallon? Which factors are considered to model fuel flow?
- Run the HEV ReferenceApplication with WOT drive cycle. Change the grade and wind velocity in the environment block. Comment on the results.
- Keeping all other parameters same, compare the simulated results of hybrid and pure electric powertrains.
Aim :
To Study the Powertrain Blockset and determine the results for below given conditions.
- Differentiate between the mapped and dynamic models used in MATLAB/Simulink.
- Study and calculate the model for miles per gallon and also state the factors considered to model fuel flow.
- Simulate the HEV Reference Application with WOT cycle and comment on the results w.r.t to change in the grade and wind velocity in the environment block with the defaults value.
- Simulate and compare the results of hybrid and Pure EV powertrains with WOT drive cycle.
A brief introduction to Powertrain Blockset :
Powertrain Blockset provides fully assembled reference application models of automotive powertrains, including gasoline, diesel, hybrid, and electric systems. It includes a component library for simulating engine subsystems, transmission assemblies, traction motors, battery packs, and controller models. Powertrain Blockset also includes a dynamometer model for virtual testing. MDF file support provides a standards-based interface to calibration tools for data import.
Powertrain Blockset provides a standard model architecture that can be reused throughout the development process. You can use it for design tradeoff analysis and component sizing, control parameter optimization, and hardware-in-the-loop testing. You can customize models by parameterizing components in a reference application with your own data or by replacing a subsystem with your own model.Powertrain Blockset provides two types of models Mapped and Dynamic.]
Solutions :
Question 1 :
- What is the difference between mapped and dynamic model of engine, motor and generator? How can you change model type?
| Mapped model | Dynamic model |
|
|
|
|
- Difference between Mapped and Dynamic Model of Engine :
Mapped Model of Engine :
It is used to measure the performance parameters of the vehicle by using standard lookup tables which are preferred to the system. This type of modelling is less accurate. The lookup tables value are based on the values of brake torque, commanded torque and engine speed. If any other parameter like Input engine temperature is selected then lookup table values are also a function of the temperature parameter. The data extracted from lookup tables are air mass flow, fuel flow, emission data, exhaust temperature and efficiency. This data is used to find out other parameters which are needed by the end-user.It is the default settings in the powertrain blockset.
Dynamic Model of Engine :
This type of model uses real-time data fed by the user at run time for modelling. This model is more accurate than the mapped engine model. This type of model is used when the data of subsystems of a vehicle is required. We can calculate Brake torque, fuel flow, port gas mass flow, exhaust temperature, exhaust mass flow rate and exhaust emissions.
- Difference between Mapped and Dynamic Model of Motor :
Mapped Model of Motor :
The mapped motor works in torque control mode. This type of motor is used when the user requires a faster simulation and doesn't have the knowledge of motor parameters. The output torque and reference torque is compared and changes are made. Input torque or speed can be specified, electrical losses and maximum motor power and torque can be defined.
Dynamic Model of Motor :
It is a three-phase interior permanent magnet synchronous motor (PMSM) is used. The block uses three-phase input voltages to regulate the individual phase currents, allowing control of the motor torque or speed. This block is used when the user knows what parameters are to be used in that particular simulation. This motor is more accurate.
- Difference between Mapped and Dynamic Model of Generator :
Mapped Model of Generator :
This block is also similar to other blocks. Most of the data required are taken from the lookup tables corresponding to the given input parameters. Its simulation time is less.
Dynamic Model of Generator :
It involves the user entering the parameters manually during the run time for their particular applications. The results take time and are more accurate.
-----------------------------------------------------------------------------------------------------
How can you change model type?
To change the model type of motor or generator from mapped model to the dynamic model follow the steps below :
-
We have to go to the Modelling page. Under the design window, click on the dropdown arrow.
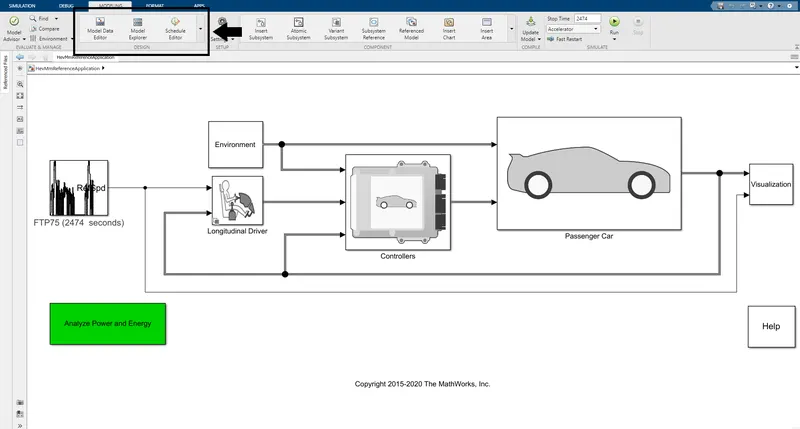
Fig : The Simulink window showing the modelling command
- then click on the Variant Manager, a new window will pop up
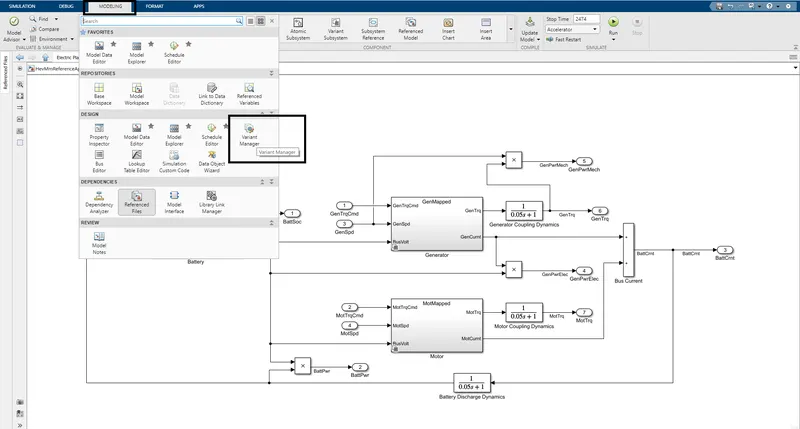
fig: The variant manager command window inside the vehicle sub-block
-
after selecting the GenDynamic, do the right-click and select the Set as label Mode Active case.
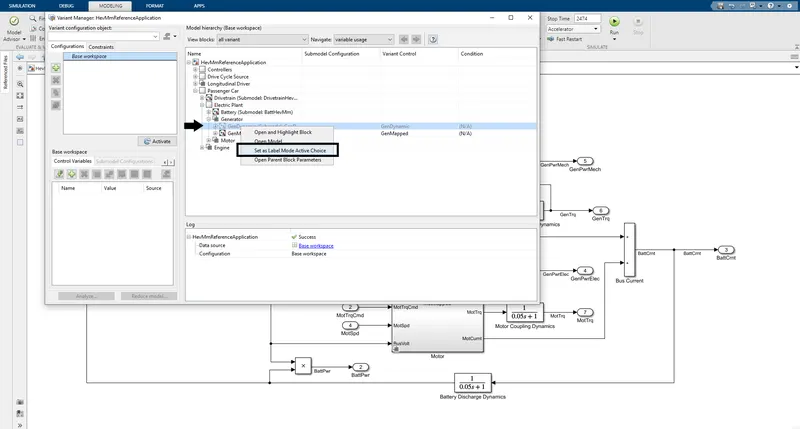
fig: The selection window for changing the mapped to dynamic parameters
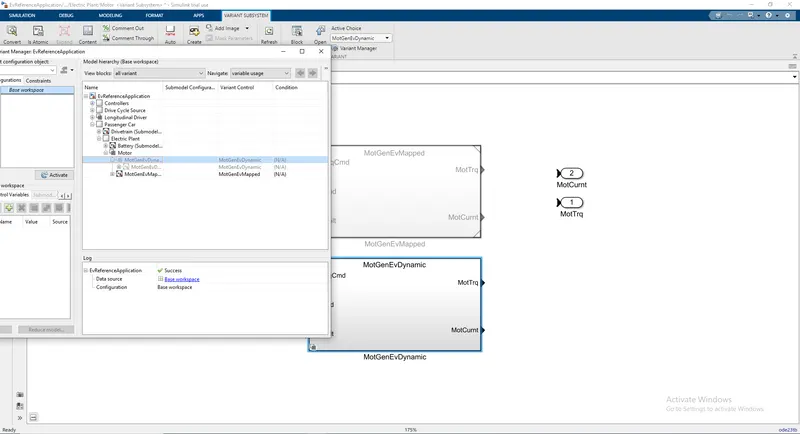
- The changed model to dynamic is shown below :
-----------------------------------------------------------------------------------------------------
Question 2 :
- How does the model calculate miles per gallon? Which factors are considered to model fuel flow?
Miles per gallon (MPG) is a fuel economy rating determined by how far a car can travel on a gallon of gasoline or diesel. Although the metric version would be kilometres per litre, MPG is adopted in many metric-system countries, like USA, Canada and other European Nations.
While it is both cheaper and better for the environment to achieve a higher MPG rating, there is a curve, that the EPA calls the "MPG Illusion" that shows the cost-benefits of increasing MPG decrease with the higher rating. For example, to travel 1,000 miles, a car that gets 10 MPG will require 100 gallons of fuel. Conversely, a car that gets 15 MPG will require 67 gallons of fuel. In this case, an increase of just 5 MPG cuts fuel consumption by 33%. When a car gets 30 MPG, however, increasing its mileage to 35 MPG will only save 5 gallons of fuel over 1,000 miles.
The below figure is the block used by Simulink to calculate the MPGe to display the performance of the vehicle. 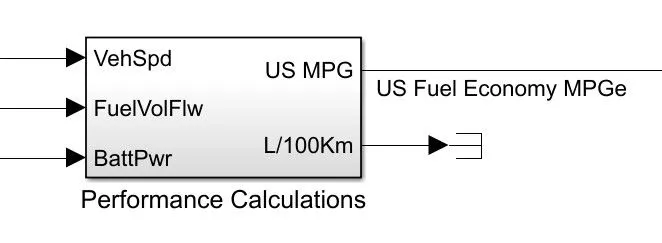
fig: Simulink block for the Performance calculation
The sub-block of the Performance Calculation is shown by the below figure.
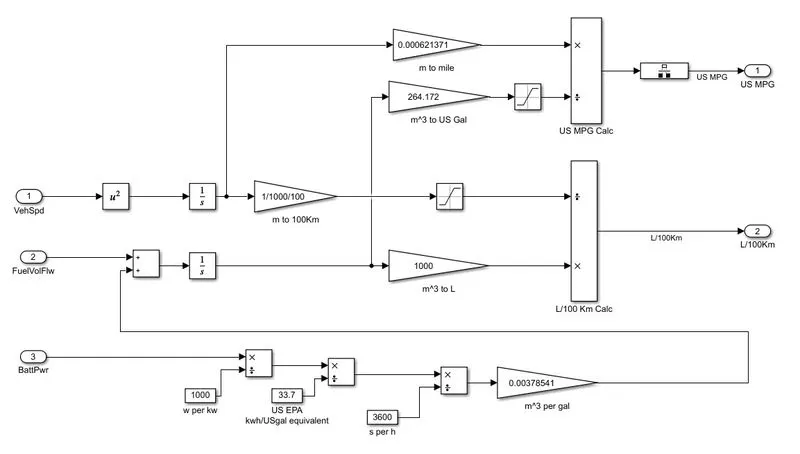
fig : Simulink sub-block of the Performance Calculation :
The factors considered to model fuel flow:
- Vehicle speed
- Fuel volume flow
- Battery power
Steps to calculate the MPGe:-
- As we know, that 1 gallon of gas is equal to 33.7 kWh of electricity.
- So battery power is first converted into KW (W/1000) then its divides by 33.7 kWh.
- The fuel equivalent of battery is added to the fuel flow.
- Using vehicle speed and time the distance of travel is calculated.
- Then distance is converted into miles by conversions.
- Then as we have the fuel flow in m3">m3m3 and distance in miles and we can calculate the fuel efficiency.
-----------------------------------------------------------------------------------------------------
Question 3 :
- Run the HEV ReferenceApplication with the WOT drive cycle. Change the grade and wind velocity in the environment block. Comment on the results.
HEV Reference Application Model with WOT :
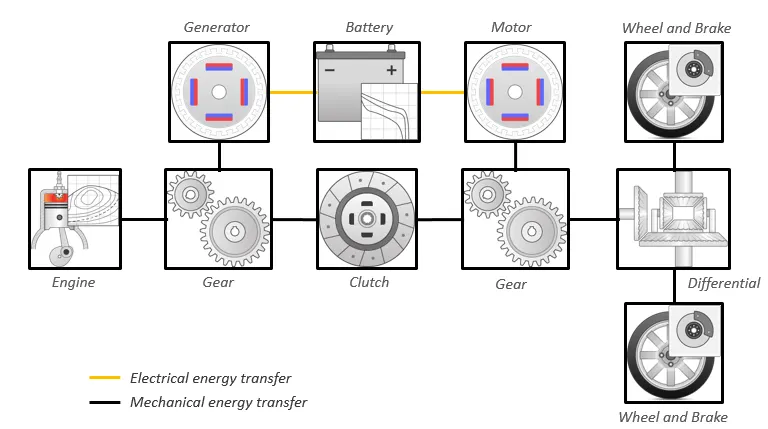
Simulink Model for HEV :
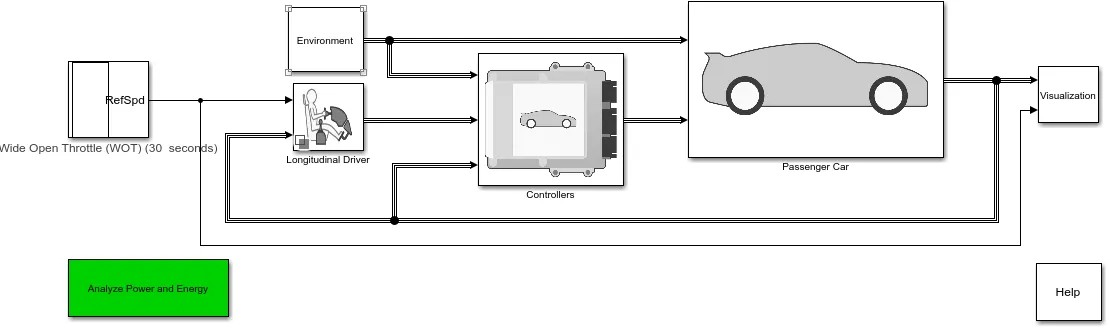
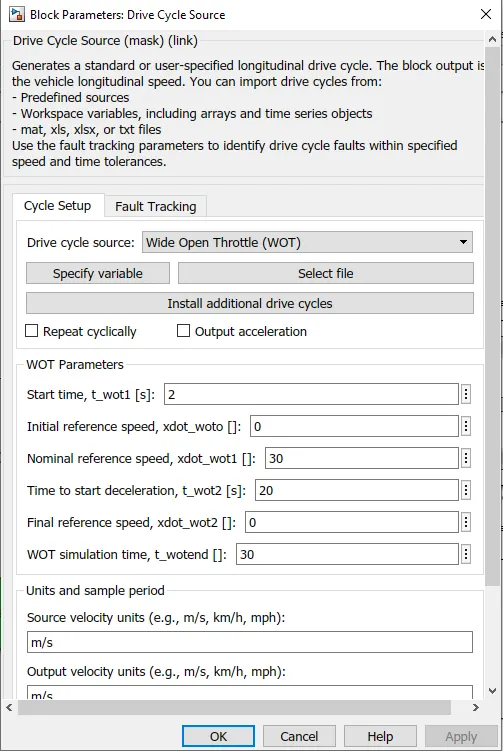
WOT conditions :
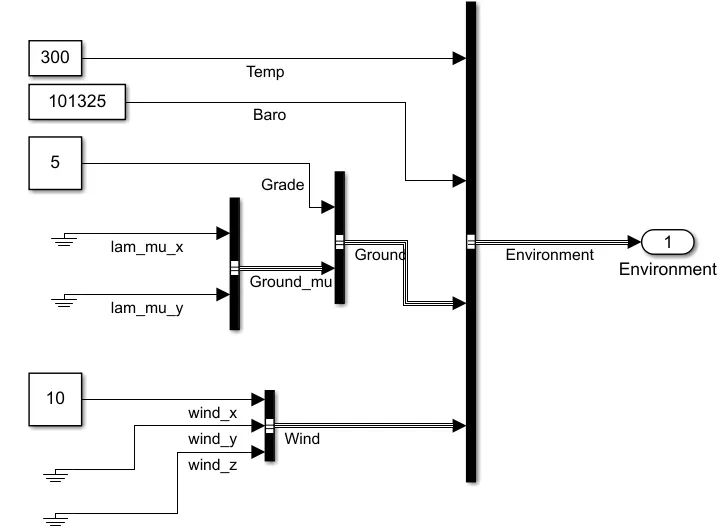
Environment Conditions :
- Grade = 5
- Wind Velocity = 10 m/s
Results :
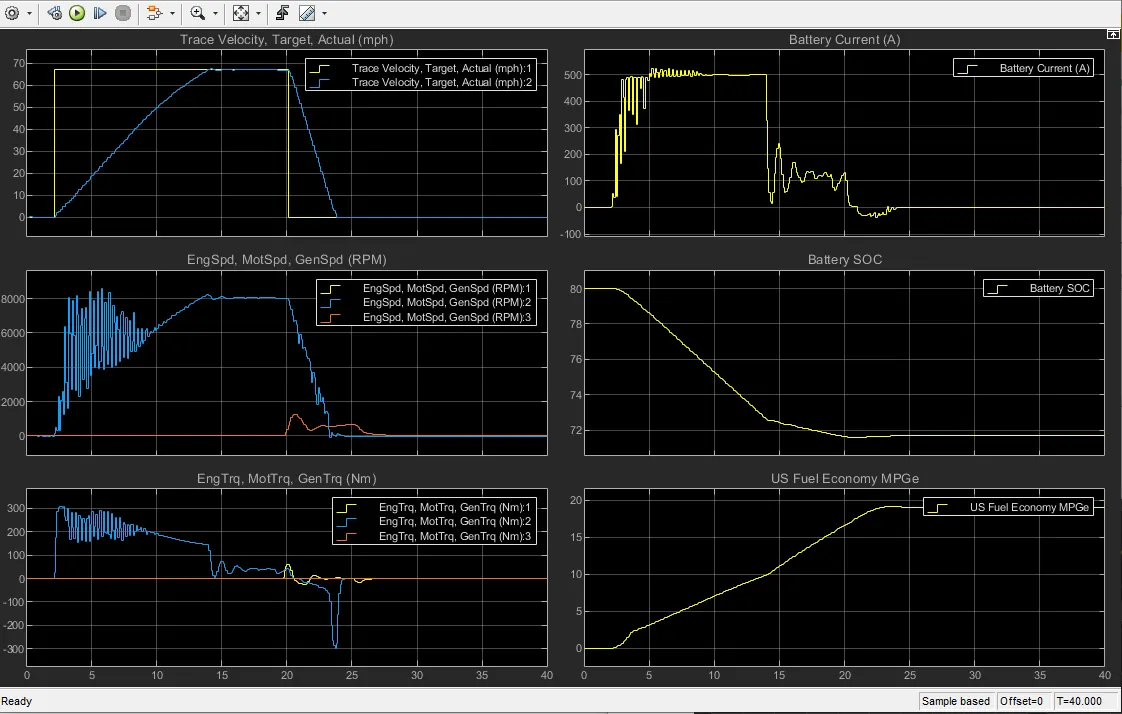
Below results can be seen through the scope in the Visualization block.
- HEV with WOT with default Environment conditions.
- HEV with WOT with Environment conditions.
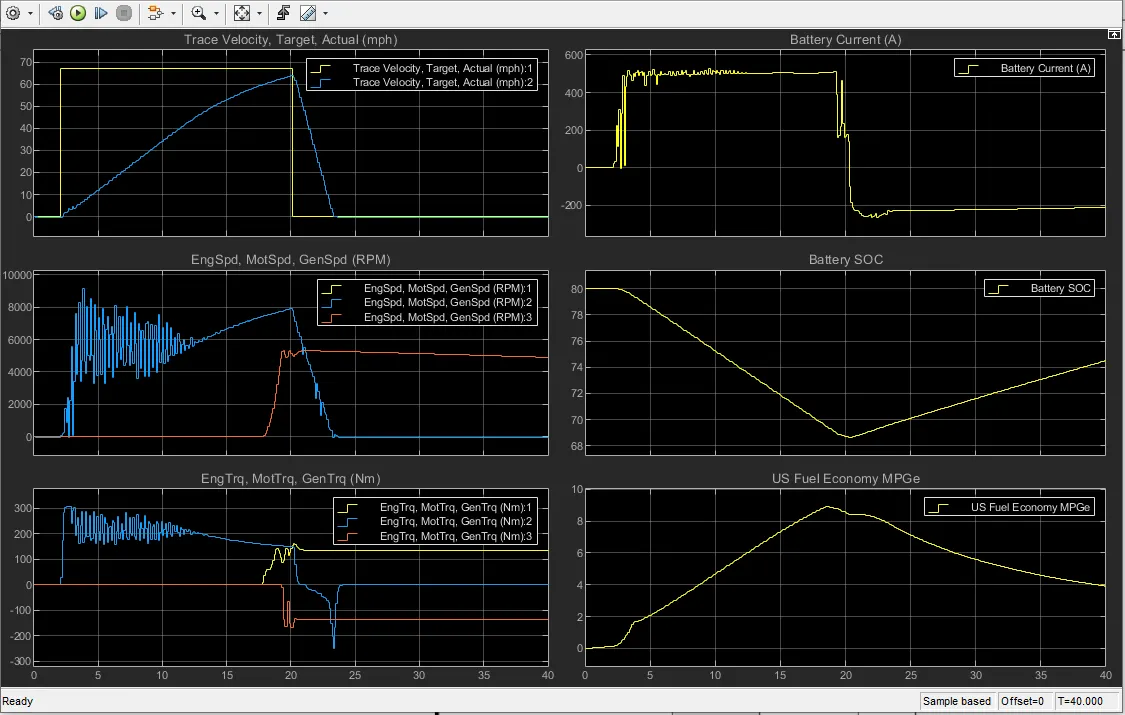
Results and Explanation for the above plots :
| Plot 1 : Trace velocity – Target vs Actual |
|
| Plot 2 : Engine, Motor & Generator Speed. |
|
| Plot 3 : Engine , Motor Torque & Generator torque |
|
| Plot 4 : Battery Current |
|
|
Plot 5 : SOC
|
|
|
Plot 6 : MPGe
|
|
---------------------------------------------------------------------------------------------------------------------
- Question 4 :
Keeping all other parameters the same, compare the simulated results of hybrid and pure electric powertrains.
EV Reference Application Model with WOT :
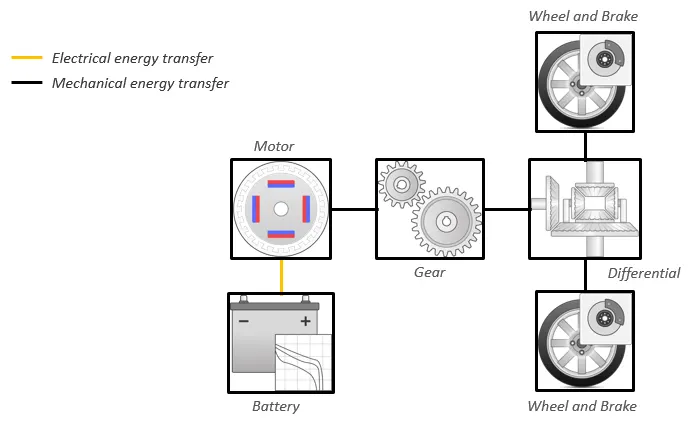
Simulink Model for EV :
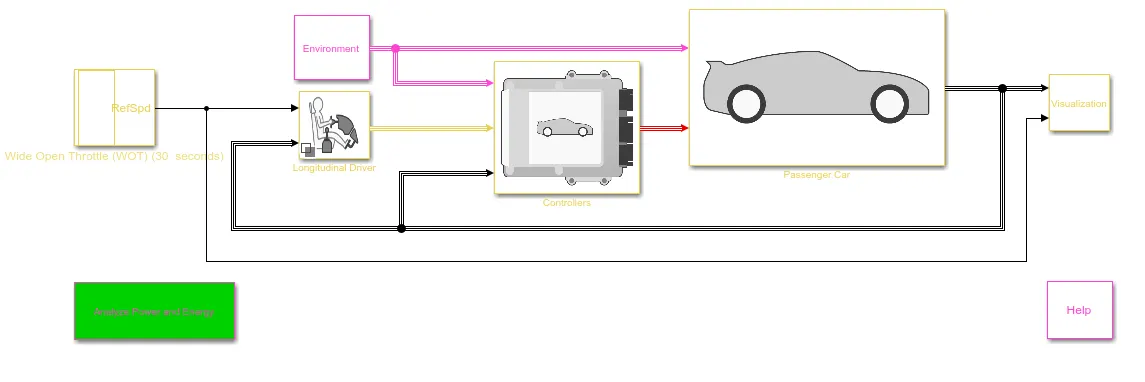
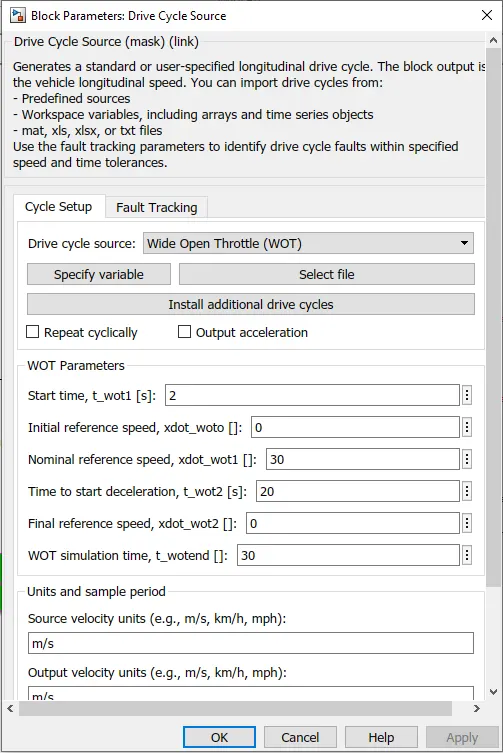
WOT conditions :
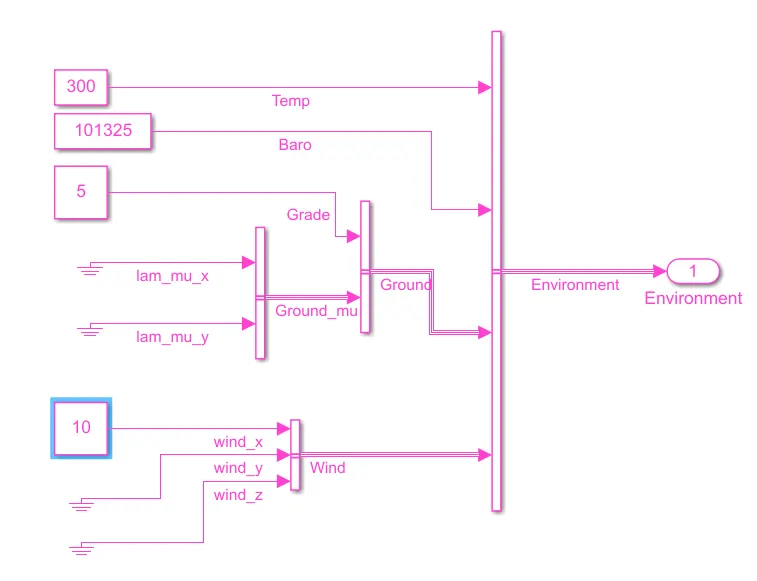
Environment Conditions:
- Grade = 5
- Wind Velocity = 10 m/s
Result :
Below results can be seen through the scope in the Visualization block.
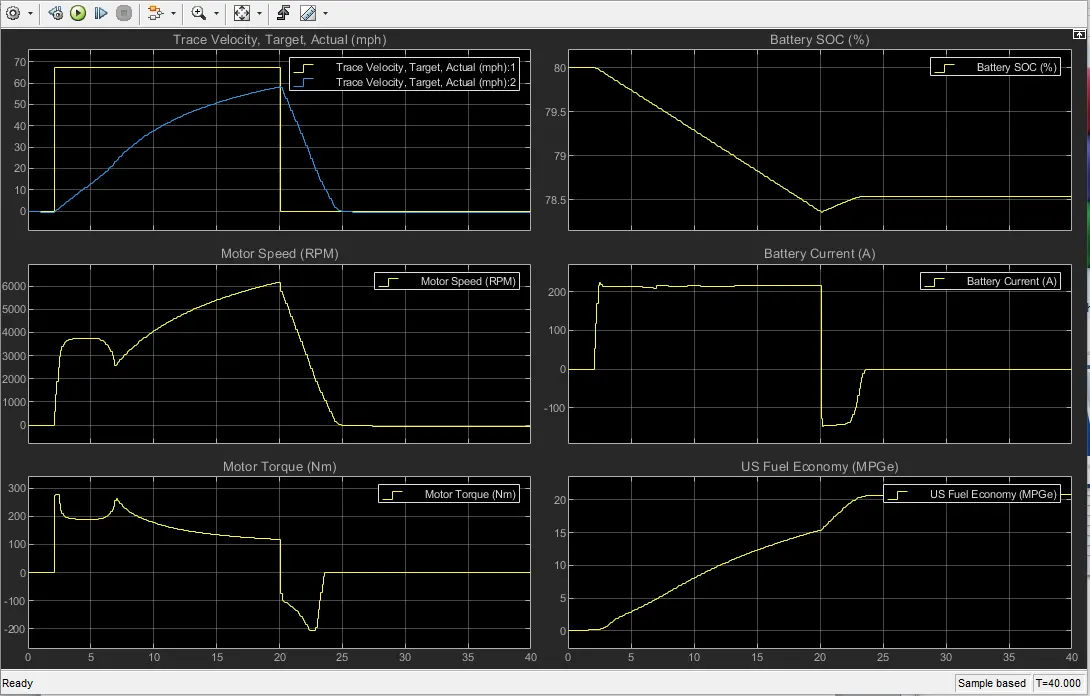
Observation from the above Plots :
- Pure EV can achieve less velocity than that of HEV. HEV can attend velocity above 60 mph but in pure EV velocity is less than 60 mph.
- Motor speed in rpm is also less than that of HEV. But path tracing is the same as that of HEV.
- But Motor torque of pure EV is almost the same as that of HEV.
- Battery current uses is almost half in pure EV to produce power as that of HEV.
- Also as battery use is less, battery draining is low & it can be seen from the SOC graph. From the SOC graph, it can be seen that for the same parameters battery uses is 5 times more in the case of HEV than that of pure EV, battery drains fast in the case of HEV.
- Fuel economy is also almost double in the case of pure EV than that of HEV.
Conclusion :
- Studied and explained the difference between the mapped and dynamic models of engine, motor and generators used in MATLAB/Simulink.
- Explained the calculation of the model for miles per gallon and also stated the factors considered to model fuel flow.
- Successfully simulated the HEV Reference Application model with assigned WOT cycle and commented on the results w.r.t to change in the grade and wind velocity in the environment block with the defaults value for hybrid and pure EV powertrains.
- By looking at the characteristics curves of HEV and Pure EV, we can conclude that the conventional HEV's use lead-acid battery whereas the EV's use lithium-ion cells which have more energy density. And also, EV has a superior fuel economy than a conventional HEV.
References :
- https://www.researchgate.net/publication/242474187_Experimental_investigation_of_factors_affecting_vehicle_fuel_consumption
- https://in.mathworks.com/help/autoblks/ug/hev-p0-reference-application.html
- https://afdc.energy.gov/vehicles/how-do-hybrid-electric-cars-work
- https://www.caranddriver.com/research/a31873205/mpg-meaning/
- https://in.mathworks.com/help/autoblks/ug/internal-combustion-mapped-and-core-engine-models.html