Week 3 - External flow simulation over an Ahmed body.
EXTERNAL FLOW SIMULATION OVER AN AHMED BODY
AHMED BODY: -
Ahmed body is a simplified car, used in automotive industry to investigate the flow analysis and find the wake flow around the body. This is made up of round front part, a moveable slant plane in ear of the body and a rectangular box which link the front part and the rear slant plane. This slant plane in the rear of the body to study the detachment phenomena at different angles.
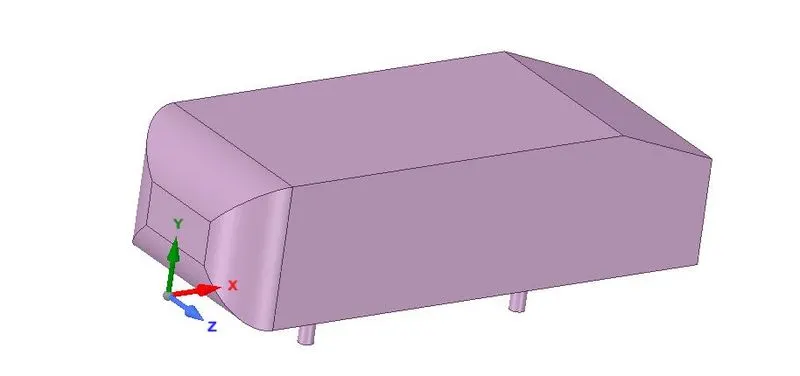
Fig (1): - Geometry of Ahmed body
The principal objective to study such a simplified car body is to tackle the flow process involved in drag production. Though perceiving the mechanisms involved in creating drag one can be able to design a car to minimize drag and therefore reducing fuel consumption and maximize vehicle performance.
Reason for the negative pressure and significance of the point of separation:
Flow around the Ahmed body is complicated to steady. Due to the slant in the rear of the vehicle, flow separation and counter rotating vortices are generated at the slant edges. The drag forces of Ahmed body reach at maximum when the slant angle 30 deg. For slant angles higher than this value, the adverse pressure gradient in between the slant and the roof is so intense that the flow fully detaches over the slant. Below this critical slant angles, the flow still separates but the pressure difference between the slant region and the side walls is still study enough to generates vortices at the lateral slant, mainly in the downstream part. As a result, the flow separating at the upstream end of the slant can coupled further to downstream. The flow around Ahmed body has several flow separations from the front to rear vehicle. The flow recirculation caused by these flow detachments contributes the vehicle’s drag. The location point at which the flow separates determine the size of the separation zone and accordingly the drag force, thus an exact simulation of the wake flow and the separation process is essential for the accurate result of the drag predictions.
Velocity, pressure contours and wake regions:
Case1: - (velocity = 25m/sec and mesh size 0.043 million)
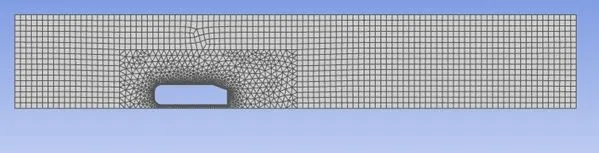
Fig(2): cross section of body
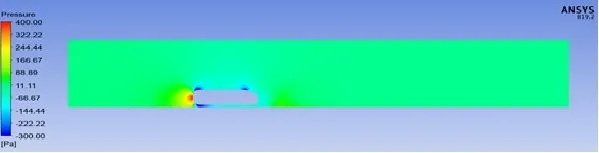
Fig(3): Pressure contour
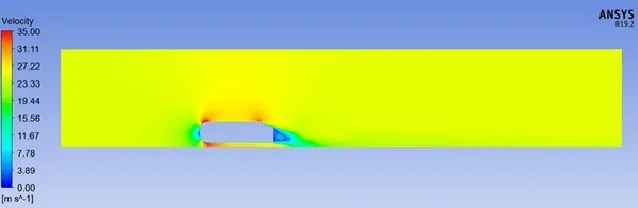
Fig(4): Velocity contour
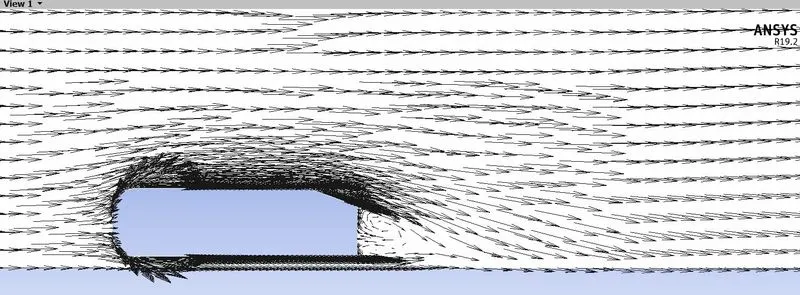
Fig(5): Showing wake region on body
Case2: - (velocity = 25m/sec and mesh size 0.099 million)
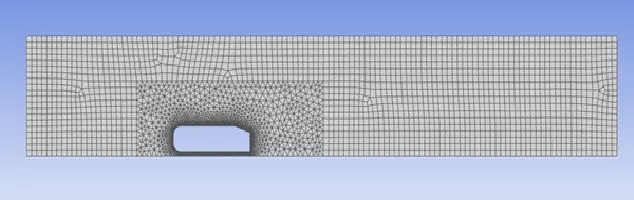
Fig(6): cross section of body
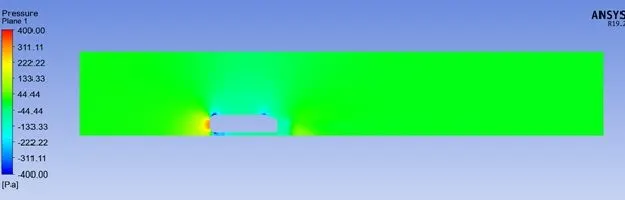
Fig (7): Pressure contour
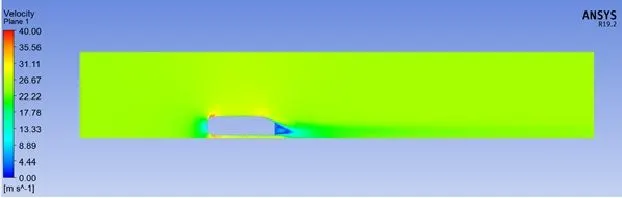
Fig(8): Velocity contour

Fig(9): Showing wake region on body
Case3: -(velocity = 25m/sec and mesh size 0.11 million)
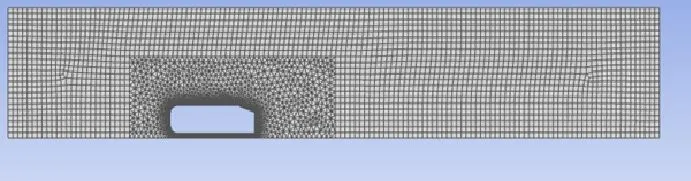
Fig(10): cross section of body
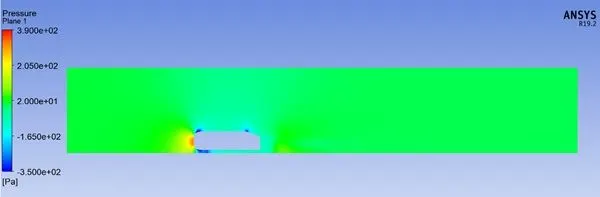
Fig(11): Pressure contour
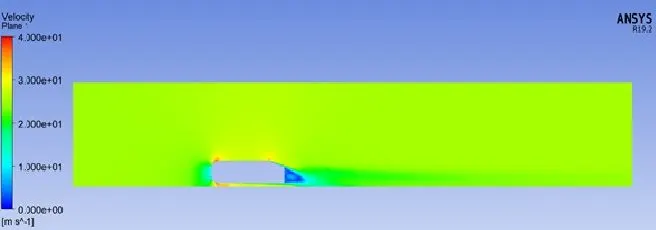
Fig(12): Velocity contour
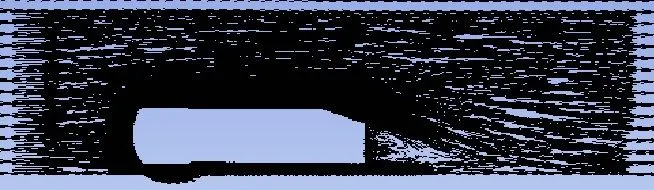
Fig(13): Showing wake region on body
Case4:- (velocity = 25m/sec and mesh size 0.21 million)
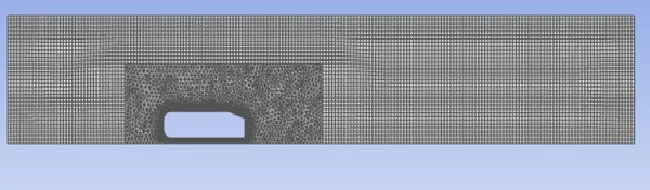
Fig(14): cross section of body
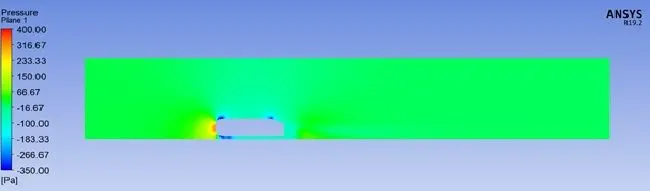
Fig(15): Pressure contour
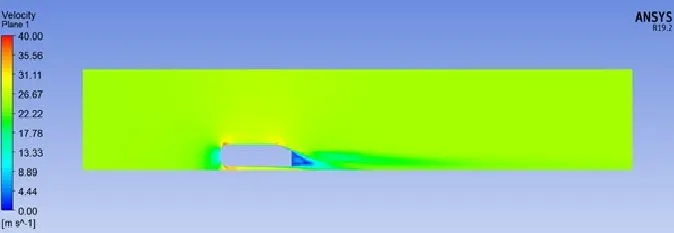
Fig(16): Velocity contour
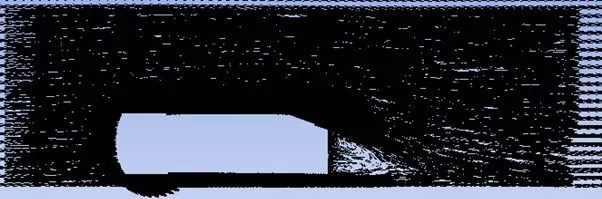
Fig(17): Showing wake region on body
GRID INDEPENDENCY TEST: -
|
|
No: cells (in million) |
cd |
cl |
|
Case1 |
0.043 |
0.338 |
0.278 |
|
case2 |
0.099 |
0.328 |
0.137 |
|
case3 |
0.11 |
0.326 |
0.131 |
|
case4 |
0.21 |
0.325 |
0.1325 |
- From above data we can say that case 2 or case 3 is good for further analysis because they are giving accuracy up to 2 decimals.