Flow over a Cylinder(Ansys Fluent)
Objective: Simulate the flow over a cylinder and explain the phenomenon of Karman vortex street.
PART-I
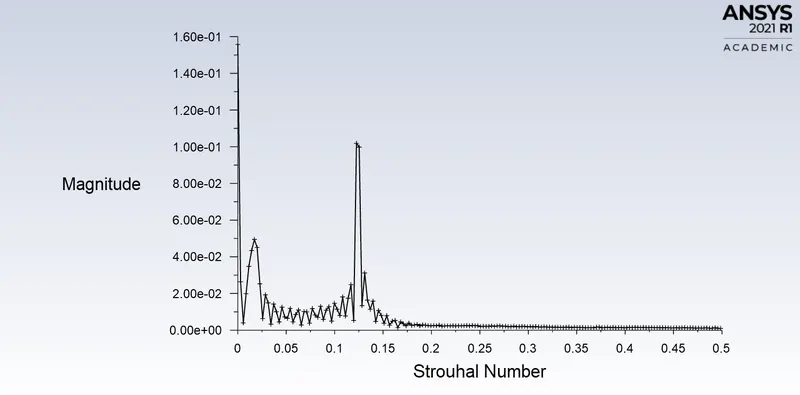
- Simulate the flow with the steady and unsteady case and calculate the Strouhal Number for Re= 100.
PART-II
- Calculate the coefficient of drag and lift over a cylinder by setting the Reynolds number to 10,100,1000,10000 & 100000. (Run with steady solver)
- Discuss the effect of Reynolds number on the coefficient of drag.
Introduction:
Karman Vortex Street
In Fluid dynamic, a Karman vortex street (or a von Karman vortex street) is a repeating pattern of swirling vortices, caused by a process known as Vortex shedding, which is responsible for the unsteady separation of flow of a fluid around blunt bodies.
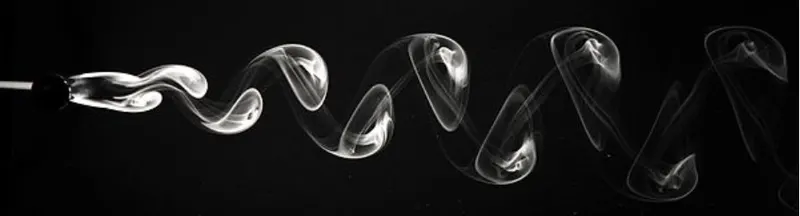
A vortex street will form only at a certain range of flow velocities, specified by a range of Reynolds numbers (Re), typically above a limiting Re value of about 90. The (global) Reynolds number for a flow is a measure of the ratio of inertia to viscous force in the flow of a fluid around a body or in a channel, and may be defined as a non-dimensional parameter of the global speed of the whole fluid flow:

where:
 = the free stream flow speed(i.e. the flow speed far from the fluid boundaries
  like the body speed relative to the fluid at rest, or an inviscid flow speed, computed through the Bernoulli equation), which is the original global flow parameter, i.e. the target to be non-dimensionalized.
 = a characteristic length parameter of the body or channel
 = the free stream kinematic viscosity parameter of the fluid, which in turn is the ratio:

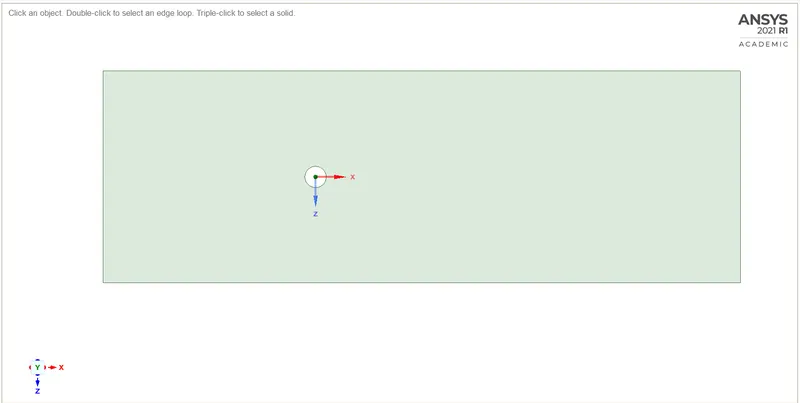
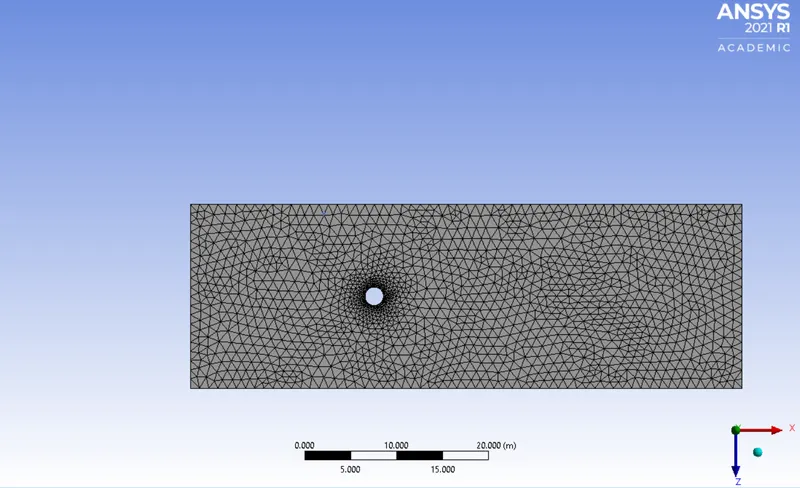
- But in the meshing nodes, the shape is more quadrilateral than the triangle so we need to change it by changing the method to the triangle in the insert option.
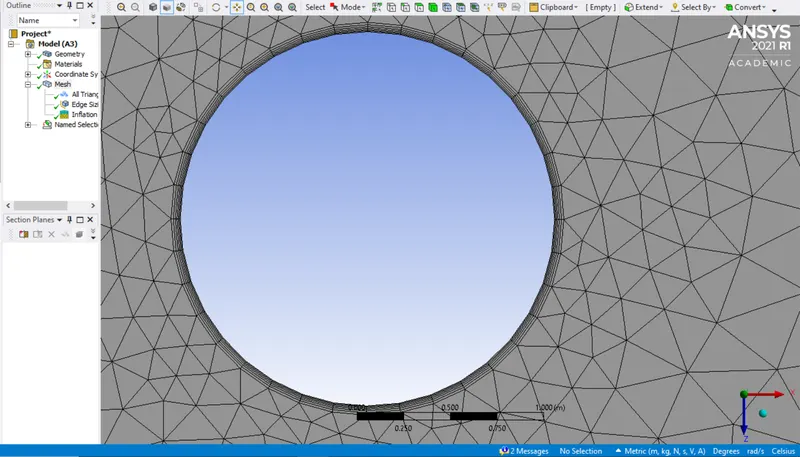
- After changing the node's shape into triangles we should improve the mesh around the cylinder by sizing in the mesh which is used to control precisely the mesh.
- Then we should add inflation which is used to create a body-fitted mesh.
3. Setting up Ansys Fluent:
Fluent details/Procedure
- Laminar model
- Fluid: Air
- Method of discretization: SIMPLE
- Density/kinematic viscosity: 1/0.05
- Creating a monitor point behind the cylinder by selecting points under surfaces.
- After creating the monitor point, create reports/plots for drag, lift velocity w.r.t cylinder.
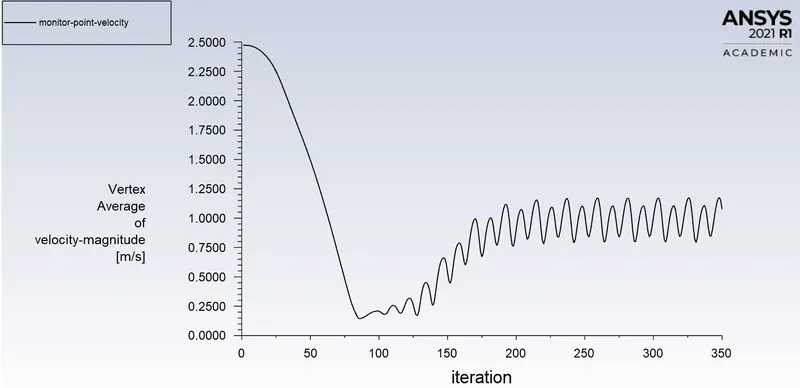
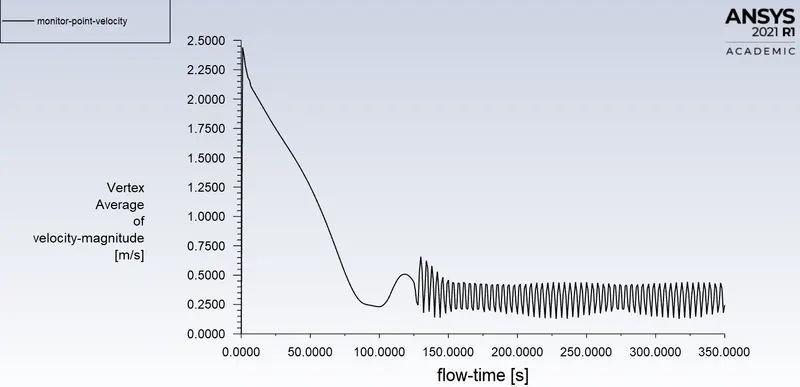
- Create plots for the velocity at the monitor point to analyze the vortex shedding.
- Use hybrid initialization for steady-state and standard for transient state simulations.
PART-I
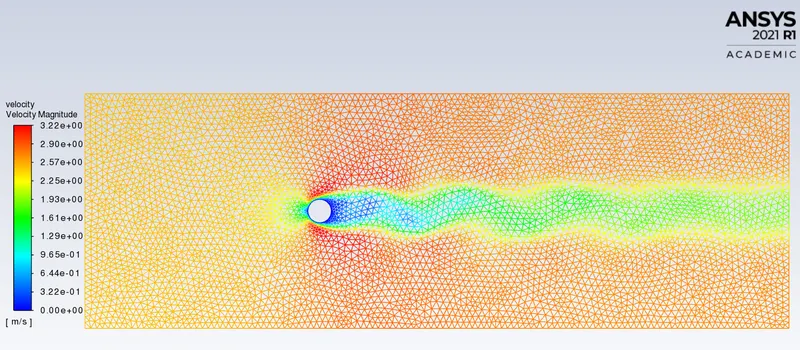
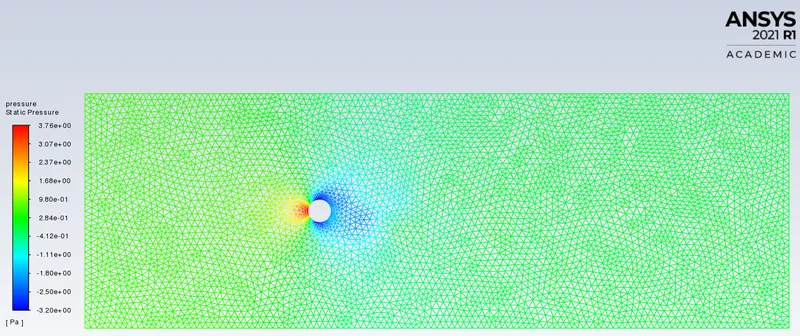
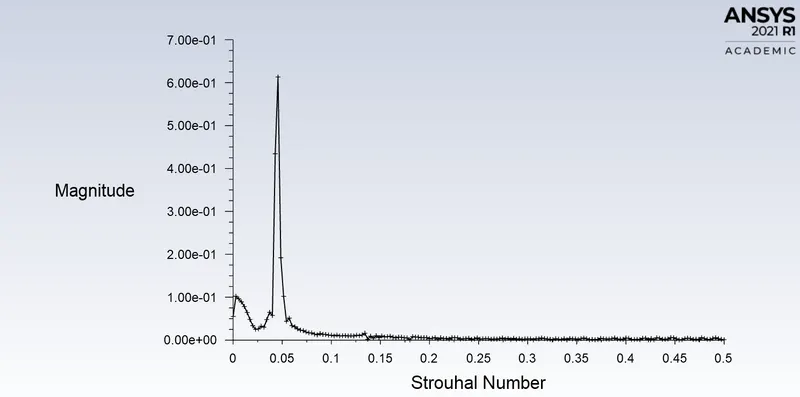
Simulate the flow with the steady and unsteady case and calculate the Strouhal Number for Re= 100 and inlet velocity 2.5 m/s.
Steady-state:
- Velocity and Pressure Contour
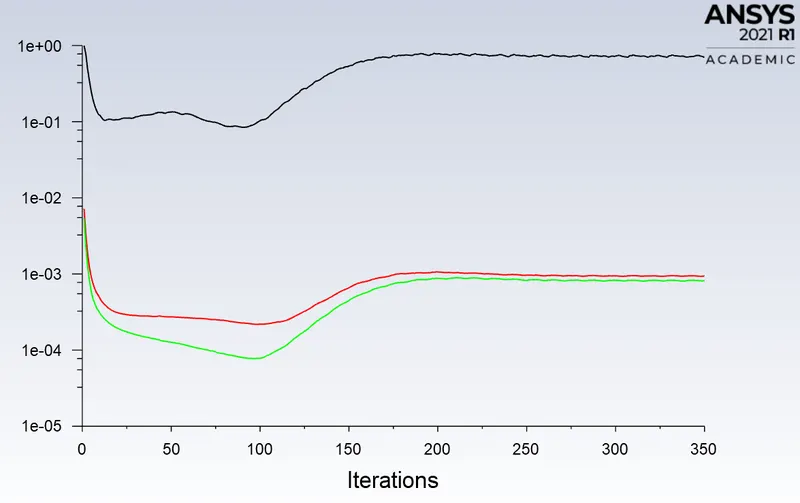
- Residual plot
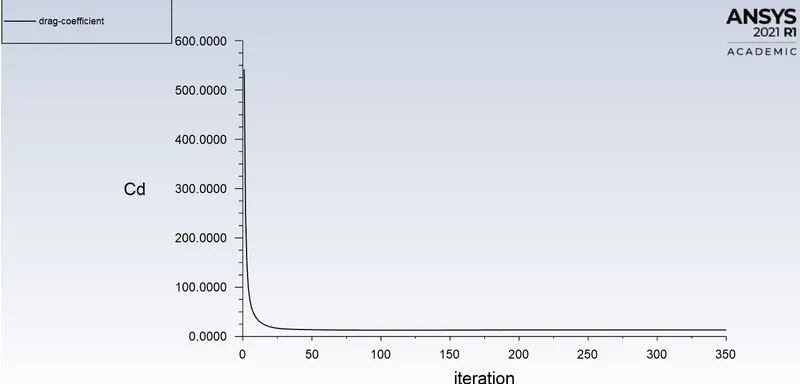
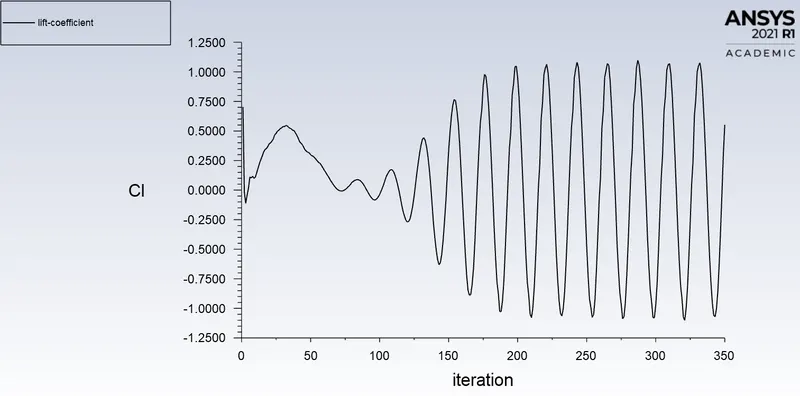
- Drag and Lift coefficient
- Velocity at the monitor point
- Strouhal Number plot
Unsteady-state:
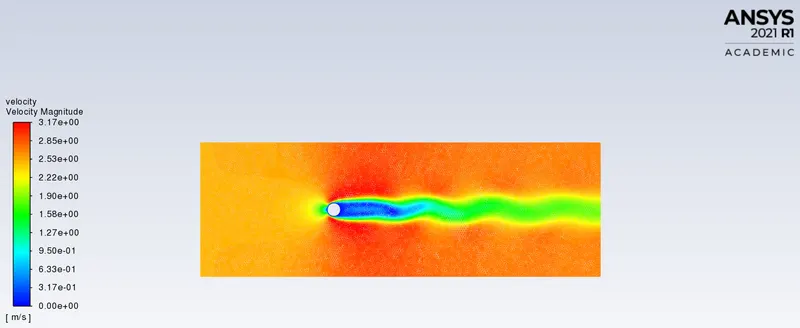
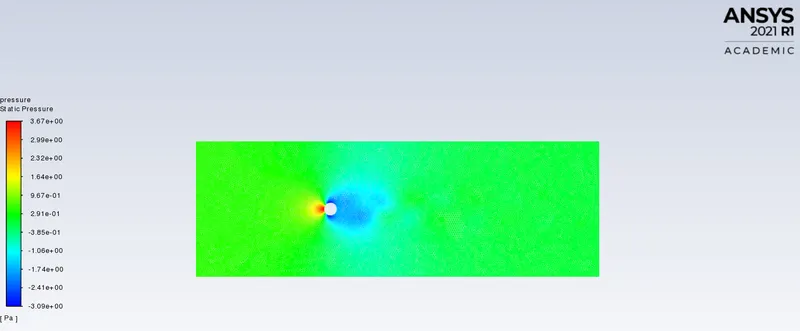
- Velocity and Pressure Contour
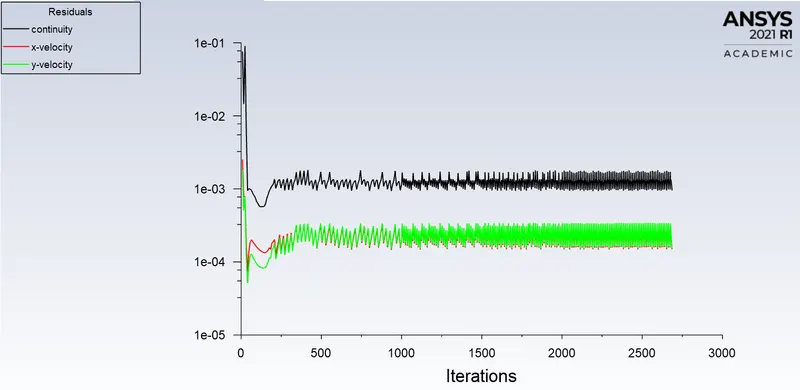
- Residual plot
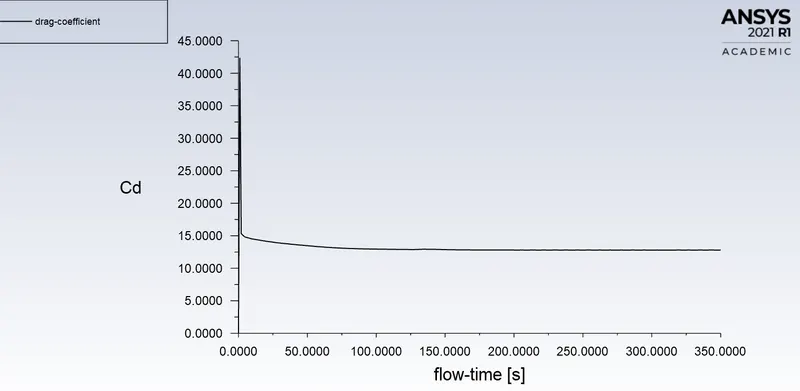
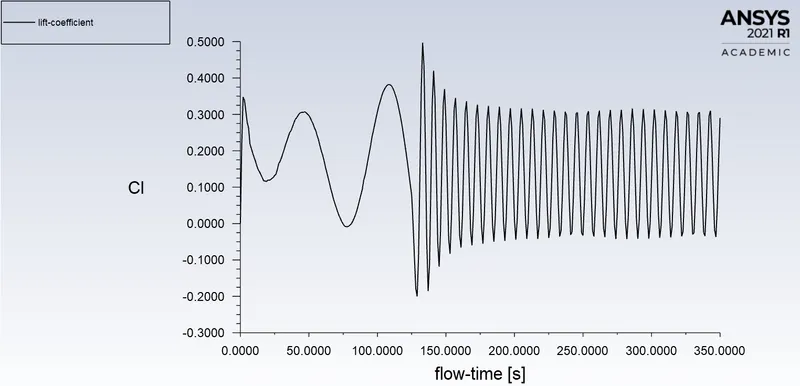
- Drag and Lift coefficient
- Velocity at the monitor point
- Strouhal Number plot
PART-II
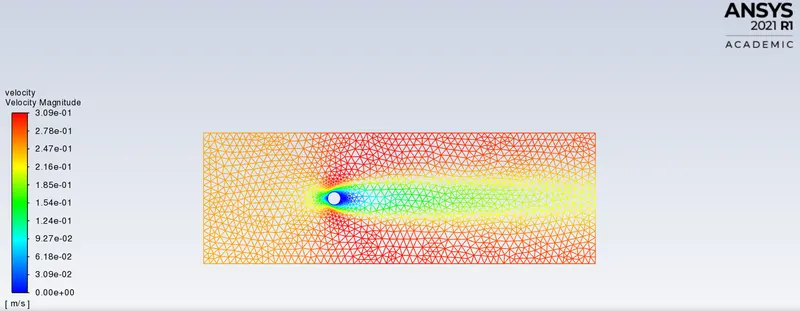
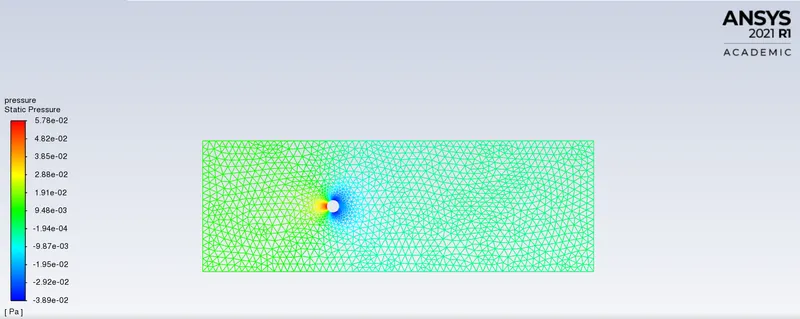
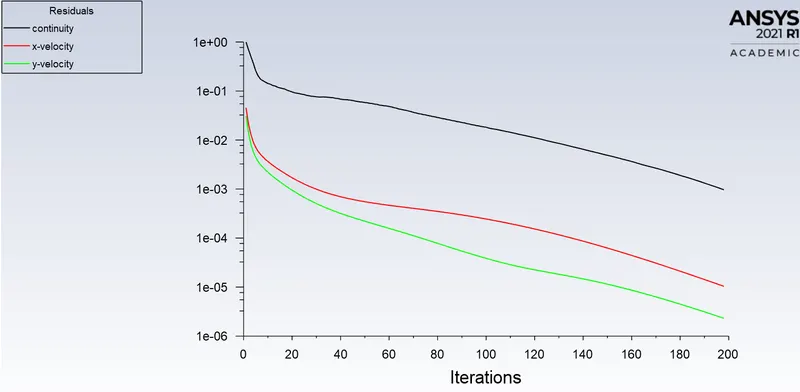
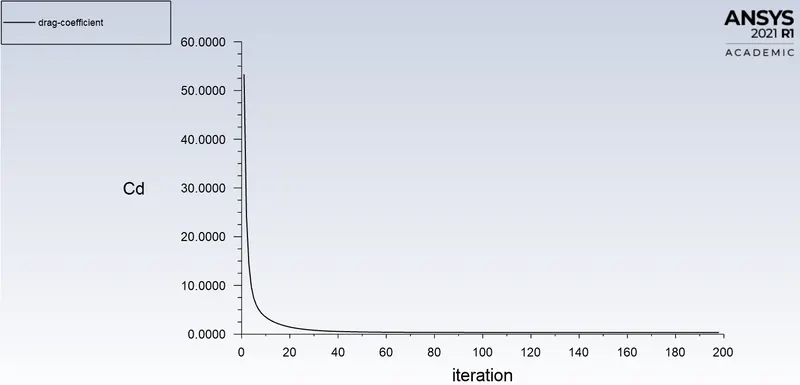
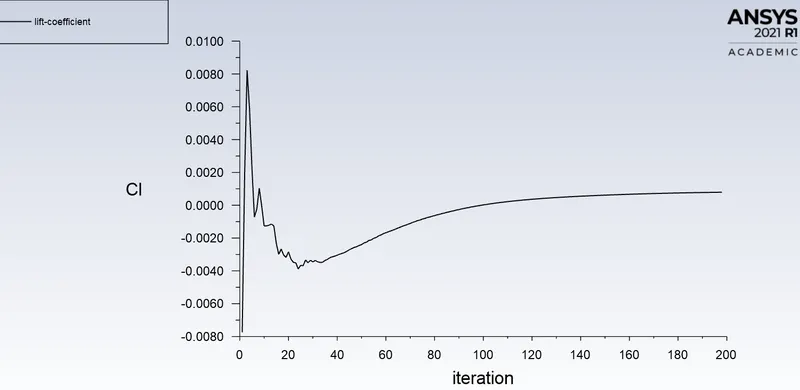
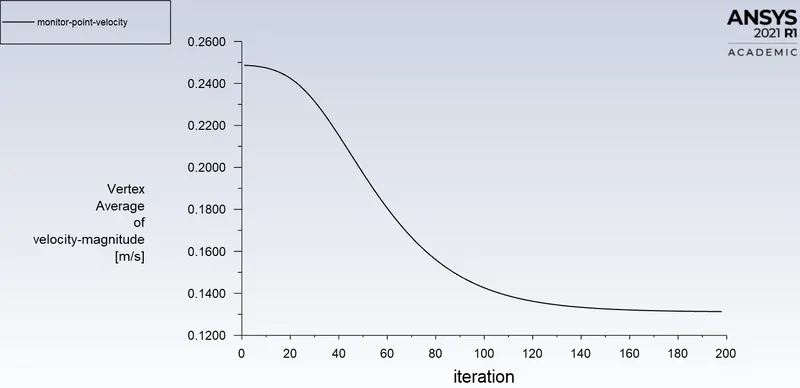
a. Simulating the flow with a steady-state solver for Re=10 and inlet velocity=0.25 m/s.
- Velocity and Pressure Contour
- Residual plot
- Drag and Lift coefficient
- Velocity at the monitor point
b. Simulating the flow with a steady-state solver for Re=100 and inlet velocity=2.5 m/s.
- Velocity and Pressure Contour
- Residual plot
- Drag and Lift coefficient
- Velocity at the monitor point
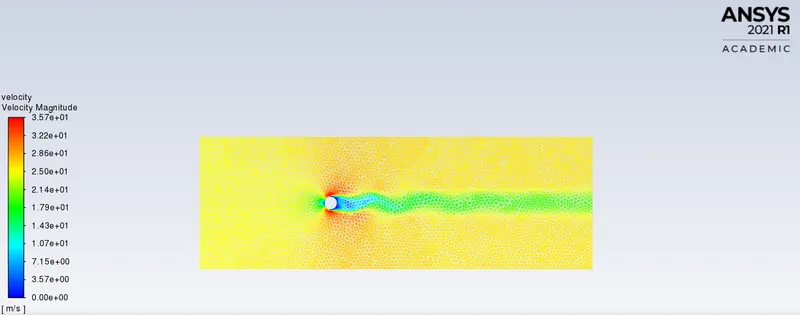
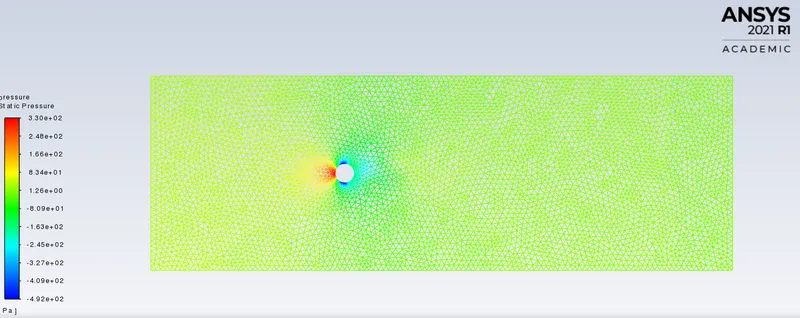
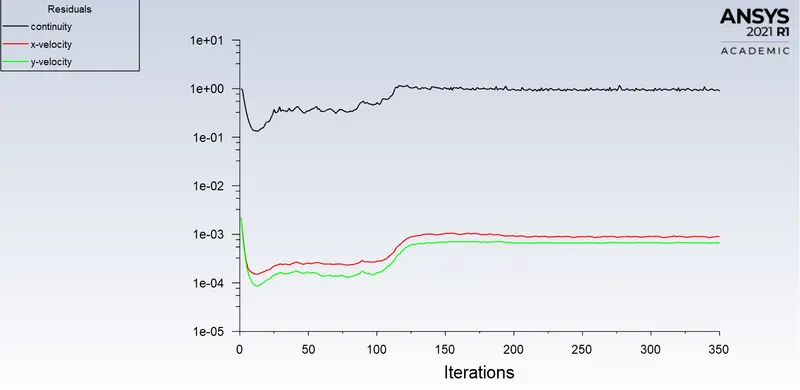
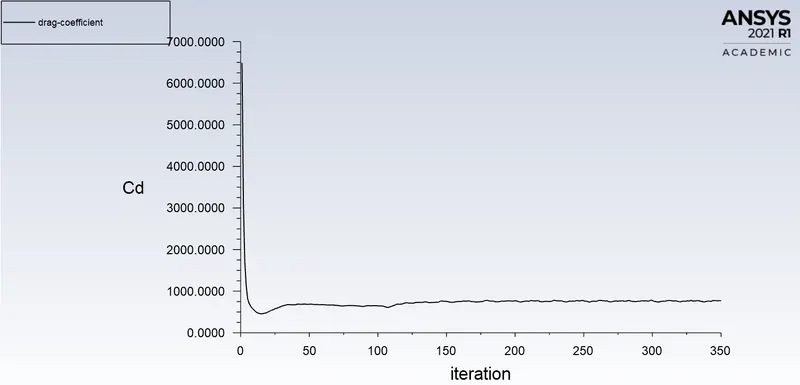
c. Simulating the flow with a steady-state solver for Re=1000 and inlet velocity=25 m/s.
- Velocity and Pressure Contour
- Residual plot
- Drag and Lift coefficient
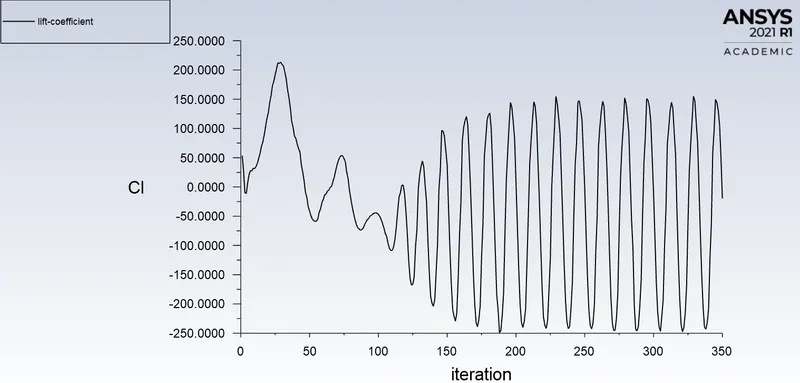
- Velocity at the monitor point
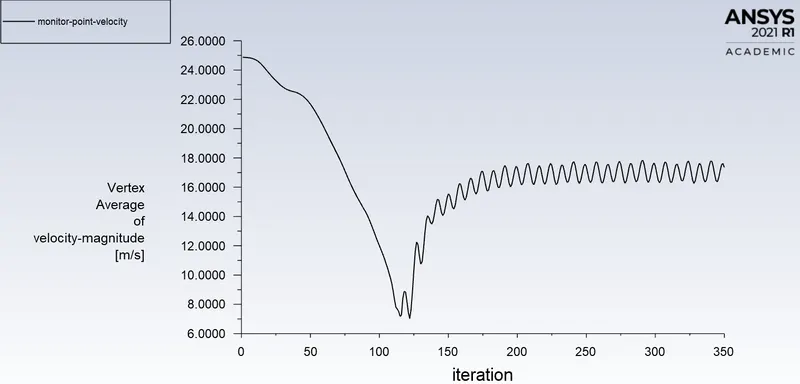
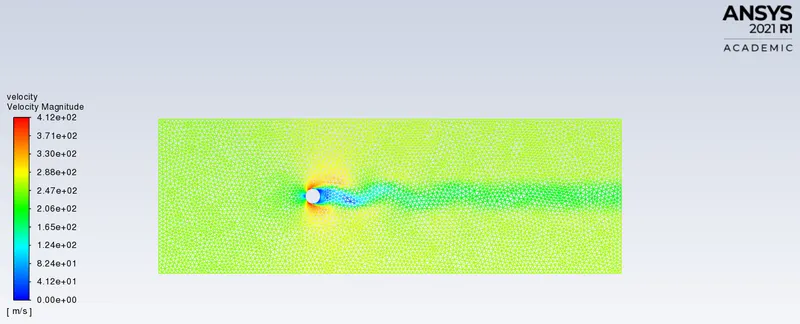
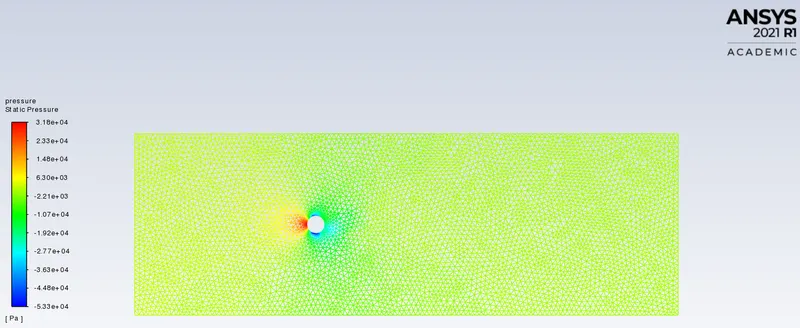
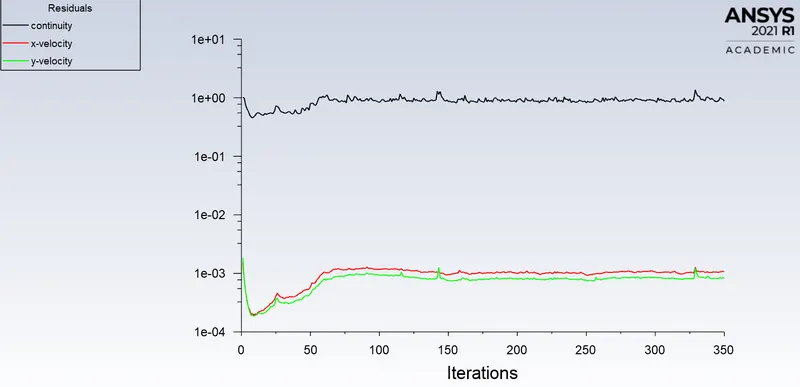
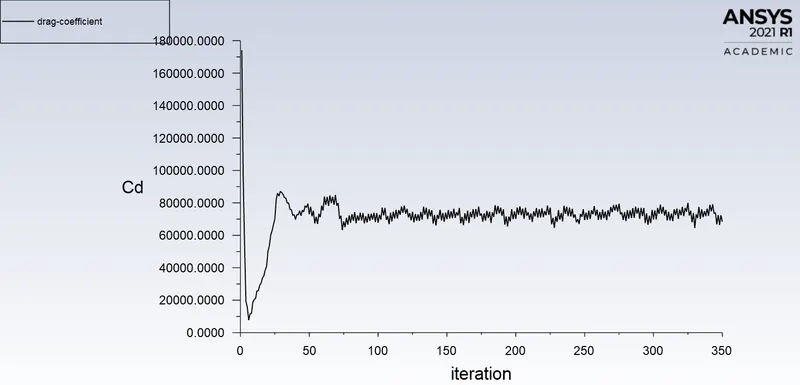
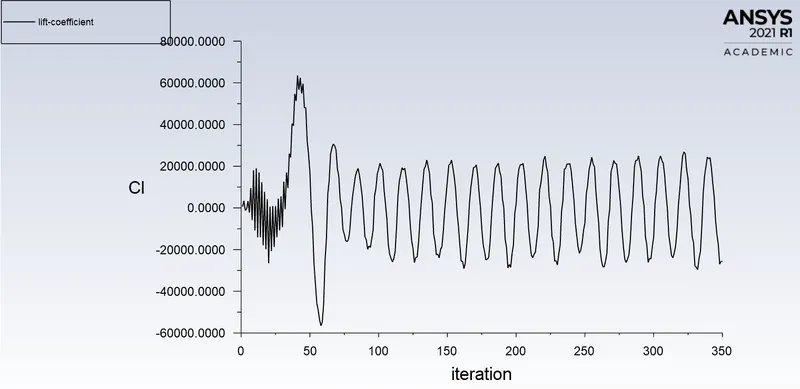
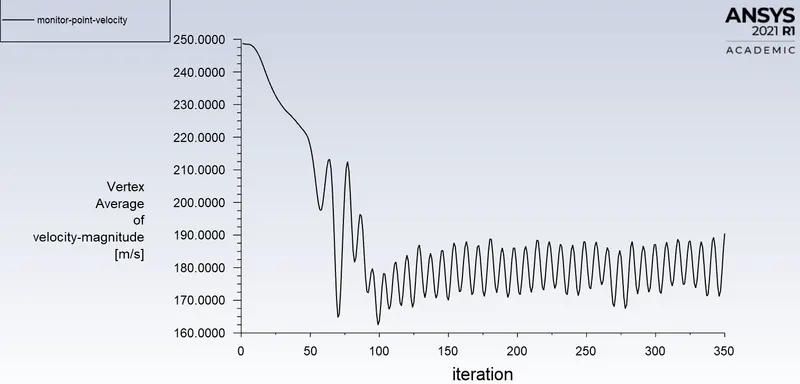
d. Simulating the flow with a steady-state solver for Re=10000 and inlet velocity=250 m/s.
- Velocity and Pressure Contour
- Residual plot
- Drag and Lift coefficient
- Velocity at the monitor point
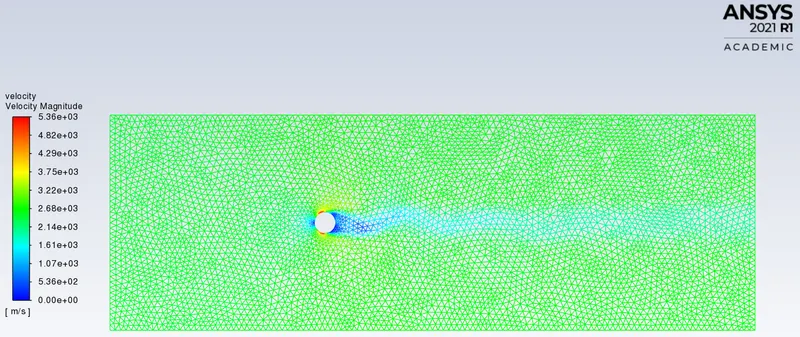
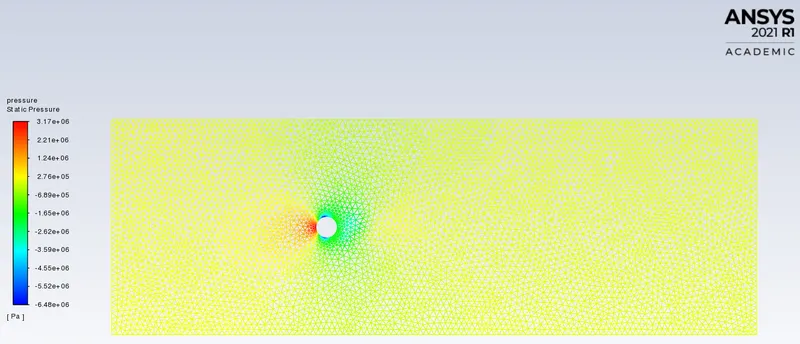
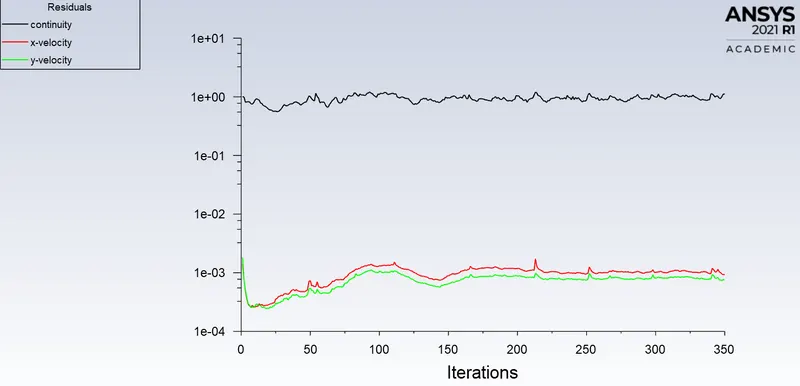
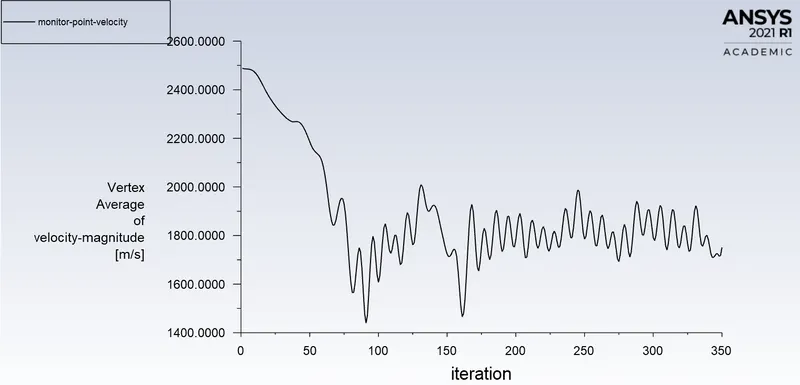
e. Simulating the flow with a steady-state solver for Re=100000 and inlet velocity=2500 m/s.
- Velocity and Pressure Contour
- Residual plot
- Velocity at the monitor point
Conclusion:
- In PART-I, the flow over a cylinder is simulated for both Steady-state and unsteady state with Re=100, and with results generated the phenomenon of Von Karman vortex street was observed.
- Necessary plots were plotted in order to observe that flow is converged and the vortex shedding is happening.
- In PART-II, five different simulations (i.e Re=10,100,1000,10000 & 100000) were simulated to observe the behaviour of drag and lift coefficients by keeping other variable constant.
- As we refine the mesh, we need to run more iteration in order to get results.
References:
- https://skill-lync.com/knowledgebase/how-to-create-an-animation-in-ansys-fluent
- https://skill-lync.com/knowledgebase/how-to-perform-a-fft-using-ansys-fluent
- https://skill-lync.com/knowledgebase/what-are-the-types-of-dimensionless-numbers