Week 2 Air standard Cycle
g_drive link: https://drive.google.com/drive/folders/1mwlGUaGJyMrs0zaj7CcsVDp8T3jkt2CQ
Aim
- write the code for otto cycle and ploting the pv diagram and output the thermal efficiency of the engine.
Introduction
- the cycle is defined as the series of operation or processes performed on a system, so that attain it original state. the cycle which air as working fluid is known as gas power cycle.
- in the gas power cycle ,air in the cyclinder may be subjected to series of operation which cause the air to attain it original postion.
- the sourse of heat supply and sink for heat supply and sink for heat rejection are assumed to be external to the air
- the cycle can be respresented P-V and T-S diagram
Otto cycle
- Now days ,the petrol and gas engine are operated on this cycle. the cycle consisits of flowwing four process
- 1.two reversible adiabatic or isentropic process
- 2.two constant volume processes
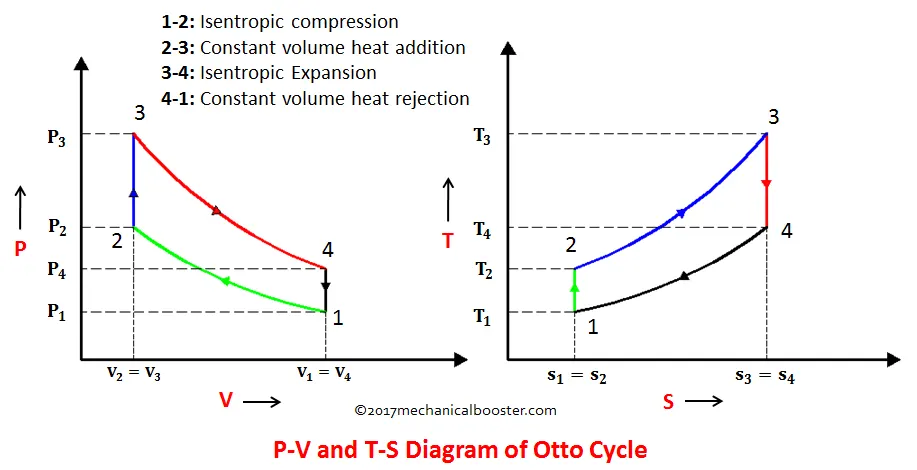
- The pv and ts diagram are as shown
-
Process 1-2: Isentropic Compression
This process involves the motion of piston from TDC to BDC. The air that is sucked into cylinder during suction stroke undergoes reversible adiabatic (isentropic) compression. Since the air is compressed, the pressure increases from P1 to P2, the volume decreases from V1 to V2, temperature rises from T1 to T2, and entropy remains constant.
-
Process 2-3: Constant Volume Heat Addition
This process is an isochoric process i.e. the heat is added to the air at constant volume. The piston in this process rest for a moment at TDC and during this time heat is added to the air through external source. Due to the heat addition, the pressure increases from P2 to P3, pressure, volume remains constant(i.e. V2=V3), temperature increases from T2 to T3 and entropy increases from S2 to S3.
-
Process 3-4: Isentropic Expansion
In this process, the isentropic (reversible adiabatic) expansion of air takes place. The piston moves from TDC to BDC. Power is obtained in this process which is used to do some work. Since this process involves expansion of air, so the pressure decreases from P3 to P4, volume increases from V3 to V4, temperature falls from T3 to T4 and entropy remains unchanged (i.e. S3=S4).
-
Constant Volume Heat Rejection
In this process, the piston rest for a moment at BDC and rejection of heat takes place at constant volume. The pressure decreases from P4 to P1, Volume remains constant (i.e. V4=V1), temperature falls from T4 to T1.
- Procedure for writting the code for otto cycle calculation
- importing the required library
- The library contains built-in modules that provide access to system functionality such as file I/O that would otherwise be inaccessible to Python
- the basic library are "math" which used to math function
- another required library is "matplotlib.pyplot as plt" which used to plot the graph
- Define the constants
- bore=0.1
stroke=0.1
con_rod=0.15
cr=8 - p1=101325 #pressure is pascal
t1=500 #temp is kelvin
gamma=1.4
t3=2300 #peak temp
- bore=0.1
- Calculation
- V_s = math.pi*(1/4)*pow(bore,2)*stroke
- V_c = V_s/(cr-1)
- v1=V_s+V_c
- p2=(p1*pow(v1,gamma))/pow(v2,gamma)
- output
-
#output request
plt.plot([v2,v3],[p2,p3])
plt.plot(V_compression,P_compression)
plt.plot(V_expansion,P_expansion)
plt.plot([v4,v1],[p4,p1])
plt.xlabel('volume')
plt.ylabel('pressure')plt.show()
-
- importing the required library
- Python program of otto cycle
-
# write the code for otto cycle and ploting the pv diagram and output the thermal efficiency of the engine.

import math # for math calculation
import matplotlib.pyplot as plt #for graph plot purpose

bore=0.1
stroke=0.1
con_rod=0.15
cr=8
def engine_kinematics(bore,stroke,con_rod,cr,start_crank,end_crank):

	#geometry parameters
	a=stroke/2
	R=con_rod/a

	V_s = math.pi*(1/4)*pow(bore,2)*stroke
	V_c = V_s/(cr-1)

	sc =math.radians(start_crank)
	ec =math.radians(end_crank)

	num_values=60
	dtheta=(ec-sc)/(num_values-1)
	v = []
	for i in range(0,num_values):
		theta= sc + i*dtheta
		term1 =0.5*(cr-1)
		term2 = R +1 - math.cos(theta)
		term3 = pow(R,2)-pow(math.sin(theta),2)
		term3 = pow (term3,0.5)
		v.append((1+term1*(term2-term3))*V_c)
	return (v)
#basic inputs data
p1=101325 #pressure is pascal
t1=500 #temp is kelvin
gamma=1.4
t3=2300 #peak temp

#state point 1
V_s = math.pi*(1/4)*pow(bore,2)*stroke
V_c = V_s/(cr-1)
v1=V_s+V_c

#state point 2
v2 =V_c

p2=(p1*pow(v1,gamma))/pow(v2,gamma)
rhs=p1*v1/t1
t2=p2*v2/rhs
V_compression = engine_kinematics(bore,stroke,con_rod,cr,180,0)

constant=p1*pow(v1,gamma)
P_compression=[]

for v in V_compression:
	P_compression.append(constant/(pow(v,gamma)))

#state pint 3
v3 = v2

rhs=p2*v2/t2
p3=rhs*t3/v3
V_expansion =engine_kinematics(bore,stroke,con_rod,cr,0,180)

constant=p3*pow(v3,gamma)
P_expansion=[]

for v in V_expansion:
	P_expansion.append(constant/(pow(v,gamma)))


#state point 4
v4= v1
p4=(p3*pow(v3,gamma))/pow(v4,gamma)
t4=p4*v4/rhs

#thermal efficiency
n=1-((t4-t1)/(t3-t2))
print (n)
#output request
plt.plot([v2,v3],[p2,p3])
plt.plot(V_compression,P_compression)
plt.plot(V_expansion,P_expansion)
plt.plot([v4,v1],[p4,p1])
plt.xlabel('volume')
plt.ylabel('pressure')

plt.show()
-
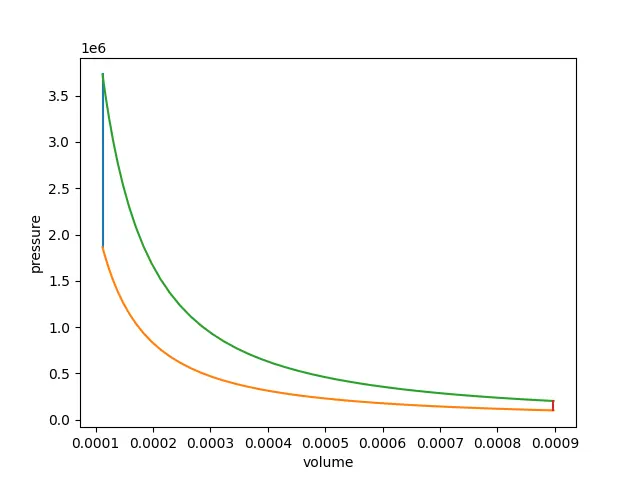
- Result
- Azhartahir7773I have used G.I.S. insulation and fabrication services and personally my experience was really good and i am quite satisfied with the service. <a href="https://www.gisinsulation.com/what-we-offer">Fiber glass insulation</a>