Week - 10 Hyperelastic Material Models
G-DRIVE LINK: https://drive.google.com/drive/u/0/folders/1S18pT4BTUAOJ-_CcfmpdcvvKG5dY2Guq
AIM:
- The mat77h hyperelastic material rubber taken as a specimen material.calculate the Mooney Rivlin and Ogden material constants and compare the both using stress-strain data from a Dogbone specimen tensile test.
CASE SETUP CARDS:
- BOUNDARY CONDITION
- CONTROL CARDS
- DATABASE
- CURVE
- MATERIAL
- SECTION
- SET
BOUNDARY CONDITION
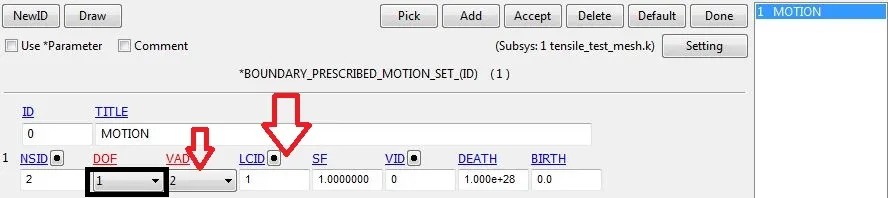
- In this test we using the two boundary condition one is motion set with the displacement type
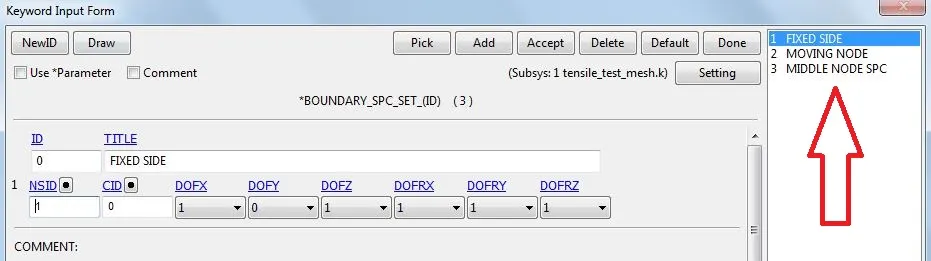
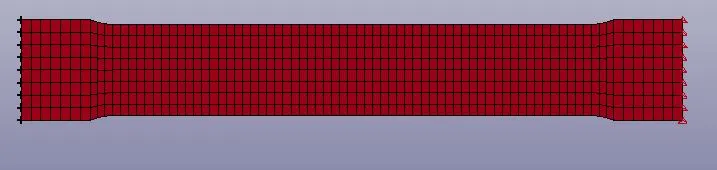
- During the tensile test of specimen the pulling along the x-direction due to the tensile in x direction the y direction element the compression occur so,we use the middle element DOF is y lock
CONTROL CARDS
-
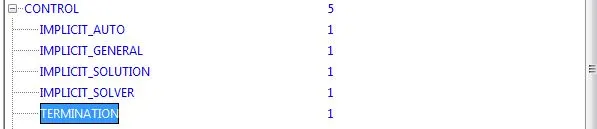
*CONTROL_IMPLICIT_AUTO
Define parameters for automatic time step control during implicit analysis
*CONTROL_IMPLICIT_GENERAL
Activate implicit analysis and define associated control parameters. This keyword is required for all implicit analyses.
*CONTROL_IMPLICIT_SOLUTION
These optional cards apply to implicit calculations. Use these cards to specify whether a linear or nonlinear solution is desired
*CONTROL_IMPLICIT_SOLVER
These optional cards apply to implicit calculations. The linear equation solver performs the CPU-intensive stiffness matrix inversion
DATABASE

- The dt time is 0.1 ms the ascii use for get effective stress and effective strain
CURVE
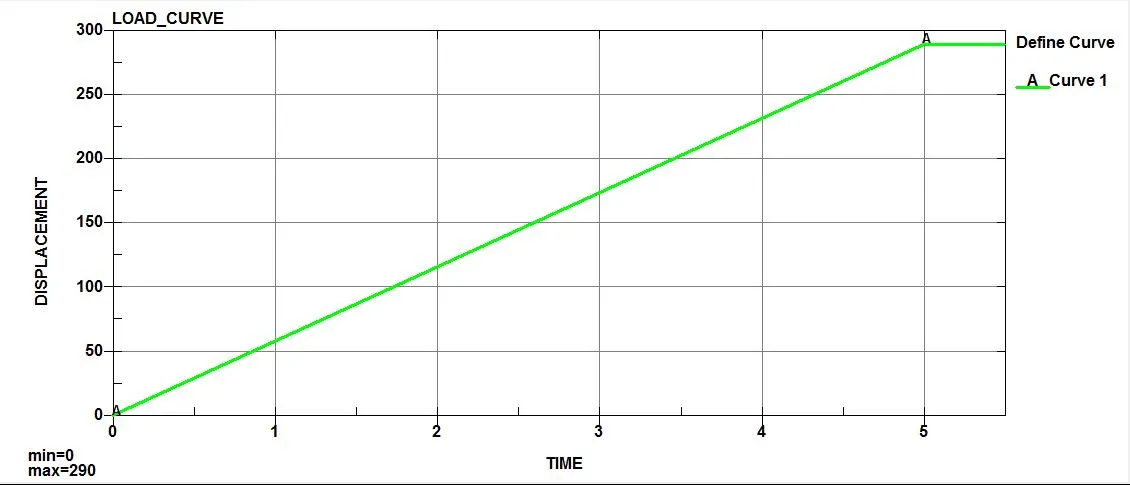
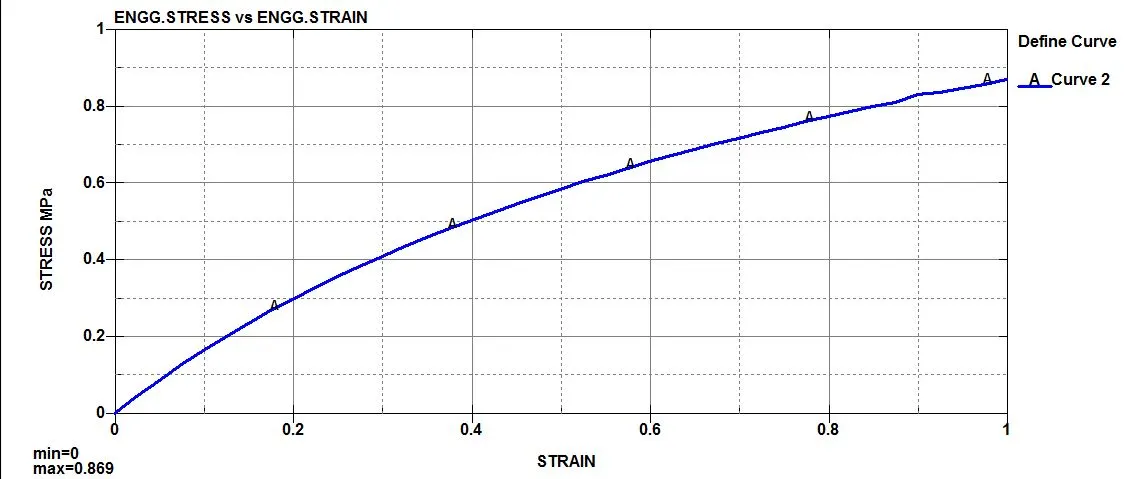
- Define the curve is very importent based on the curve only the slover load acting and plastic strain and stress is calculated
MATERIAL
- As per given challange we using the mat77 such as hyper elastic rubber material

- For this challange we use the g,mm,ms,mpa unit system.the N1,N2,N3 various constant obtained
SECTION

CONSTANTS

- This the constants are received from the material and from the D3hsp file we received the extension data and true strain value that value are need to change to the engineering strain and eng.stress
- ENGG.strain=1-extansion data
- ENGG.stress=true stress/(1+engg.strain)
ENGG.STRAIN vs ENGG.STRESS N1,N2,N3 with out constants
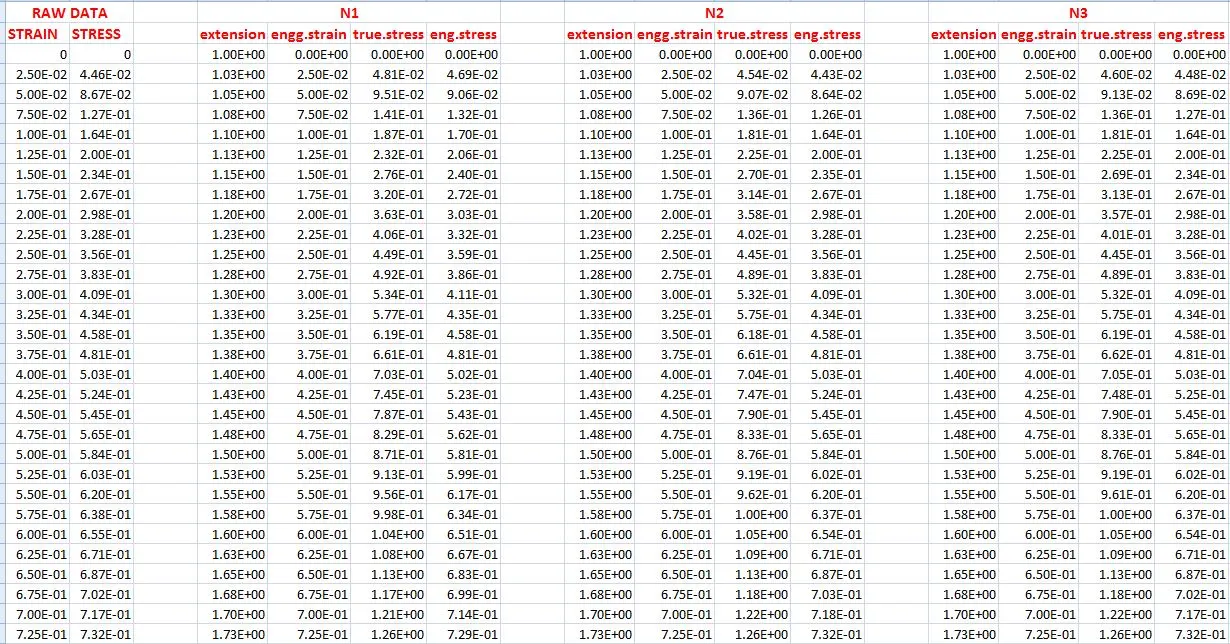
- the above extension data is converted to engg.strain-n1
- engg.strain=1.03e-1=>2.5e-2
- ENGG.stress=4.81e-2/(1+2.5e-2)=>4.69e-2
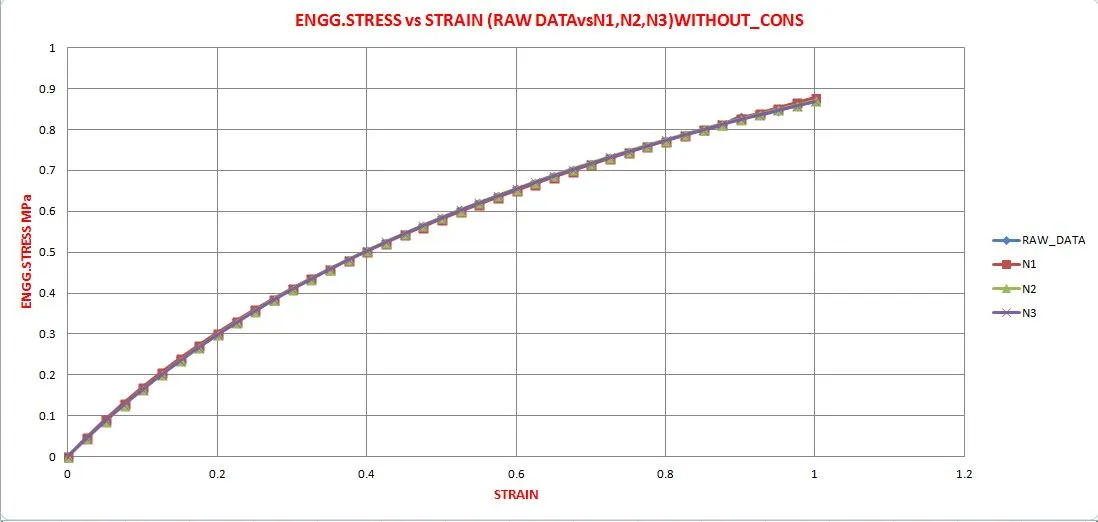
- As seen the graph the raw data is percefectly match from fit data from d3hsp data sheet
WITH CONS N1,N2&N3 APPLYING
- After geting the constants apply the constants and run the simulation with the implicit manner and check the convergence of equlibrium
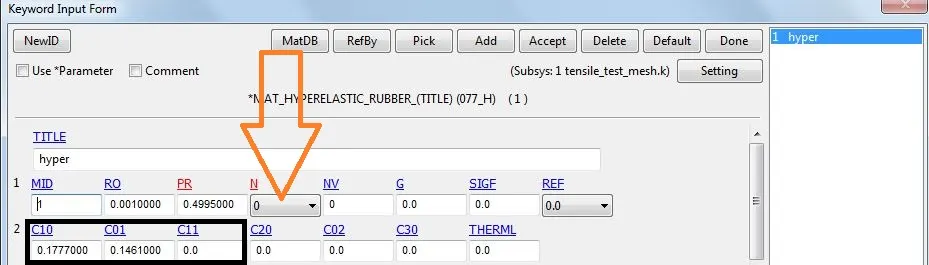
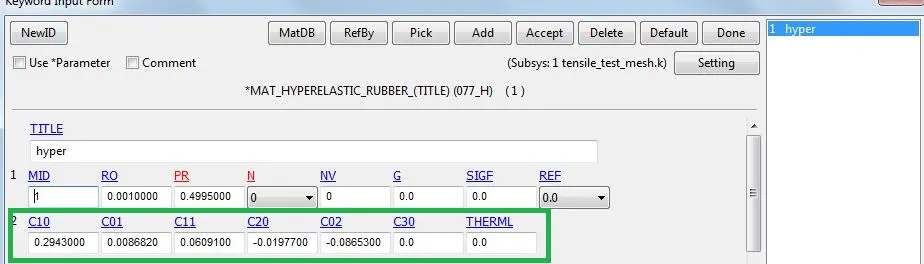
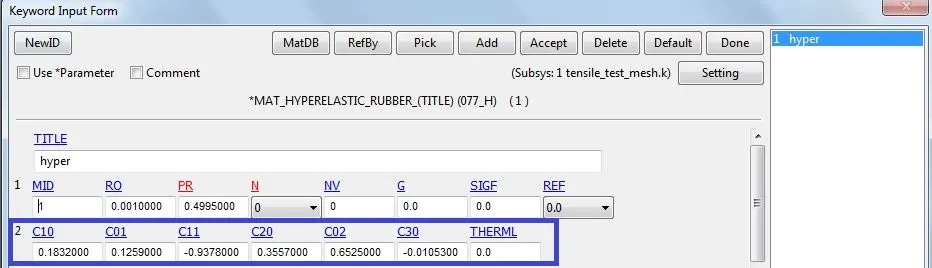
- After runing the simulation we geting the data is true stress,true strain these data need to convert the engg.stress,engg.strain for that wkt
- true strain=ln(1+engg.strain)
- engg.strain=(e^true strain)-1
- engg.stress=truestress/1+engg.strain
DATA SHEET AFTER APPLYING CONS
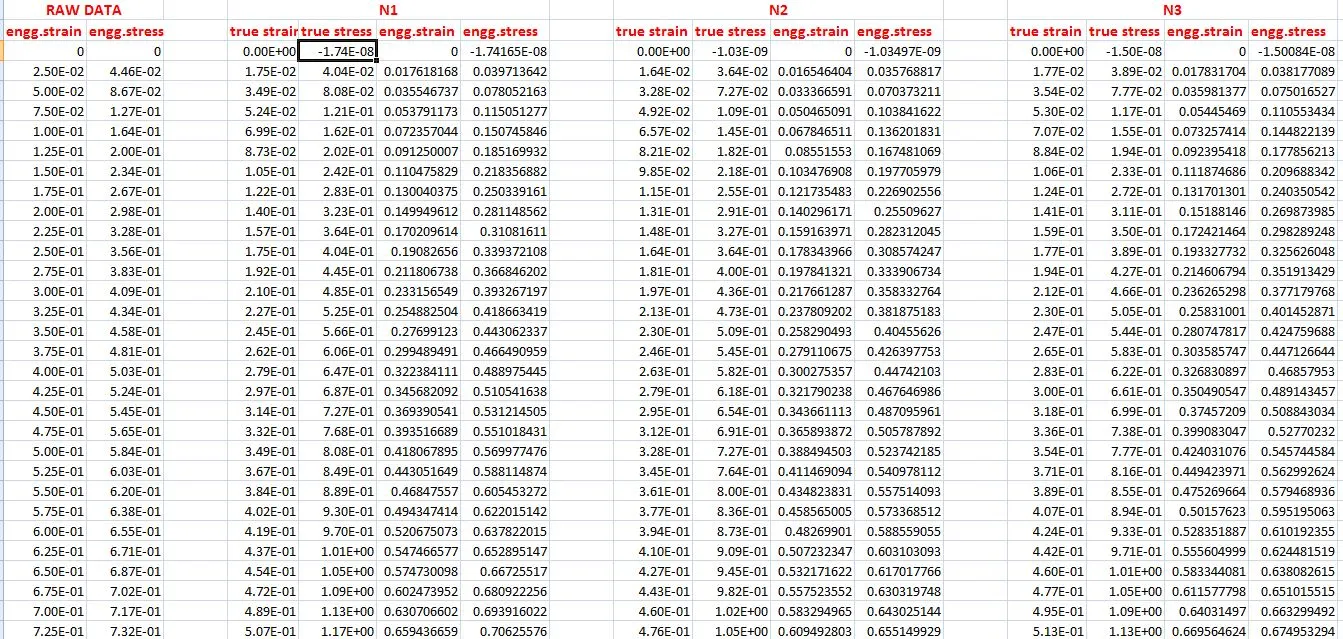
- engg.strain=(2.718^1.75e-2)-1=>0.0176
- engg.stress=4.04e-2/(1+0.0176)=0.03971
- for n1 cons
STRAIN PERCENTAGE FINDING N1
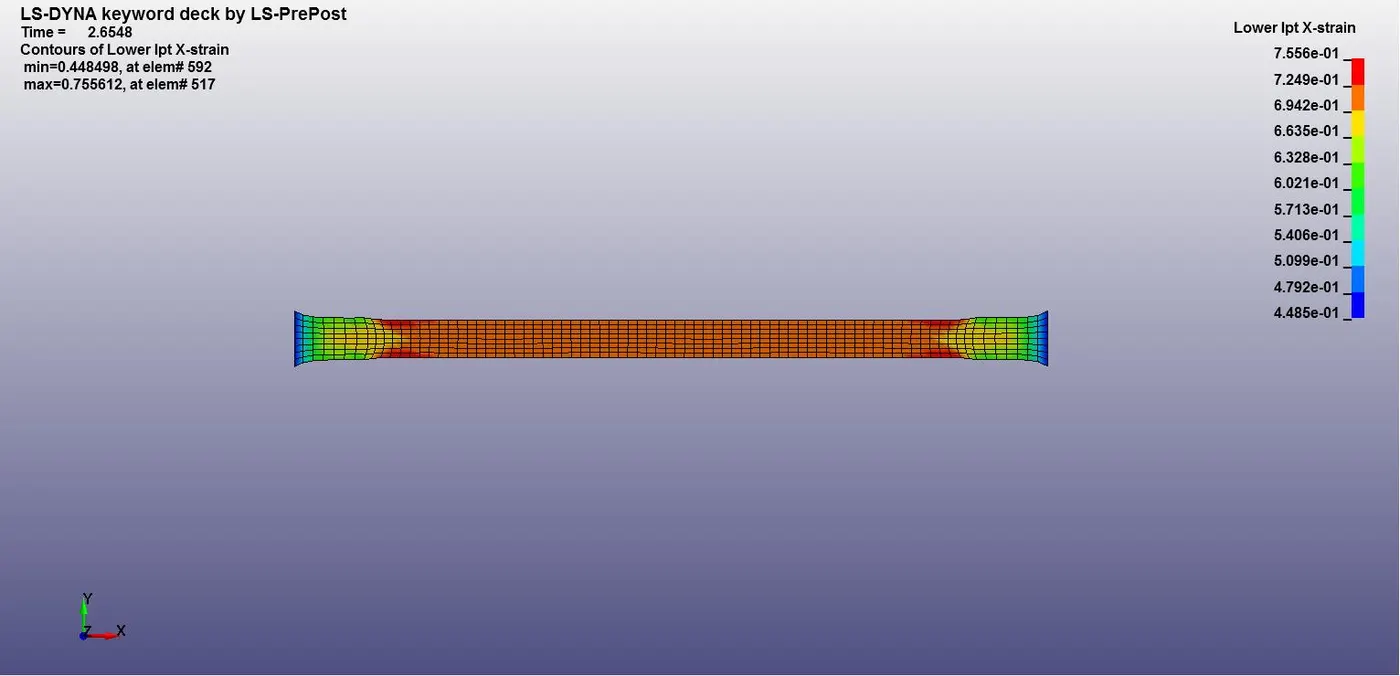
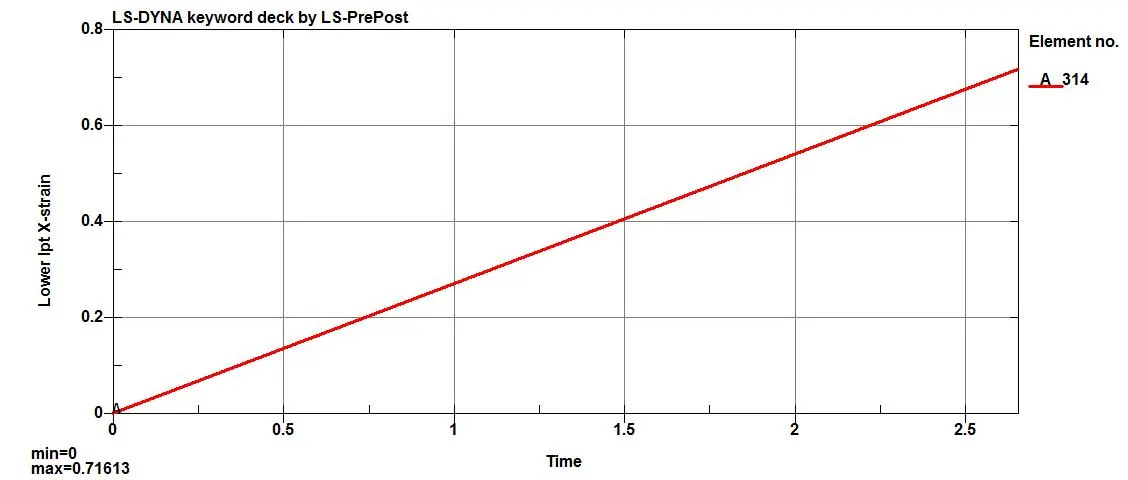
- The graph shows strain of 314 elemnts the max strain 0.71613 is an true strain it will be need to convert engg.strain then only we compare the data from the raw engg.strain
- engg.strain=(2.718^0.71616)-1=>1.046
- that mean 100% strain is obtained
STRAIN PERCENTAGE FINDING N2
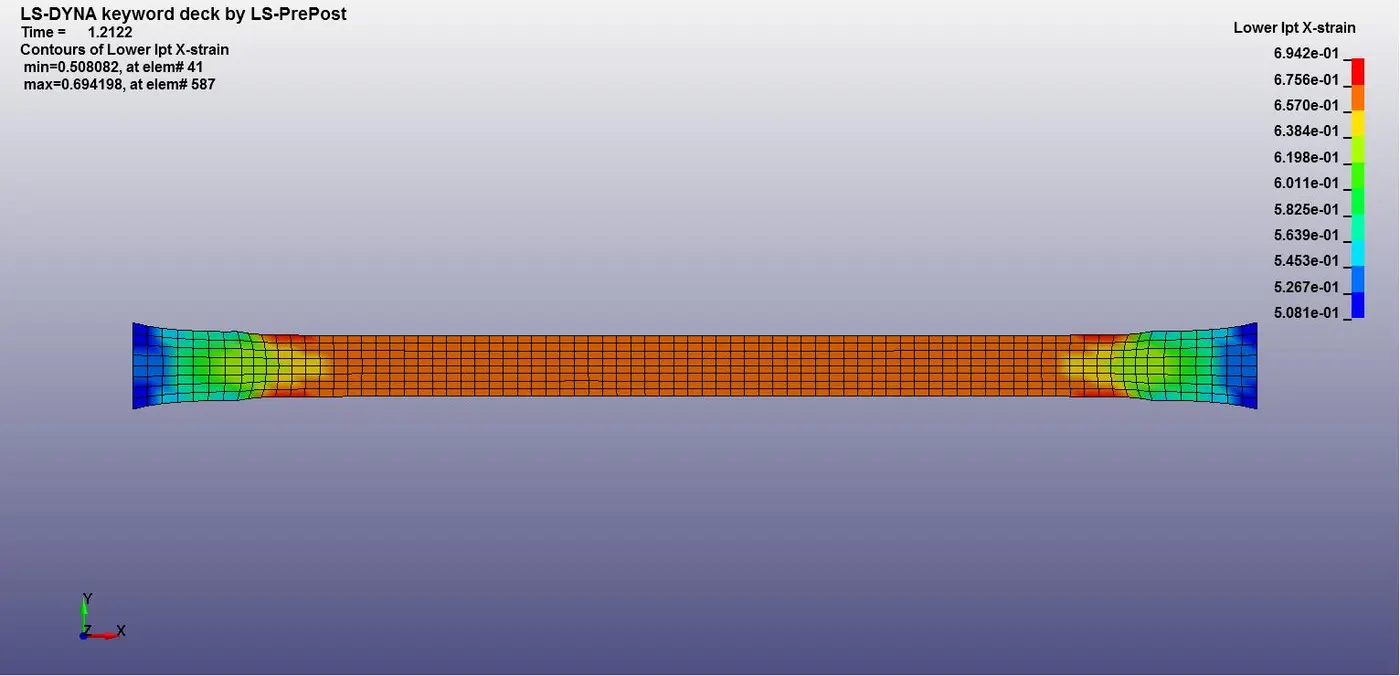
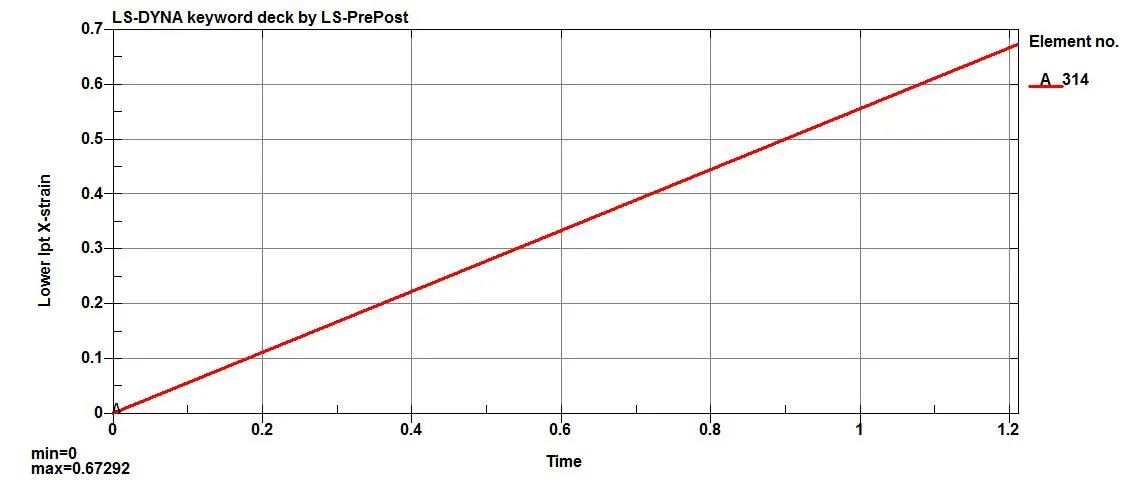
- The graph shows strain of 314 elemnts the max strain 0.71613 is an true strain it will be need to convert engg.strain then only we compare the data from the raw engg.strain
- engg.strain=(2.718^0.67292)-1=>.9599
- that mean 95.99% strain is obtained
STRAIN PERCENTAGE FINDING N3
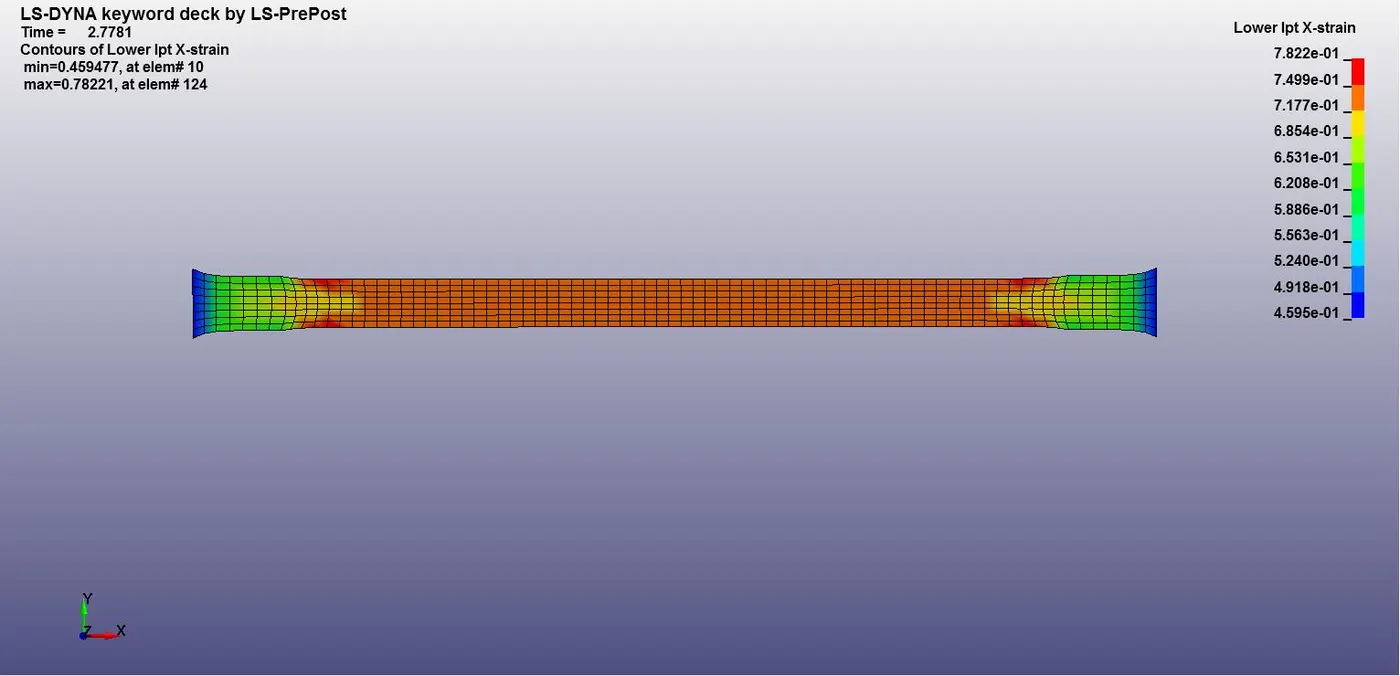
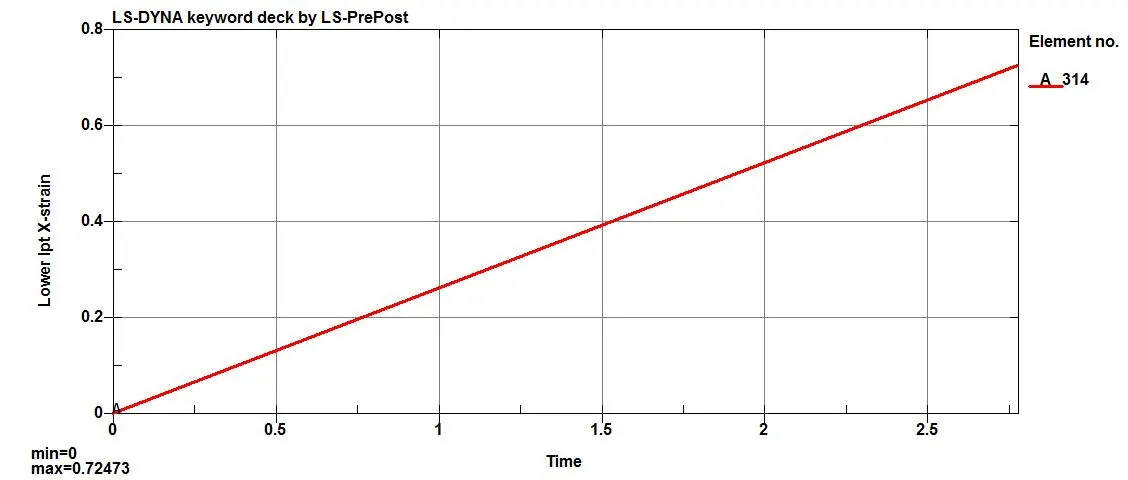
- The graph shows strain of 314 elemnts the max strain 0.71613 is an true strain it will be need to convert engg.strain then only we compare the data from the raw engg.strain
- engg.strain=(2.718^0.72473)-1=>1.064
- that mean 106.41% strain is obtained
The starin percentage based on the load curve and dispalcement if you given higher termination time the slover will not to the convergence so, the error occur.in my case my termination time is 5ms but due to instablity of the slover the 2.8ms the equlibrium occur to over come this issue use control stablity cards.
FINAL DATA WITH CONS
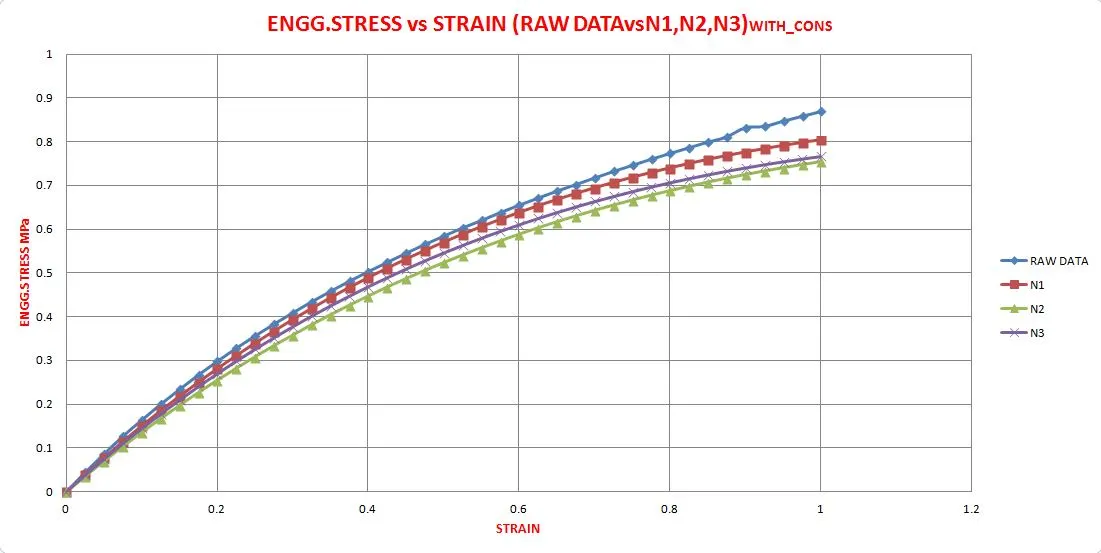
- As seen the above graph the engg.stress is not perfectly match with the raw data it may be two factor one is possion ratio or the convergence of equlibrium insted of giving the 0.4995 possion ratio give 0.5 may be match the curve with the orginal data
Conculsion
- from this assignment we learn the how to modelling the non-liner hyhper elastic material
- we learn the how covert the true strain from engg.strain
- we learn the what is importents of constants for hyper elastic material