Week-11 Challenge: Braking
Q1.For a defined driving cycle, calculate the energy required for braking
ans;-drive cycle it is nothing but an the vehicle speed vs time curve
eg drive cycle:-urban dynamometer driving cycle.
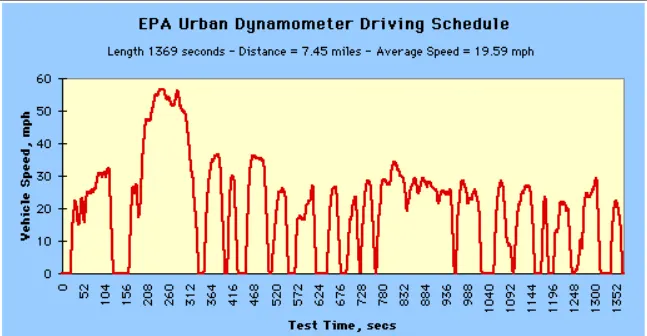
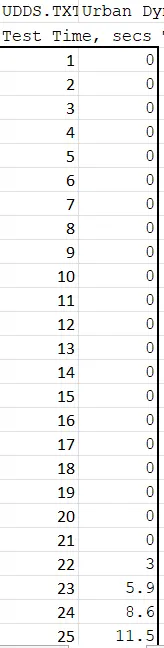
so as per the above excel sheet will be above is driving cycle schedule it is an the driving cycle
parameters:-
M=Mass :1000kg
vf=final velocoty minimum velocity at which obtained at an the breaks are applied
Vi=initial velocity maximum velocity obtain without breaking
formula:-
breaking energy=[1/2] x mass in kg x (final velocity - initial velocity)
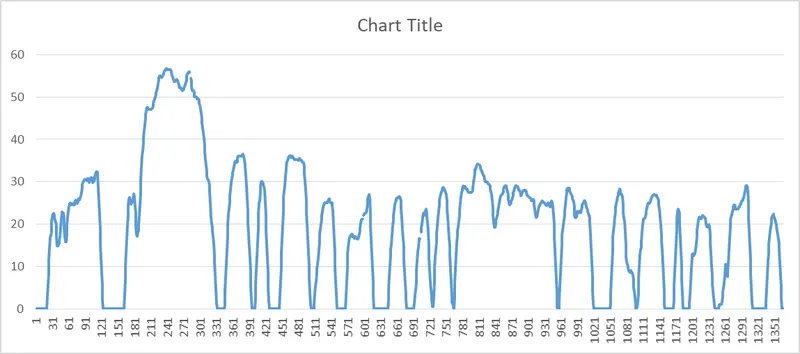
so the graph as per the calculation as there is the acceleration energy as well as an the breaking energy so the calculations of an the breaking energy as ann the belows
so all the calculations are in excel sheets

so as from the excel sheet we have an calculations as the
case 1.speed from the 22.1 to 21.5 so there is an the initial braking
so to cnverts it from mph to mps so multily it by 0.0002777
E= (1/2) x mass x (vf - vi)^2
E=0.5*1000*(0.00016662-0.00013885)^2
E=0.0000038811
as further all are the calculations in excel sheets.
Q2.Why electric motor can’t develop braking torque at high speed similar to starting? How electric and mechanical brakes are coordinated?
Ans:-electrical motor characterstics as all we know that is speed - torque characterstics as the speed increses an the torque decreases here are generally three types of electrical braking for motors: regenerative braking, dynamic braking, and plugging. Of the three methods, plugging provides the fastest stop, but it can be harsh on both the electrical and mechanical components.
but as we compare with the electrical motgor acceleration within the electrical motor braking there are the some important things thats belows:-
- electrical motor cant devloped an the braking torque same as an acceleration torque
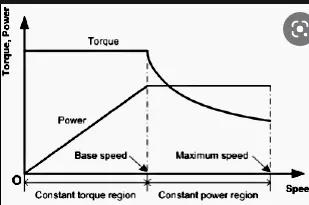
as are the speed-torque characterstics of motor is shown belows here will be shown an the motor to reaches at an the criticalk speed it has an the constant torque and once it reaches to its critical speed downslop as an the it goes to constant power region its shown an the acceleration and deacceleration speed +ve and -ve speed as 0-100kmph in 10 sec is acceleration speed of vehicle as anm the low speed and high torque and high speed low torque
as the upper curve is nothing but an the acceleration and other will be an the braking or deacceleration torque or curve so as by comparing with an both if we consider as the motor devloped as an the 7NM torque at motoring so it devloped actually the -7 torque during an the braking because we are opeqrationg at an the field weakning regionthus an the peak acceleration torqwue will be more than of the peak deaccceleration torque thus at an starting the acceleration torque at start is high as compare to the braking or deacceleration
Electrical braking stratargies
1.series:-as the mechanical and electrical breaks applied one after one either regeneratiove or the mecghanical breakings
2.parallel:-as the two breaks are applied at same time
eg:-nissan lead as EDIB(Electrical driven intelligant breaking)
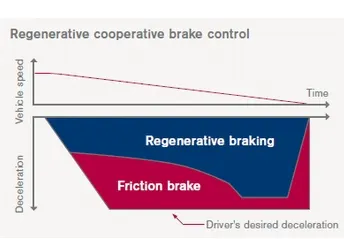
So as an froim the diagram during an the high torque we cant used electrical or an the regenerative breaks so at an the high speed we are used the regenerative breaks at an the high speed and low torque and at an the low speed we are used an the mechanical as the breaks
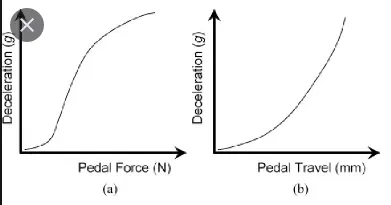
after stepping an the break padal the system produces an the natuiral and adequate breaking force that corresponds to the operation as an ammount of the energy regeneration also need to be increses much as an the possible by an the parallel as the (electrical driven intelligant breaking)
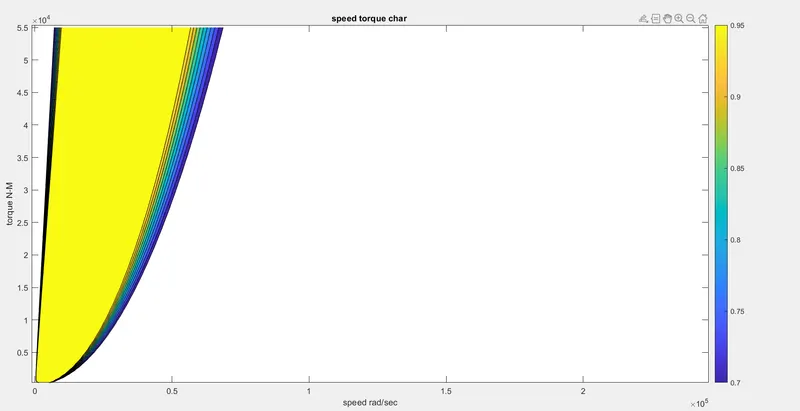
Q3.Make a MATLAB program which plots contour of given motor speed, torque and efficiency values. Attach the code as a .m file attach a screenshot of all the plots.
Contour it is nothing but an the representation of 3 quantities at aan time
clear all
close all
clc
W=linspace(1,247000);
T=linspace(1,55000);
%losses
Kc = 0.18;
Ki = 0.006;
Kw = 0.000015;
%meshgrid
[x,y]= meshgrid(W,T);
copper_loss = (y.^2)*Kc;
iron_loss = x*Ki;
windage_loss = (x.^3)*Kw
K = 20;
output_power = x.*y;
input_power = (copper_loss)+(iron_loss)+(windage_loss)+(K);
Eff = (output_power)./(input_power );
n=linspace(0.7,0.95,10);

box off;
grid off;
contourf(x,y,Eff,n);
colorbar
title('speed torque char ');
xlabel('speed rad/sec')
ylabel('torque N-M')

figure
surf(X,Y,Eff);
colorbar
xlabel('speed rad/sec'):
ylabel('torque N-M'):
zlabel('efficiency'):
title('efficiency value for various operating of motor');
plot or output be like as :