Simulation of BMS - Battery Management System
Fault in MATLAB BMS_Closeloop Model
The Model represents a rough idea on how the BMS reacts and gives user an idea of any fault occuring in the Battery Pack, if any.
The model here allows the user to know the error by glowing the RED Light on the dashboard.
The various defects that can occur are
- Fault State
- over current
- High temperature
- low temperature
- over volatge
- under voltage
- charger
- inverter
- Volt Sensor
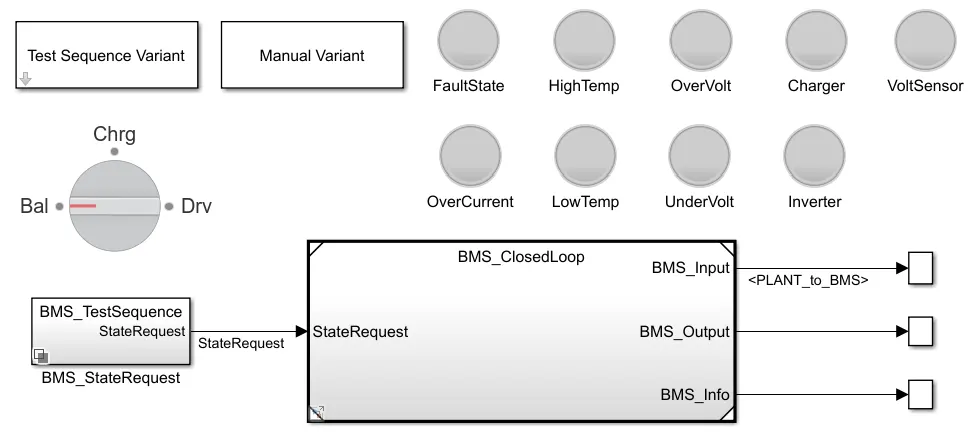
The Specifications of BMS Are highly accurate with each block given their specific function and all the blocks are inter-related with each other for better performance.
The entire model has a large number of component level and system level analysis.
A 6 cell Module is selceted as our Battery Pack for the system with each cell having 4V as their Standard cell Voltage.
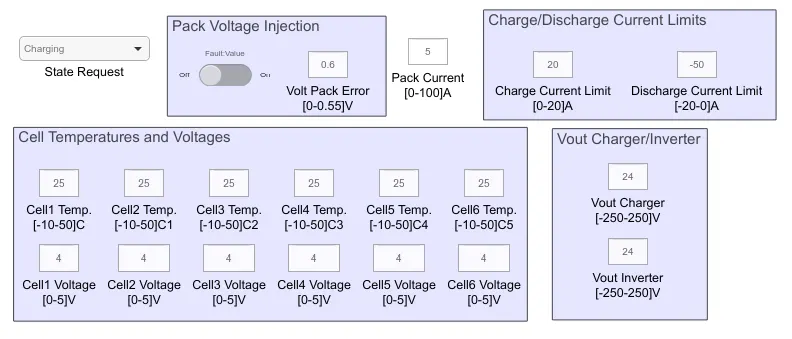
The BMS_ClosedLoop consist of interlinking of the BMS and the Plant(Battery Pack)
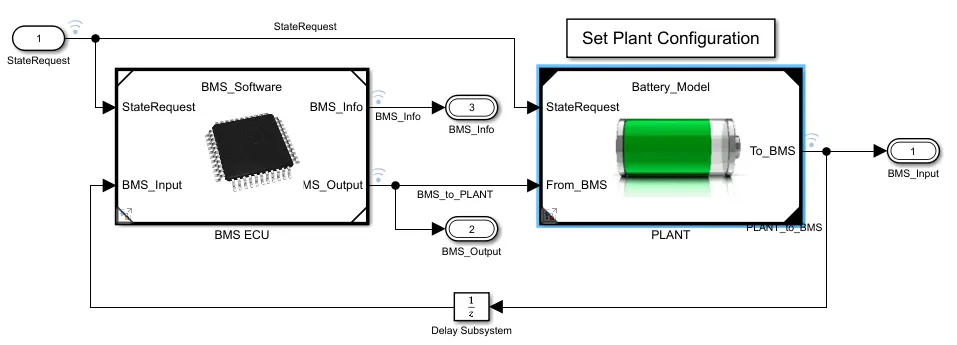
The BMS ECU is the heart of the system which controls all the program, control alogrithims and logics too.
the plant has system block which needs to be controlled.
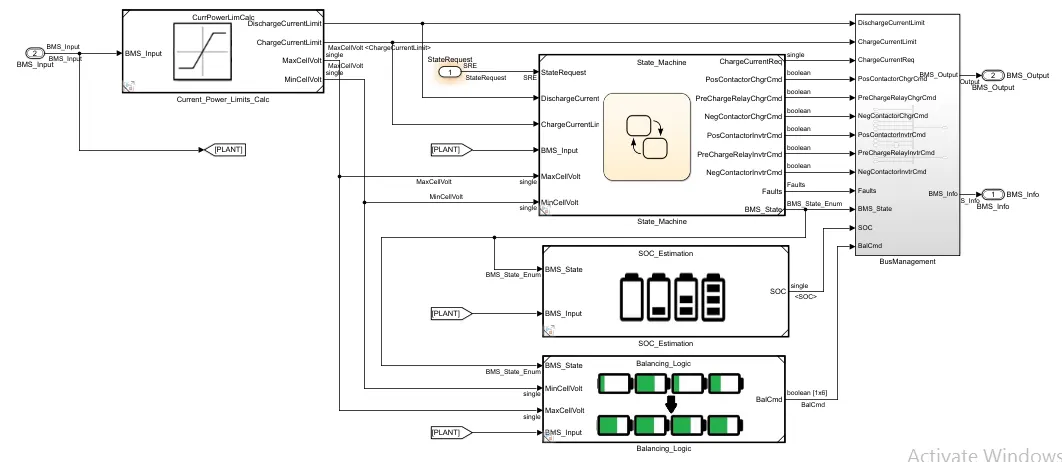
This is the entire system level design inside the BMS ECU. it has the following block : State_machine; SOC_estimation; balancing_logic block.
The State_machine is responsible for implementing 3 logics namely :
- Driving Charateristics: tells us the response to the different driving conditions
- Charging : Response to the EV while Charging
- Balancing : Response to the fault options
The SOC-Estimation is also a key important block in the BMS_ECU, which helps to tell the estimate of the battey charging condition; wheather cells are charging properly or not etc.
The Balancing_Logic is repsonible for the management of the battery pack while charging so that there is occurance of weak cell into the system. introducing weak cell in the pack compromises with the SOC and SOH.
The Test Sequence Varient has in build 3 models.
- It has 3 stages of driving condition, namely
- Driving
- Charging & Balancing
- Standby
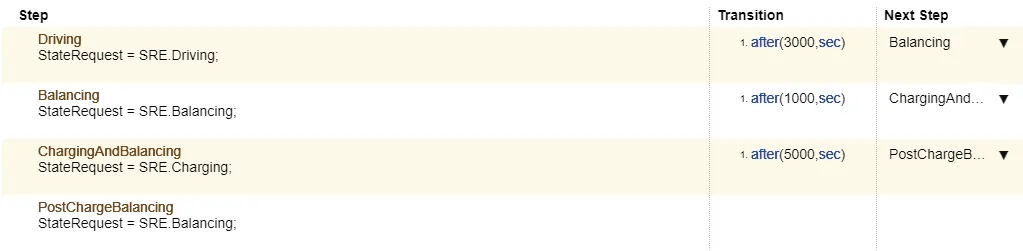
when this input is provided to the BMS model, the Scope result and the dashboard refelects the following result:
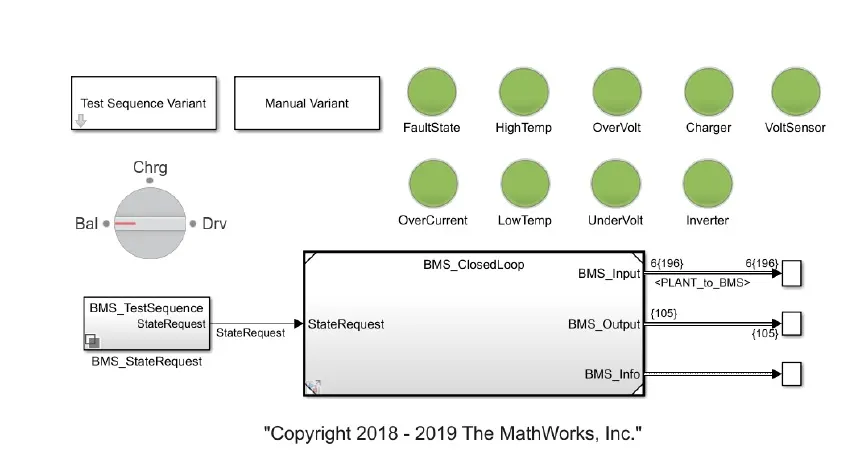
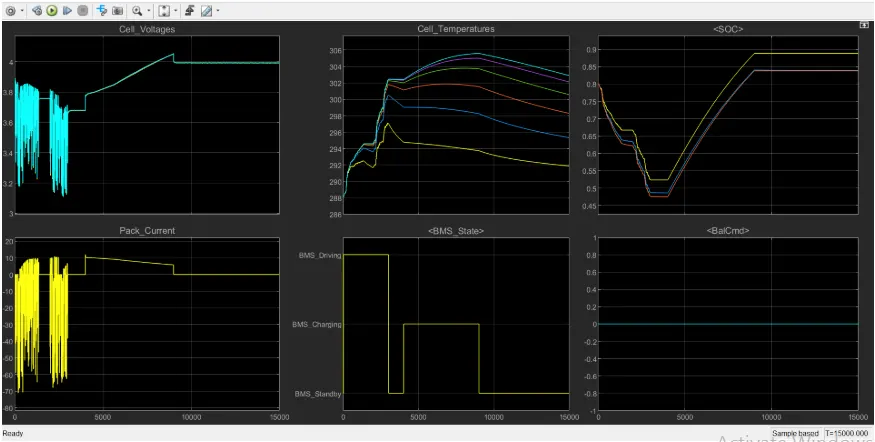
The result shows that, there is no fault in the input provided. All GREEN Light on the dashboard.
RESULT:
- The input cycle can be seen in the 5th graph in which vehicle initially undergoes driving, then charging till SOC= 90% and then later in standby state.
- During Charging The Battery pack voltage is increased upto 4V.
- The cell temperature increases during driving and charging cycle.
- The SOC drops to less than 50% after the driving cycle and then later put into charging untill SOC Reaches 90%.
- The Current supplied to the EV during driving phase can be seen in the current graph.
Test Sequence Varient 2
2. It has 2 Phases for the battery pack
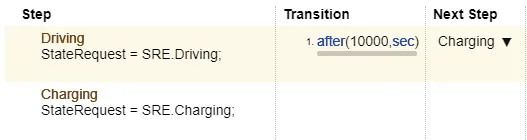
when this input is provided to the BMS model, the Scope result and the dashboard refelects the following result:
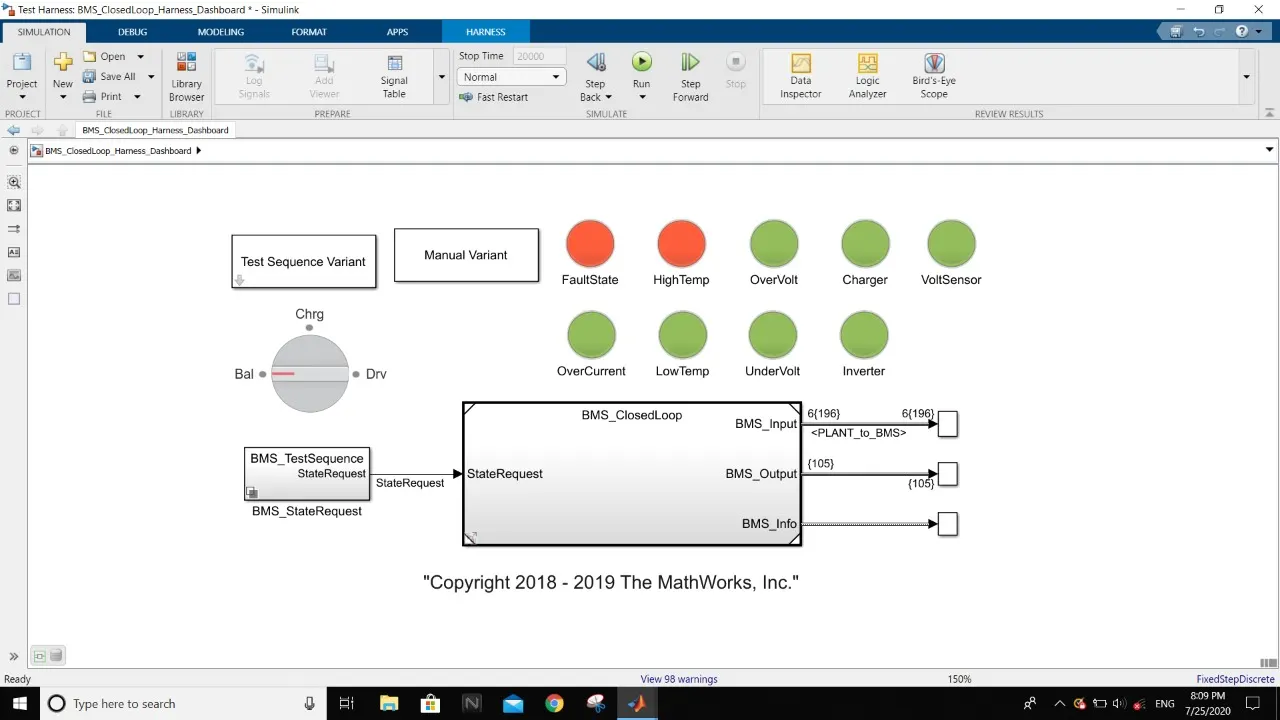
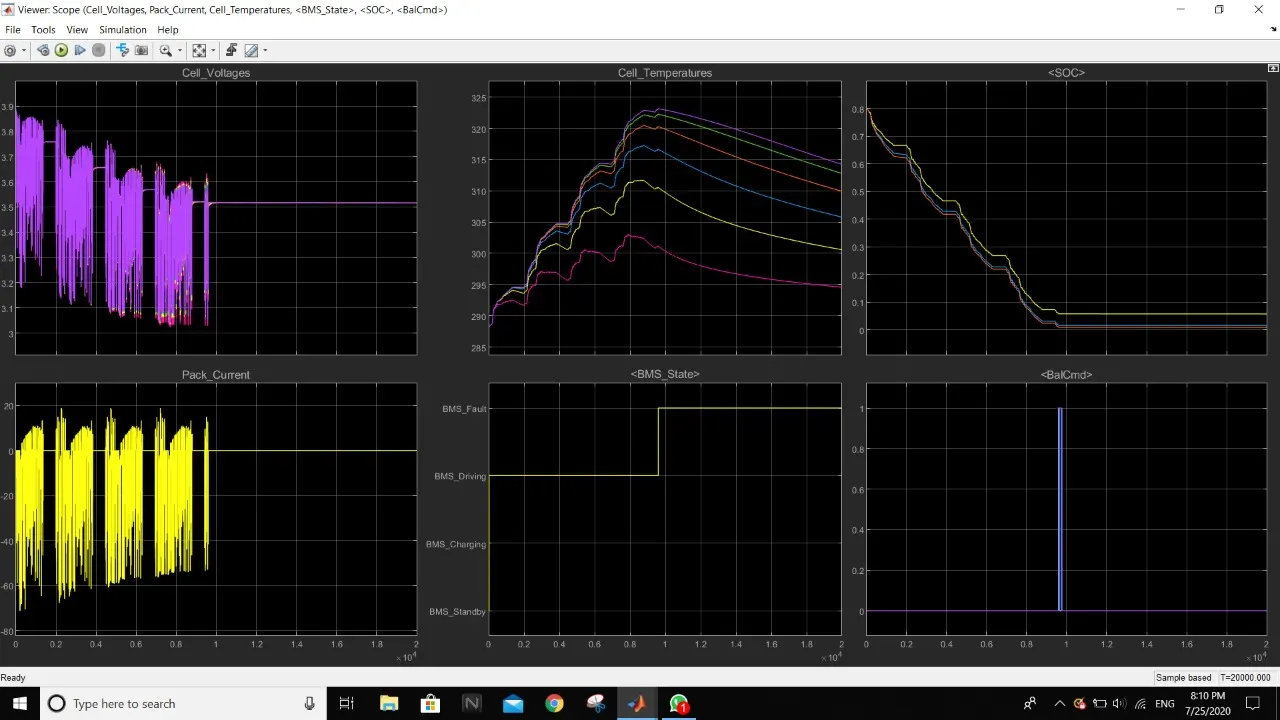
The Result shows that there is a fault condition in the vehicle. The dashboard on the model dipicts the same with a red colour indication.
After 10,000 sec when the driving cycle is over, during charging and balancing phase the fault condition occurs.
RESULT
- During the initial phase i.e. the driving mode,the volatge at start of driving was around 4V, after which the voltage steadly drops and reaches around 3.5 V at 10,000 sec. At the same time, the BMS_ Stage is changed to fault condition. The SOC has also dropped down to 0% after the driving mode.
- The fault that occured in the system is the due to HIGH TEMERATURE. The dashboard on the model dipicts the same with a red colour indication.
- This fault might have occured due to improper using of battery pack to drive the EV or due to over useage of the battery pack for 10,000 sec which is more than 2.5 hr of continuous use.
Test Sequence Varient 3

The input states that only charging is provided to the battery module. the Result for the input are:
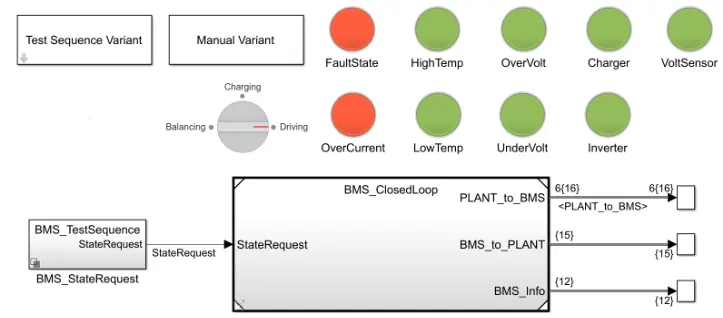
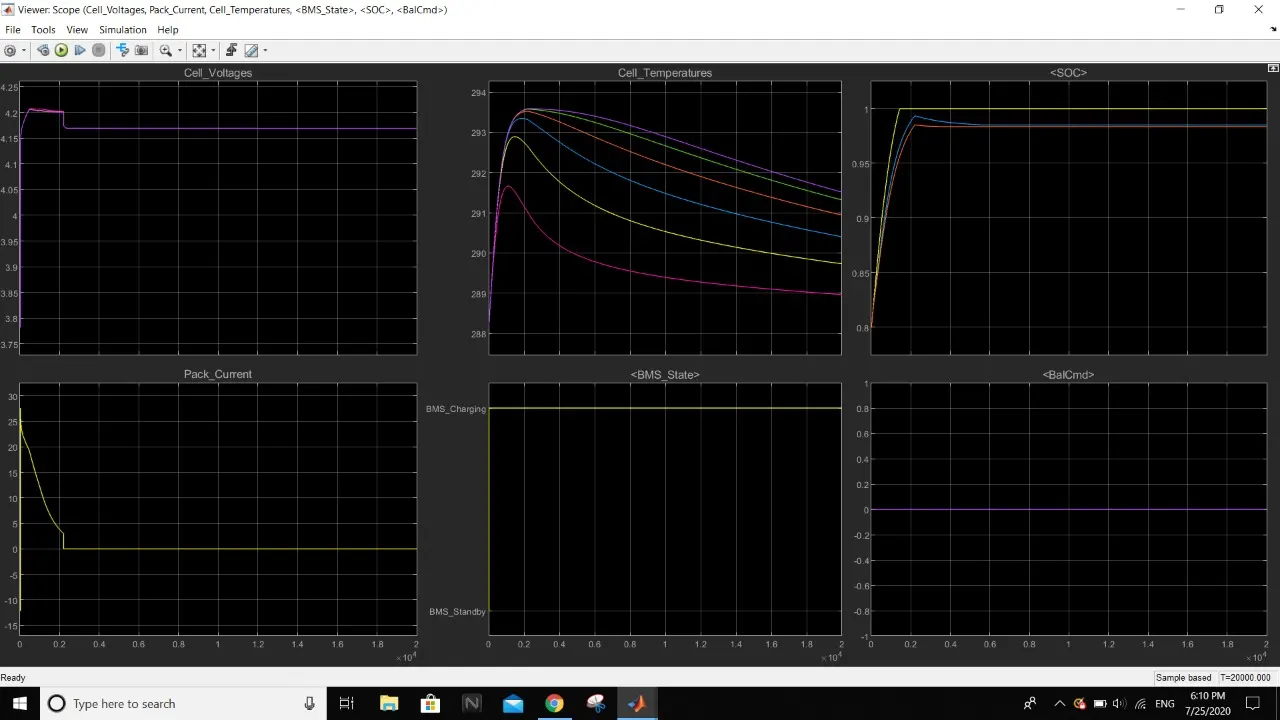
The dashboard shows that a defect/ fault was detected by BMS. Overcurrent occured in thr battery pack while charging the module.
RESULT
- The scope results shows that, the voltage increased upto a value of 4.2 V and then after the fault, it gain a steady state of around 4.15V.
- The SOC graph shows that within 1500 sec the SOC reached from 80% to 100% charging.
- After the defect the the current graph shows that the current eventually droped down to zero for the rest of the time period.
- From the voltage and current graph it can also be seen that as the battery pack was already 80% charged, the rest charging occured at constant volatge condition.
This BMS Module has helped to determine the working of the BMS on various diffrent driving phases. How the fault have occured and how BMS has looked after it and gave the required response at the dashboard.