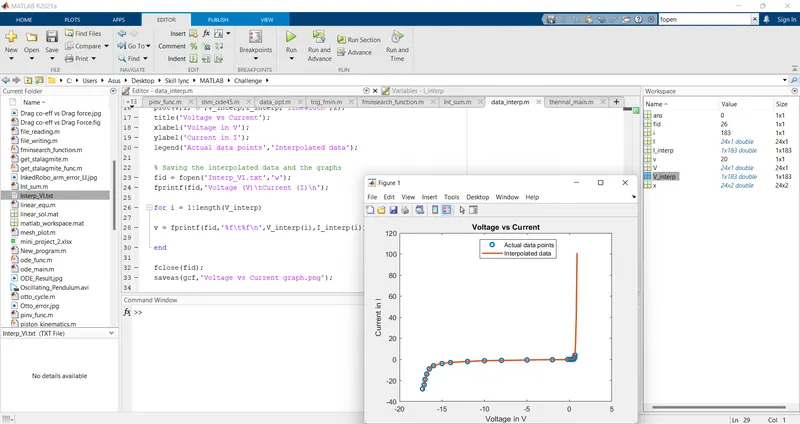
Project - Data Handling and Interpolation
REPRESENTATION OF THE RAW DATA AND INTERPOLATED DATA IN A 2D GRAPH AND STORING THE OUTPUT DATA
Aim :
- To extract the raw data from the file and to calculate the Current (I) data using the 'Interp1' function.
- To store the interpolated data and plot a 2D representation of the same.
Script :
% Data Interpolation
clear
close
clc

% Inputs and data extraction from the Excel file
x = xlsread('VI.xlsx');
V = x(:,1);
I = x(:,2);

% Data interpolation
V_interp = -17.3:0.1:0.9;
I_interp = interp1(V,I,V_interp,'spline');

% Plotting graphs
plot(V,I,'o',V_interp,I_interp,'linewidth',2);
title('Voltage vs Current');
xlabel('Voltage in V');
ylabel('Current in I');
legend('Actual data points','Interpolated data','location','north');

% Saving the interpolated data and the graphs
fid = fopen('Interp_VI.txt','w');
fprintf(fid,'Voltage (V)\tCurrent (I)\n');

for i = 1:length(V_interp)

v = fprintf(fid,'%f\t%f\n',V_interp(i),I_interp(i));

end

fclose(fid);
saveas(gcf,'Voltage vs Current graph.png');
Output :
- The excel file is opened using the 'xlsread' command and the individual set of data is stored in the variables 'V' and 'I'.
- The unknown data is interpreted using the 'interp1' function
- The obtained data is used to plot the graph comparing the raw data and the interpolated data.
- The interpolated data is stored in the required format using the 'fopen' fucntion and enabling the 'w' write command.
- The data is written in the specific order using the 'fprintf' function.
- Once the data storage is completed 'fclose' command is used to close the file.