Courses by Software
Courses by Semester
Courses by Domain
Tool-focused Courses
Machine learning
POPULAR COURSES
Success Stories
Project 2
AIM: To deal with the development of a forward energy-based fuel consumption model of a P1 hybrid vehicle. OBJECTIVE: Load the Project2 folder as the Current Folder in Matlab. Run the “Project2_InitFile.m” Matlab script. Copy the Conventional vehicle Simulink model created for Project 1 in this folder. Figure…
Aatas A G
updated on 25 Oct 2022
AIM:
To deal with the development of a forward energy-based fuel consumption model of a P1 hybrid vehicle.
OBJECTIVE:
- Load the Project2 folder as the Current Folder in Matlab.
- Run the “Project2_InitFile.m” Matlab script.
- Copy the Conventional vehicle Simulink model created for Project 1 in this folder. Figure 1: P1 Hybrid ArchitectureHybrid Drives Development
- Modify this model into a hybrid vehicle model. The lecture presentations can be used as reference. Battery and Supervisory controller models developed in the assignments can be reused.
- Add additional ‘To Workspace’ blocks for transferring the desired Simulink vehicle data into the Matlab workspace.
- Simulate the hybrid model on the desired drive cycles.
- Write a project report that contains the following:
- Tabulate the fuel economy numbers (kmpl) for UDDS and HWFET cycle. Compare these numbers with the baseline numbers for conventional vehicle model from Project 1.
- Plot the time trace for engine, transmission input, transmission output and wheel speed on one plot.
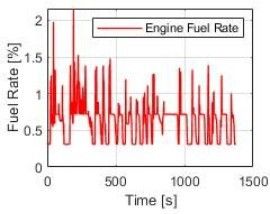
- Plot engine torque, engine power, fuel rate and fuel consumption using subplots.
- Plot accelerator and brake pedal, gear command, vehicle desired and actual speed, vehicle distance using subplots.
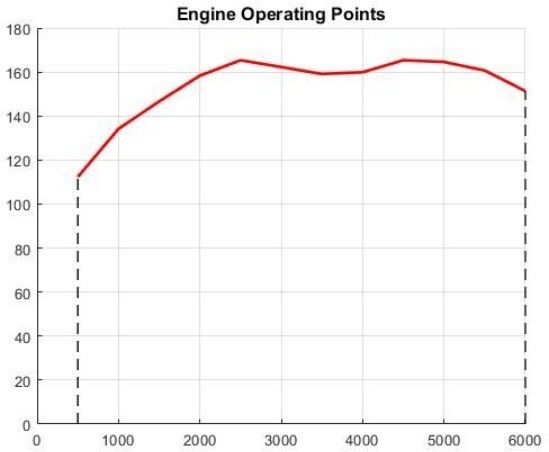
- Plot the engine operating points on the engine fuel map.
- Plot motor speed, torque, motor input power using subplots.
- Plot pack voltage, current and SoC using subplots.
- Plot the motor operating points on the motor input power map, with the motor max motoring and generating torque curves.
- Write down appropriate brief comments on each of these plots, describing the vehicle behavior throughout the drive cycle.
- Generate the plots for both drive cycles
THEORY:
P1 Hybrid Vehicle:
- The P1 architecture, with the electric machine connected directly to the crankshaft, is the solution adopted by Honda on their first-generation Integrated Motor Assist (IMA) technology.
- The electric motor functions as a generator, during vehicle deceleration, as an engine starter, and as a motor (to assist the engine) during vehicle accelerations.
- One of the biggest advantages of this solution is that the electric motor can provide higher torque than the BiSG, since there is no belt limitation (due to slip).
- However, since there is no speed / torque ratio between the electric machine and crankshaft, the torque requirements on the electric motor can be quite demanding.
- Two examples of P1 MHEV architectures are:
- Honda Insight Hybrid 2009 (with Integrated Motor Assist technology)
- Mercedes Benz S400 Blue hybrid 2010.

FORWARD MODEL:
- It is also known as Dynamic Simulation. Dynamic models are used for detailed simulations. In this model force or torque or power is the input and the vehicle state variable velocity and acceleration are outputs.
- The models and simulations are more realistic due to physical causality hence the appropriate for control

ENERGY AND PERFORMANCE OF VEHICLE:
In this system the power demand on the wheel need to instant supplied by the powertrain. The power train is consists of an engine connected to the wheels through a transmission therefore the power comes from the engine through the transmission.
CONVENTIONAL POWERTRAIN EFFICIENCY:
The engine generates power by converting chemical energy stored into the mechanical energy by the process of combustion. This process of energy conversion also has an efficiency and the energy input is in the form of fuel consumption.
Instantaneous fuel consumption is given as,
.mf = Pe/ηe*ηt*QLHV where,
mf = mass flow rate in(kg) pe = Power of engine
pt = Power of transmission
nt = Efficiency of transmission ne = Efficiency of engine
QLHV = lower heating value of fuel
- In this system of IC engine if the power at the wheels is zero the engine is idling and still consumes some fuel to overcome the engine drag loss and keep it spinning this is the idling fuel consumption and know a sidling
- Above mentioned formula is applicable only when the wheel power is strictly When the wheel power is negative either the engine is disengaged and idling.
- The engine is consuming fuel when it is idling but even for engine breaking the engine might be consuming some fuel. The fuel consumption not only depend on the power requirement at the wheels but also is required to generate power to run the various engine and vehicle accessory
SYSTEM DYNAMICS:
It deals with the modeling of multi domain systems with a unified approach based on an ordinary differential and algebraic equation describing the static and dynamic effects.
Each system has been two generalized variables. They are,
- Efforts: It is generalized force Example: torque, force, voltage, heating value.
- Flow: It is generalized flow (or) velocity Example: velocity, current, flow rate.
- Power: It is the product of the effort and flow variable. It is interchangeable between energy
ENERGY BASED MODELS-ELEMENT MODELS:
To models the internal physical properties of the element and the losses there are basically two kinds of approach. They are,
- MAP BASED MODELS:
Elements are modeled using maps which characterized the relationship between the input and output, output and losses, etc...
- ANALYTICAL MODELS:
Elements are modeled using physical equation that represent the internal dynamics. These are the two extremes most models are a combination of the two with some dynamics models analytically and for some using maps.
FORWARD MODEL:
- It is also known as Dynamic Dynamic models are used for detailed simulations. In this model force or torque or power is the input and the vehicle state variable velocity and acceleration are outputs.
- The models and simulations are more realistic due to physical causality hence the appropriate for control
MATLAB PROGRAM:
clear all
close all
clc

%Inputs
M = 2400;
cr = 0.013;
Rw  =  0.35;
cd  =  0.35;
Af  =  2.4;
rho  =  1.225;
Vwind = 0;
g =  9.81;
theta  =  0;
road_tire  =  1;

%powertrain inputs FDR = 3.73;
Diffefff  =  0.99;

NumGear = 4;
TransGear  =  [1:NumGear];
TransRatio = [3.06, 1.62, 1, 0.7];
TransEff  =  0.90;

TC_SCR = [0, 0.5, 0.6, 0.7, 0.8, 0.87, 0.92, 0.94, 0.96, 0.97, 1];
TC_TR = [2.232, 1.5462, 1.4058, 1.2746, 1.1528, 1.0732, 1.0192, 1, 1, 1, 1];
TC_Cf = 1e-4 * [0.72558, 0.66322, 0.63463, 0.59042, 0.51331, 0.4144, 0.29287, 0.22444, 0.12186, 0.4386, 0];

load vehicle_Data/Engine_data_1_9L_Saturn_95kw load Vechile_data/Trans_Shift_map

%Driver parameters kp = 10;
ki = 1;
Drive_Cycle_Select  =  1;

%Driver cycle values in m/s if Drive_Cycle_Select == 1
load DriveCycles/UDDS;

elseif Drive_Cycle_Select ==2 load DriveCycles/HWFET;

elseif Drive_Cycle_Select ==3 load DriveCycles/FTP;

elseif Drive_Cycle_Select ==4 load DriveCycles/US06;

elseif Drive_Cycle_Select ==5 load DriveCycles/NEDC;

elseif Drive_Cycle_Select ==6 load DriveCycles/WLTP;

end

time_end = cyc_time(end); vel_end = cyc_vel(end);

Time  =  out.tout;
Acc_pdl = out.Acc_pdl; Brk_pdl = out.Brk_pdl;
Gear_Cmd =  out.Gear_Cmd;

Trans_In_Spd   =   out.Trans_In_Spd*30/pi;
Trans_Out_Spd = out.Trans_Out_Spd*30/pi; Eng_Trq = out.Eng_Trq;
Eng_Spd  =  out.Eng_Spd*30/pi;
Eng_Fuel_Consumption    =    out.Eng_Fuel_Consumption;

Veh_Spd   =   out.Veh_Spd*18/5;
Veh_Dist = out.Veh_Dist/1000; Wheel_Speed = out.wh_speed;
Eng_Fuel_Rate   =   out.Eng_Fuel_Rate;

Eng_Pwr = Eng_Spd*pi/30*Eng_Trq/1000; rho_petrol = 0.7197;
kmpl    =    Veh_Dist(end)/(Eng_Fuel_Consumption(end)/1000/rho_petrol);

%plotting figure(1)
plot(Time, Trans_In_Spd,'LineWidth',1,'Color','k');
plot(Time, Trans_Out_Spd,'LineWidth',1,'Color','r'); plot(Time, Wheel_Speed,'LineWidth',1,'Color','b');
xlabel('Time[s]')
ylabel('Speed[rpm]') xlim([0,Time(end)]);
ylim([0,6000]);
legend('Trans Input', 'Trans Output', 'Wheel Speed');
grid on
hold  on

Eng_Spd = Eng_Spd.Data(:,1); Eng_Trq = Eng_Trq.Data(:,1); Eng_Pwr = Eng_Pwr.Data(:,1);
Eng_Fuel_Rate    =    Eng_Fuel_Rate.Data(:,1);
Eng_Fuel_Consumption = Eng_Fuel_Consumption.Data(:,1); Veh_Spd = Veh_Spd.Data(:,1);
Veh_Dist   =   Veh_Dist.Data(:,1);

%ploting figure(2)
subplot(2,2,1)
plot(Time,  Eng_Trq,'LineWidth',1,'Color','k')


xlabel('Time[s]')
ylabel('Torque[Nm]')
legend('Engine Torque')
grid on

subplot(2,2,2)
plot(Time, Eng_Pwr,'LineWidth',1,'Color','b') xlabel('Time[s]')
ylabel('Power[kw]')
legend('Engine Power')
grid on

subplot(2,2,3)
plot(Time, Eng_Fuel_rate,'linewidth',1,'Color','r') xlabel('Time[s]')
ylabel('Fuel  Rate[%]')
legend('Engine Fuel Rate')
grid on

subplot(2,2,4)
plot(Time, Eng_Fuel_Consumption,'LineWidth',1,'Color','g') xlabel('Time[s]')
ylabel('Fuel Consumption')
grid on

%ploting figure(3)
plot(Eng_Fuel_Consumption,Eng_Fuel_Rate,'Color','r') xlabel('Fuel Consumption')
ylabel('Fuel  Rate[%]')
title('Fuel Economy Vs Fuel Consumption')
grid on

%ploting figure(4)
subplot(2,1,1)
plot(Time, Acc_pdl,'LineWidth',1,'Color','k') plot(Time, Brk_pdl,'LineWidth',1,'Color','r') xlabel('Time[s]')
ylabel('Pedal[%]')
xlim([0, Time(end)]);
legend('Accel','Brake');
title('Accelerattion & Brake Pedal wrt Time')
grid on
hold  on

subplot(2,1,2)
plot(Time, Gear_Cmd,'LineWidth',1,'Color','k') xlim([0, Time(end)]);
xlabel('Time[s]') ylabel('Gear')
title('Gear command wrt Time')
grid on
hold  on

%ploting
subplot(2,1,1)
plot(Veh_Spd,Gear_Cmd,'LineWidth',1,'Color','k') xlabel('Speed [rpm]')
ylabel('Gear')
title('Gear command wrt vehicle speed')
grid on
hold  on

subplot(2,1,2)
plot(Veh_Dist,Gear_Cmd,'LineWidth',1,'Color','r') xlabel('Distance [kmpl]')
ylabel('Gear')
title('Gear command wrt Distance')
grid on
hold  on

%ploting
figure('Name','Engine Operating Points')
grid on
hold  on
title('Engine Operating Points','FontSize',12)
p1         =         plot(Eng_map_spd*30/pi,Eng_max_trq,'LineWidth',2,'Color','r');
p2 = line([Eng_map_spd(end)*30/pi Eng_map_spd(end)*30/pi],[0 Eng_max_trq(end)]);
set(p2, 'linewidth',1,'linestyle','--','color','k')
p3 = line([Eng_map_spd(1)*30/pi Eng_map_spd(1)*30/pi],[0 Eng_max_trq(1)]);
set(p3, 'linewidth',1,'linestyle','--','color','k')
[c,h] = contour(Eng_map_spd*'30/pi,Eng_map_trq,Eng_fuel_map');
clabel(c,h)
xlabel('Engine Speed [rpm]'); ylabel('Engine Torque [Nm]');
title('Engine Fuel Consumption Map [g/s]')
legend([p1 p3],['Max  Curve','Operating  Points'])
axis([Eng_map_spd(1)*30/pi  Eng_map_spd(end)*30/pi   0   Eng_map_trq(end)]);
SIMULINK MODEL:
- In this project, a typical Honda Insight motor and battery are considered for this project is Transmission shift map and controller is taken from MATLAB/Simulink example database.
- The model developed has the capability to simulate the vehicle on different drive cycles like UDDS, HWFET, FTP, NEDC, ..
- Project2_IntFile.m is a MATLAB script used to load all the variables required for running the Simulink model and for post-processing. The drive cycle selection is also done

DRIVER MODE:
- It is modeled using a Driver block which is a basic PI controller that generates accelerator and brake pedal outputs to match the desired and actual vehicle
- In this we use drive cycles for based on these fuel consumption and emissions the vehicle gets certified and it also forms a basis of uniform assessment. It is based on time velocity then its all integrate and creates output acceleration pedal and brake

- OUTPUT FROM SCOPE IN DRIVER MODEL:

- CONTROL MODEL:
- The control block is the brain of the vehicle which represents the electronic controls units. It is based on the driver inputs, it generates desired engine torque, desired transmission gear and desired brake These inputs are fed io the powertrain block which represents the drivetrain of the vehicle.

- ENGINE CONTROL UNIT:
- In this control model we use engine control unit in that give input engine speed through creating lookup In that we give a input Maximum torque and map speed then also create 2nd lookup table in that we give input ct torque and map speed then it subtracts and multiplied. The engine speed is also given to ideal control speed to integrate from this we meet output of engine required torque.

- OUTPUT FROM SCOPE IN ECU:

- TRANSSIMISSION CONTROL UNIT:
- In this unit we create steady flow variable state for controlling of gears of vehicle as in ascending and descending order with respect to time, speed, distance, and we give input to this steady state is vehicle speed to m/s to

- BRAKE CONTROL UNIT:
- In this we calculate the brake torque and then all three control signals output is given to

- POWERTRAIN:
- The powertrain is components that converts the engine's power into This includes the engine, transmission, driveshaft, differential, axles. Basically, anything from the engine through to the rotating wheels.
- ENGINE:
- In this model we used map-based model to the fuel consumption of engine. It is based on maximum torque and minimum torque form the controller and then it saturated torque and give output then saturated torque and speed map give fuel consumption takes the speed and torque then the output goes into saturated then its integrated.

- OUTPUT FROM SCOPE IN DRIVER MODEL: (Engine Torque)

- TRANSMISSION:
- In this model we take engine torque, gear selector form controller for transmission of gear The ratio is multiplied by transmission input torque and then transmission efficiency positive torque and negative torque gives transmission input speed. In this case torque converter connects the engine to transmission it is part of transmission.

- OUTPUT FROM SCOPE IN DRIVER MODEL:(Transmission in speed, gear ratio, differential ratio)

- DIFFERENTIAL:
- In this input is the transmission output then it is going to differential ratio multiplied the output and input torque then meet axle The axle torque is a lower than the transmission torque and differential ratio.

- WHEELS:
- In this model we take the axle torque form the differential and brake torque form controller. It is subtracting and multiplied rolling radius and velocity then we meet the tractive force from axle and brake torque and the wheel speed is meet using

- VEHICLE DYNAMICS:
- In this we take tractive force and road It is disc rates vehicle speed based on tractive force and road load. The dynamic equation for calculation is,
- Ftrac = M(dVveh/dt) + 1/2*rho*Af*Cd*(Vveh+Vwind)^2 + Cr*Mgcos() + Mgsin()
- Ptrac = pw = MV(dv/dt) + 1/2 * rho * Af * Cd * V^3 + CrMgV
- Ew = ki ∫v(dv/dt).dt + ka∫v^3.dt + kr∫Vdt
- where,
- Rho = Air density(kg/m^3)
- Af = Frontal Area(m^2)
- Cd = Drag Coefficient
- Vveh = Velocity of vehicle(m/s^2)
- Vwind = Velocity of wind(m/s^2)
- Cr = Rolling resistance coefficient
- M = Mass(kg)
- g = Gravity
- Then we calculated and integrate then we meet acceleration of vehicle and velocity of vehicle it mean vehicle distance and vehicle
- In this we take tractive force and road It is disc rates vehicle speed based on tractive force and road load. The dynamic equation for calculation is,

- OUTPUT FROM SCOPE IN DRIVER MODEL: (Road load, Acceleration, Tractive force)

- OUTPUT FROM SCOPE IN DRIVER MODEL: (Road load)

THE CALCULATION FOR THE FUEL ECONOMY NUMBERS USING UDDS AND HWFET CYCLE:
- UDDS DRIVE CYCLE:
TIME VS SPEED: The speed is increasing

AERODYNAMIC DRAG: Drag as increase when the power

ROLLING RESISTANCE: Increase when power is increase with respect to

TOTAL POWER = AERODYNAMIC DRAG + ROLLING RESISTANCE + INERTIAL RESISTANCE
_1666689652.png)
OBSERVATION:
Total power is increase slowly as increasing rolling resistance, aerodynamic drag and inertial
2.HWFET DRIVE CYCLE:
TIME VS SPEED: The speed is continuously increase with respect to time.

AERODYNAMIC DRAG: Drag as increase when the power increases.

ROLLING RESISTANCE: Increase when power is increase with respect to time.

TOTAL POWER = AERODYNAMIC DRAG + ROLLING RESISTANCE + INERTIAL RESISTANCE:

OBSERVATION:
The total power is increase slowly as increasing aerodynamic drag and inertial resistance. But in this drive cycle bad impact occur due to decreasing rolling resistance.
RESULT:
As comparing the both cycles, we used to UDDS drive cycle. It is good for assets of a fuel consumption and pollutants emission of vehicle in a normal way.
MATLAB OUTPUT:
Plotting vehicle characteristics time trace transmission IN OR OUT and Wheel Speed:

In this graph we see that the transmission input and transmission output will fluctuates up and down as increasing speed and time.
Plotting vehicle characteristics time trace to Engine Speed, Engine Torque, Engine Power, Engine Fuel Rate and Engine Fuel Consumption:

_1666690853.png)
_1666690826.png)

In this Engine Torque, Engine Power, Engine Fuel Rate, and Engine Fuel Consumption is increasing with respect to time.
Ploting the Fuel Economy VS Engine Fuel Consumption:

In this the engine fuel consumption is suddenly increase as increasing fuel economy but it fuel economy is constant
then the fuel consumption is also constant.
Ploting Accelerator Pedal, Brake Pedal and Gear command with respect to time:


In this, comparing brake of vehicle the accelration of vehicle is more so the brake torque is min required and the gear
shifiting is also required with respect to time.
Ploting Gear Command Vehicle desired with Actual Speed:


In this the gear shifting is required as increase vehicle speed as shifting order is Gear1, Gear2, Gear3, Gear4.
Ploting Engine Operating Points On Engine Fuel Map:


In this as decrease torque speed is increase
Electric Motor Efficiency Map and Torque Curve:

P lot pack voltage, current and SoC:


OBSERVATION:
Thus the All the objective mentioned above is calculated sucessfully.
RESULT:
Thus the development of a forward energy-based fuel consumption model of a P1 hybrid vehicle. determined successfully.
Leave a comment
Thanks for choosing to leave a comment. Please keep in mind that all the comments are moderated as per our comment policy, and your email will not be published for privacy reasons. Please leave a personal & meaningful conversation.
Other comments...
Be the first to add a comment
Read more Projects by Aatas A G (50)
Week 4 - CHT Analysis on Exhaust port
AIM: To perform the simulation of Conjugate heat transfer analysis on given exhaust port geometry by using ANSYS FLUENT. OBJECTIVE: To study the importance of Conjugate heat transfer analysis and importance of y+ value during meshing of the components. To perform the simulation of Conjugate heat transfer analysis on given…
12 Dec 2022 08:19 AM IST
Week 10 - Simulating Combustion of Natural Gas.
AIM To perform a combustion simulation on the combustor model. Objective Part I Perform a combustion simulation on the combustor model and plot the variation of the mass fraction of the different species’ in the simulation using line probes at different locations of the combustor as shown in Fig. You need to plot…
07 Dec 2022 11:26 AM IST
Week 9 - Parametric study on Gate valve.
Aim: To perform a parametric study on Gate valve. Objective: Simulate the flow of fluid through a gate valve. Perform the parametric study on the gate valve by setting design points corresponding to the positions of the lift of the spindle. Calculate the mass flow rate corresponding to all the design points Gate…
07 Dec 2022 10:12 AM IST
Project 2
AIM: To deal with the development of a forward energy-based fuel consumption model of a P1 hybrid vehicle. OBJECTIVE: Load the Project2 folder as the Current Folder in Matlab. Run the “Project2_InitFile.m” Matlab script. Copy the Conventional vehicle Simulink model created for Project 1 in this folder. Figure…
25 Oct 2022 01:11 PM IST
Related Courses


Skill-Lync offers industry relevant advanced engineering courses for engineering students by partnering with industry experts.
Our Company
4th Floor, BLOCK-B, Velachery - Tambaram Main Rd, Ram Nagar South, Madipakkam, Chennai, Tamil Nadu 600042.
Top Individual Courses
Top PG Programs
Skill-Lync Plus
Trending Blogs
© 2025 Skill-Lync Inc. All Rights Reserved.


