Project-1: Powertrain for aircraft in runways
PART-A
1)Search and list out the total weight of various types of aircrafts.
You may have been looking at the table above and thinking the numbers don’t work out because if you took the Aircraft Empty Weight and added the Maximum Fuel Weight and Maximum Cargo it could carry, it could be well over the aircraft’s Maximum Gross Weight.
Welcome to the world of aviation! This is where a compromise of fuel vs cargo/passengers is required and is referred to as the Useful Load.
Typical Airplane Weights
Below is a table of some of the most common aircraft flying around our skies today:
| Aircraft | Empty Weight | Max Fuel Weight | Max Cargo Weight | Max Gross Takeoff Weight |
|---|---|---|---|---|
| Antanov AN-225 | 628,000 lbs 285,000 kg |
661,400 lbs 300,000 kg |
417,000 lbs 190,000 kg |
1,411,000 lbs 640,000 kg |
| Airbus A380-800 | 611,000 lbs 277,000 kg |
560,000 lbs 254,000 kg |
185,000 lbs 84,000 kg |
1,268,000 lbs 575,000 kg |
| Boeing 747-800 | 485,300 lbs 220,100 kg |
427,400 lbs 194,000 kg |
295,000 lbs 134,000 kg |
987,000 lbs 447,700 kg |
| Airbus A340-500 | 370,000 lbs 168,000 kg |
386,300 lbs 175,000 kg |
119,000 lbs 54,000 kg |
820,000 lbs 372,000 kg |
| Boeing 777-300ER | 370,000 lbs 168,000 kg | 320,800 lbs 145,500 kg | 148,000 lbs 67,100 kg |
776,000 lbs 352,000 kg |
| Boeing 787-10 | 299,000 lbs 135,500 kg | 223,500 lbs 101,500 kg |
126,300 lbs 57,300 kg | 560,000 lbs 254,000 kg |
| Boeing 737-900 | 98,500 lbs 44,700 kg |
53,100 lbs 24,000 kg |
44,600 lbs 20,200 kg |
187,000 lbs 85,000 kg |
| Airbus A320-100 | 93,900 lbs 42,600 kg |
48,700 lbs 22,100 kg |
44,000 lbs 20,000 kg |
150,000 lbs 68,000 kg |
| Embraer 190 | 63,500 lbs 28,800 kg |
28,600 lbs 13,000 kg |
28,800 lbs 13,100 kg |
106,000 lbs 48,000 kg |
| Gulfstream G650 | 54,000 lbs 24,500 kg | 48,200 lbs 21,900 kg | 6,500 lbs 3,000 kg |
100,000 lbs 45,200 kg |
| Bombardier CRJ900 | 48,160 lbs 21,850 kg | 19,600 lbs 8,900 kg | 6,075 lbs 2,760 kg | 80,500 lbs 36,500 kg |
| Bombardier Q400 | 39,300 lbs 17,800 kg |
11,700 lbs 5,300 kg |
18,700 lbs 8,500 kg |
62,000 lbs 28,000 kg |
| Learjet 75 | 13,900 lbs 6,300 kg | 6,060 lbs 2,750 kg |
2,900 lbs 1,300 kg |
21,500 lbs 9,700 kg |
| Cessna Citation CJ4 | 10,300 lbs 4,700 kg | 5,800 lbs 2,650 kg |
2,200 lbs 1,000 kg | 17,200 lbs 7,800 kg |
| Beechcraft King Air B100 | 7,100 lbs 3,200 kg | 3,200 lbs 1,450 kg |
4,150 lbs 1,900 kg |
12,000 lbs 5,400 kg |
| Diamond DA50 RG | 3,200 lbs 1,450 kg |
340 lbs 155 lbs |
1,250 lbs 560 kg |
4,400 lbs 2,000 kg |
| Beechcraft Bonanza G36 | 2,500 lbs 1,150 kg | 450 lbs 200 kg |
850 lbs 385 kg |
3,660 lbs 1,660 kg |
| Cessna 206H | 2,200 lbs 990 kg |
520 lbs 235 kg |
1,150 lbs 520 kg |
3,600 lbs 1,630 kg |
| Sirrus SR22 | 2,250 lbs 1,000 kg | 485 lbs 220 kg |
950 lbs 430 kg |
3,600 lbs 1,630 kg |
| Cessna 172R | 1,700 lbs 770 kg |
380 lbs 170 kg |
560 lbs 255 kg |
2,425 lbs 1,100 kg |
⟹2. Is there any difference between ground speed and air speed?
While ground speed is the airplane’s speed relative to the surface of the Earth, airspeed – at least true airspeed – is its speed relative to the air it is flying in.
Below, I will explain the two types of speed in more detail, as well as talk about the four types of airspeed that are commonly used.
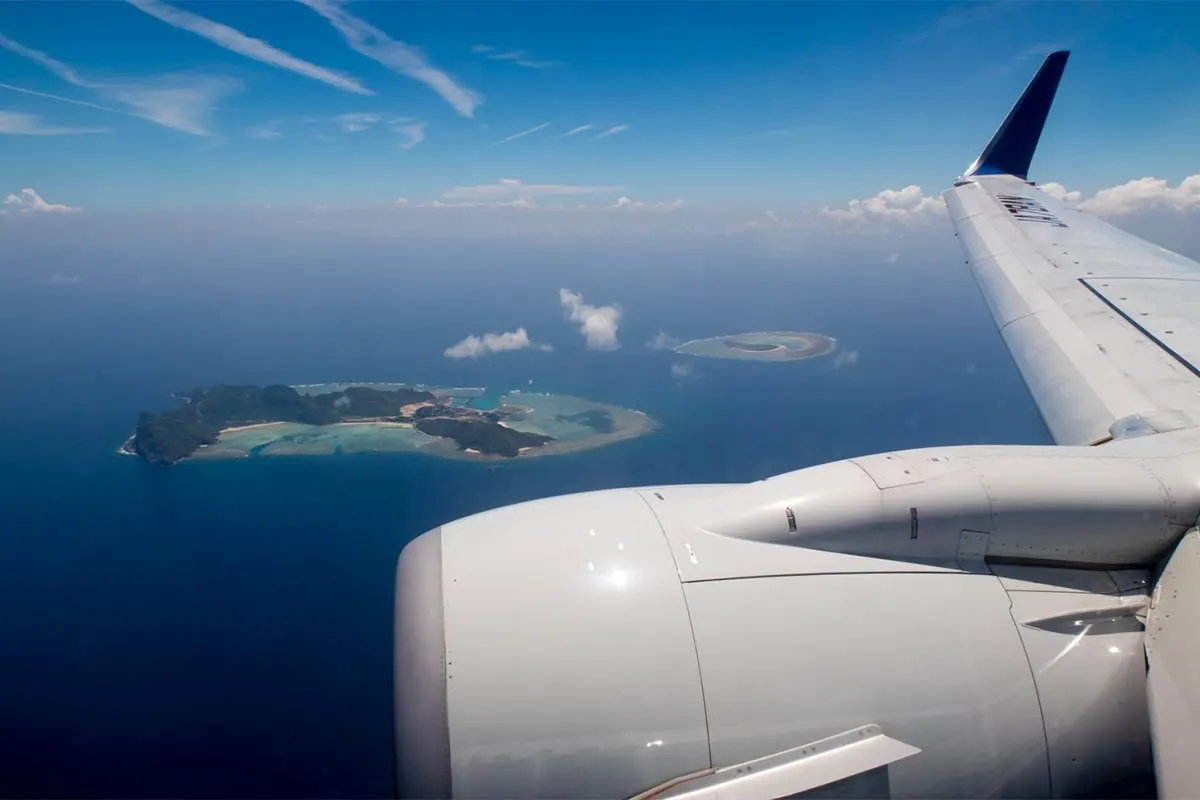
Airspeed vs. Ground Speed
As mentioned above, true airspeed is simply the speed at which an aircraft is moving relative to the air it is flying in. As such, it’s also the speed at which the air is flowing around the aircraft’s wings.
Ground speed, on the other hand, is the aircraft’s speed relative to the ground. One thing that should be noted here is that it’s its horizontal rather than vertical speed – an aircraft climbing completely vertically would have a ground speed of zero.
In other words, while airspeed is what determines whether there is enough airflow around an aircraft to make it fly, ground speed is what determines how fast an aircraft will get to its destination.
Wind’s Effect on Ground Speed
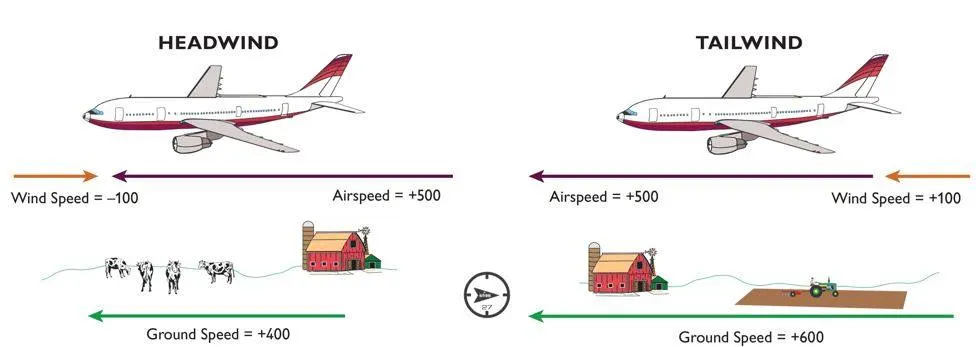
The relationship between airspeed and ground speed is fairly simple. Ground speed is simply the sum of airspeed and wind speed.
If the aircraft is flying in the same direction as the wind is blowing, the aircraft experiences tailwind, and its ground speed is higher than its airspeed. On the other hand, if the wind is blowing against the direction the aircraft is traveling in, the aircraft experiences headwind, and its ground speed is lower than its airspeed.
To give you an actual example, imagine an aircraft that cruises at an airspeed of 500 miles per hour that has to cover a ground distance of 2,000 miles.
If there is no wind at all, then both the aircraft’s airspeed and ground speed would be the same 500 miles per hour, and the aircraft would reach its destination in four hours.
If there was a 100 miles per hour headwind – wind blowing against the aircraft’s direction of travel – the aircraft would still be traveling at an airspeed of 500 miles per hour. However, its ground speed would be just 400 miles per hour (100 miles per hour slower than its airspeed). And as such, it would take the aircraft five hours to reach its destinations.
Finally, if there was a 100 miles per hour tailwind – wind blowing in the same direction as the aircraft’s travel – the aircraft would still be traveling at an airspeed of 500 miles per hour, but its ground speed would be 100 miles faster. And, at 600 miles an hour, the aircraft would reach its destination in just three hours and twenty minutes.
The above is the reason why some flights go “out of their way” to avoid headwinds or catch tailwinds. And, why some flights might appear to be traveling at “supersonic speeds,” even though their airspeed – the speed that would actually matter in determining whether or not the flight truly is supersonic – is subsonic.
The Moving Walkway Analogy
In case you are still unsure about the difference between airspeed and ground speed, here’s an analogy to bring the concepts “down to earth.”
Imagine a moving walkway going from point A to point B moving at 3 miles per hour.
And, imagine you are walking on the walkway at a speed of 3 miles per hour relative to the walkway. In other words, you are moving from point A to point B at a speed of 6 miles per hour – the sum of the speed of the walkway and the speed at which you are walking relative to the walkway.
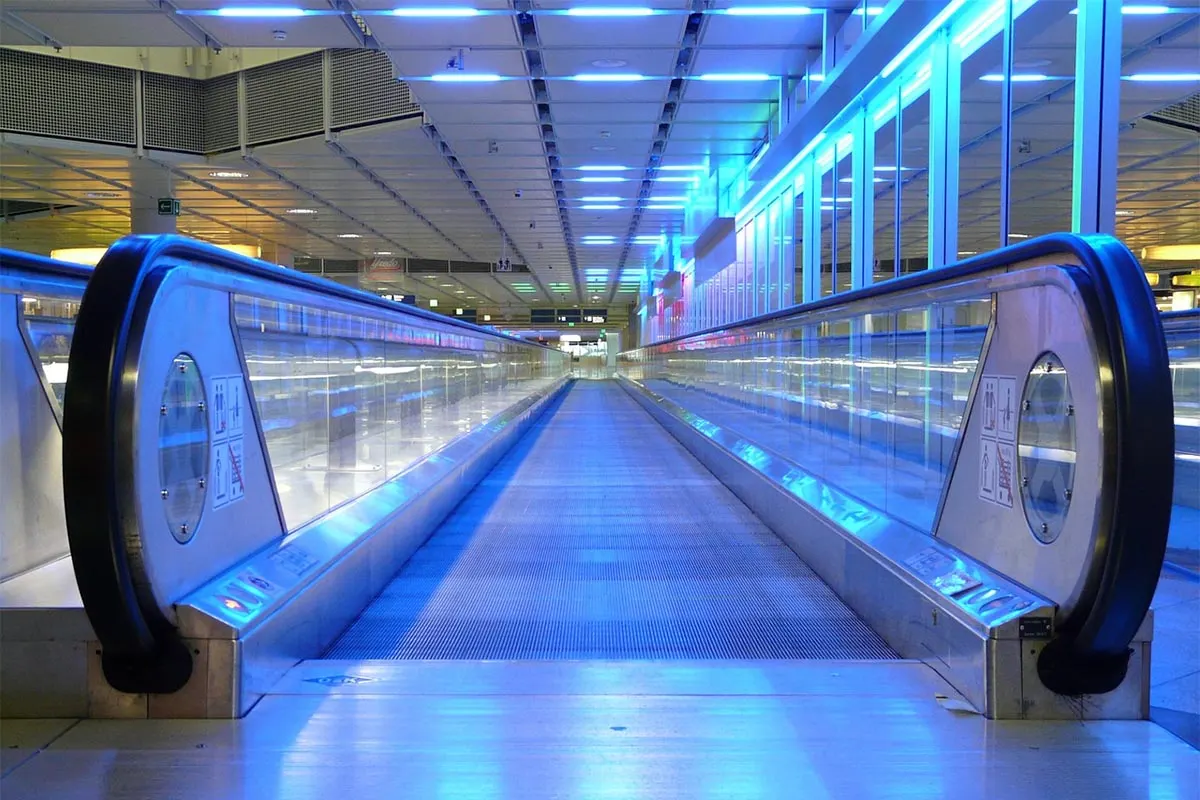
What if, though, you tried to walk on the walkway from point B to point A?
Obviously, if you walked at 3 miles per hour relative to the walkway, you would be standing still. To move, you would have to walk faster than 3 miles per hour relative to the walkway. For example, if you walked at 5 miles per hour relative to the walkway, you would be moving from point B to point A at a speed of 2 miles per hour.
Finally, if the walkway was broken and wasn’t moving, your speed relative to it would be the same as the speed you would be moving at from point A to point B.
By now, you have probably figured out that in the analogy above, the speed of the walkway takes the place of wind speed, the speed at which you are moving from point A to point B (or vice-versa) is the ground speed, and the speed at which you are moving relative to the walkway is the airspeed.
The Three Types of Airspeed
When I talked about airspeed earlier in this article, I was talking about true airspeed. However, pilots commonly use three different types of airspeed: indicated airspeed, calibrated airspeed, and true airspeed.
Indicated airspeed is an airspeed that is calculated directly off an aircraft’s pitot-static system. It’s the calculated off the aircraft’s dynamic pressure – the difference between its total pressure and static pressure.
The dynamic pressure depends not only on the aircraft’s speed, but also on the density of the air it is flying in. As such, the higher the aircraft flies – and the lower the air density as a result – the bigger the difference between indicated and true airspeed is.
Calibrated airspeed is indicated airspeed adjusted for a variety of errors.
Just as an example, one of the things it’s adjusted for is the flap position. The reason for that is that at different flap positions, air flows differently around the pitot-static system and affects the indicated airspeed readings.
True airspeed is, as has been mentioned numerous times in this article, the actual speed at which an aircraft is moving relative to the air it is traveling in. It’s calibrated airspeed adjusted for the the exact conditions (altitude, air temperature, etc.) that the aircraft is flying in.
⟹ 3. Why is it not recommended to use aircraft engine power to move it on the ground at Airport?
We are assuming passenger commuter aircraft and large airliners. Aircraft move using their own engine power all the time on the airport apron and taxiways under their own power to go towards runways and after landing taxi to their assigned gate.
The only time they use external assistance is to pushback from the gate. Large turbofan aircraft need help to reverse via a pushback tractor. The engines are turned on after the pushback is complete and the aircraft can move forward under It’s own power.
To be accurate, some aircraft can reverseusing a variable pitch prop or thrust reversing on turbofans but generally reversing is done via pushback tractors. Blasting jet reversers blows debris In the crowded gate area creating foreign object damage hazard for adjacent aircraft, gate equipment or terminal waiting area glass windows.
Although many aircrafts are capable of moving in backward using reverse thrust, as result the jet blast or prop wash
might cause damage to the terminal building or equipment. Engine close to ground may also blow sand and debris
forward and then suck them into the engine, causing damage to the engine. Therefore there are pushback trucks in
the airport. A pushback truck lifts the front weel of the aircraft, their role in most airports is to move the aircraft away
from the parking spot on to the taxiways, which is called towing.
i) Effectively a loss of control can happen, especially during highpower engine running. Damage can occur to the aircraft itself, otheraircraft nearby or to airside structures.
li) There is a risk of injury to ground support personnel who may be inrelatively close proximity totheaircraft.
ili) It is easier for truckdriver to see the surroundings better than the pilot sitting in thecockpit with limited window. The pushback driver knows the airportbetter than the pilot.
iv) It also saves fuel.virgin Atlantic had proposed a new system in which pushback truckwill move the aircraft all the way to runway to save fuel and reduce impact of environment.
V) The plane engines are very loud. When more than one plane will add up their sound,than it will not be pleasent for passangers and others near airport.
4. How an aircraft is pushed to runway when its ready to take off?
Ready for take-off in ten steps…
From landing to take-off in next to no time
“Cabin crew, prepare for landing...” Your flight is approaching Schiphol and preparing to land on a runway assigned by air traffic control. The wheels hit the ground and passengers applaud as the aircraft taxis briskly towards the gate. Even as it safely reaches its designated stand and travellers spring from their seats to wait in the aisle until the door opens, ground personnel are gathering outside to ready it for departure as fast as possible. What needs to be done to get the plane back in the air on time
Ready for take-off in ten steps…
- The pilot parks the aircraft in exactly the right place. Usually with the help of an automatic system, but occasionally guided by a marshaller waving two paddles or wands. Dozens of handling personnel are already standing by to perform a whole range of tasks simultaneously.
- As soon as the aircraft is stationary and the engines are switched off, the first priority is to disembark the passengers as quickly as possible. The apron handler places chocks in front of the wheels and connects the ground power. Meanwhile, the passenger bridge manoeuvres up to the door and a belt loader rolls up to the cargo hold. Luggage is unloaded and transferred to the terminal on baggage carts.
- Refuelling begins, usually from a hydrant at the stand. A hose is attached to this from a special vehicle called a dispenser, with the other side connected to the fuel tank in the wing. Read more about refuelling
- Now it is time to service the aircraft. The caterer loads new meals and takes away the food waste and used cutlery and crockery. Other activities include draining the lavatories, replacing the headrest covers, removing rubbish and distributing fresh blankets and in-flight magazine.
- A specialist team – or sometimes the crew themselves – cleans the cabin so that the new passengers board a pristine aircraft.
- Meanwhile, specialists from the airline conduct a technical check to make sure that the engines, wings, control surfaces, landing gear, instruments, doors and other equipment are in full working order.
- The aircraft is now ready for baggage to be loaded for the next flight. This is a quick process, on average taking only 10-15 minutes. A little later the passengers start boarding. As soon as they are all in their seats, the door is closed and the pilot informs air-traffic control that the flight is ready for departure.
- The apron handler removes the chocks. A so-called pushback truck reverses the aircraft into taxiing position, pushing it with a towbar attached to the nose-wheel strut. Or, in the most modern versions, by actually lifting the wheel. That speeds up coupling and decoupling.
- The aircraft taxis to the runway to depart at the agreed time.
- The pilot waits for permission to take off from air-traffic control. This is possible once the departure route is clear. As soon as the go-ahead is received, the plane takes to the air at full power.ahead is received, the plane takes to the air at full power
5. Learn about take off power, tyre design, rolling resistance, tyre pressure, brake forces when landing.
Take off Power
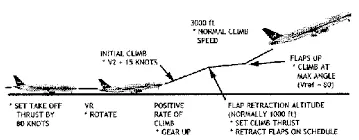
When lined up on the runway and cleared for take-off, the PF will start to advance the thrust levers. On aircraft that are powered by fan engines – especially aeroplanes like the AIRBUS A-300/A330 Family where the engines are relatively large – inertia in the big fans at the front may mean that both or all engines do not always ‘spool up’ at the same rate. Until this has happened, the pilot should not advance the throttles any further as to do so could set up an asymmetry that he/she might find difficult to control through nose-wheel steering alone. Once the engines have all ‘spooled up’ it is safe to advance the thrust levers together to the position that will enable the engines to deliver the amount of thrust required for take-off. It is for ‘spool up’ reasons that tower controllers may sometimes observe a hesitation – typically 6 to 10 seconds - after the aeroplane begins to roll forward before its acceleration along the runway appears ‘normal’, and why pilots may not always seem to respond quickly to requests to ‘expedite departure’. The required thrust should be attained before the aeroplane’s indicated air speed passes 80kts.
In order to reduce the likelihood of a rejected take-off resulting in an over-runvor other undesirable outcome, it is often stated in the SOPs that once above a specified speed during the take-off roll the take-off should only be rejected for specified occurrences. The specified speed is typically 80 knots. Below this speed the take-off may be rejected for any reason. Above the specified speed it is typical for the SOPs to state that the take-off should only be rejected for an engine failure, any type of fire or an unsafe condition that would render the aircraft unable to fly. The call at 80 knots is also used to check that the pilots have not become incapacitated during the take-off roll. If the PM does not make the call, or if the PF does not respond, it could be due to incapacitation and the take-off should be aborted.
Tyre desgin
DESIGN A TYRE TREAD
For each single aspect of a tyre, Pirelli engineers use specific calibration systems to simulate the behaviour of each material and the applied solutions during development before making prototypes to be tested on the road. These extensive trials provide indications on performance of the tyre and on efficiency of the pattern itself. For this reason, course, road surface, temperatures and other parameters are carefully selected to accurately analyse the behaviour of the prototype.
At the end of the first comprehensive test phase, the data collected from the various products subjected to many kilometres of use are analysed and Pirelli performs the first of many selections aimed at pinpointing the models with the most effective behaviour and with the most pleasing appearance. This latter aspect, tyre design, is just as important for those tyres made for the most exclusive supercars in the world, like the most recent Pirelli P Zero range. Research ends with a final test also on the proving grounds. If the results fulfil all expectations, the prototype becomes a product to be marketed.
The tyre-road contact area can hardly be taken for granted and it is not even similar from manufacturer to manufacturer. Each manufacturer has its own principles, engineering needs, care for detail, style and goals to be achieved. Precisely for this reason, each product has a precise, sophisticated and carefully designed pattern according to the intended use of the tyre and its construction materials. These elements make it possible to obtain the best efficiency in terms of safety and road efficiency with a focus on fuel consumption and running costs. The latter key aspect is held in the highest consideration by users of vehicles. The tread pattern distributed on the most crucial area of the tyre, which only slightly larger than the palm of an adult's hand, is fundamental for a number of reasons. These may be summarised also in terms of high driving quality and safety in tricky conditions.
On dry roads, for instance, a tread designed to provide rigidity will allow the tyre to transmit confidence on corners and ensure very effective holding. A result like this is achieved also considering other factors, such as the limited presence of grooves and the use of large-sized blocks which contribute to amplifying the rigidity of the structure and consequently a contact surface aimed at providing the best possible traction. Conversely, the presence of more marked grooves and sipes amplifies water discharge at various speeds to the advantage of safety in case of rain. In this case, the different tread design – directional, asymmetrical or symmetrical – determines the degree of water evacuation and improves the balance or the tendency to privilege multiple aspects, such as high performance and efficiency constancy, which characterise the various pattern types.
For the sake of simplicity, the tyre pattern categories mentioned above are the combination of various tyre tread types: directional, asymmetrical and symmetrical.
The first, also known as unidirectional, is a typical tread characterised by a pattern drawn in the same direction, e.g. V-shaped, designed to ensure high grip on wet roads and slippery surfaces, such as mud and snow, when high traction is needed. This pattern ensures fast and efficient sideward ejection of water or slush, thus contributing to amplifying road-holding and consequently safety by avoiding dangerous aquaplaning.
Asymmetrical treads, on the other hand, are characterised by various types of grooves on the surface, which can be observed according to the part of the wheels on which attention is focused. Considering the pattern variety, these tyres have very high road-holding capabilities on various terrain consequent to its versatility of use and performance, while maximising safety on wet and slippery surfaces. Given these features, particular care must be devoted to fitting these tyres because the different pattern on the inner and outer areas may condition driving. The inner section is normally characterised by many smaller blocks to ensure higher efficiency on moist, slippery roads, while on the outside, the dimensions are larger to ensure greater stability and cornering efficiency.
Finally, symmetrical tyres, as the name suggests, have the same pattern across the entire tyre. The same shape on the inside and outside means high levels of efficiency, speed and road safety.
The tyre tread patterns are fundamental for improving the vehicle and its performance on the road. They influence and lower the rolling resistance and the wet traction and, depending on the type of tyres used, they lower the width of suspension. Car manufacturers are producing tread patterns to guarantee an ever increasing level of performance and change the quality of driving: for example, they are developing tread patterns for electric cars which employ ground energy or, other kind of tyres that increase the maximum weight supported by trucks and all kind of vehicles. The tread pattern also influences the temperature of the tyre in touch with the road and some special patterns are able to lower the heat of the tyre for a more performant drive.
Rolling resistance
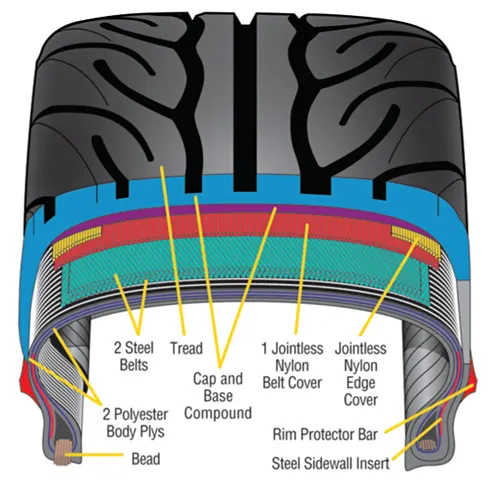
When you press down on the accelerator in your vehicle, you are essentially transferring energy—in the form of gas or electricity, depending on your automobile, through the engine and other systems in your vehicle. That results in your tires turning and enough momentum being built up to move your automobile. To accomplish this, though, your vehicle must overcome a lot of different factors that can make it resistant to forward movement. One of those factors is the tires’ rolling resistance.
Tire rolling resistance is the energy that your vehicle needs to send to your tires to maintain movement at a consistent speed over a surface. In other words, it is the effort required to keep a tire rolling. The main contributor to rolling resistance is the process known as hysteresis. Hysteresis is essentially the energy loss that occurs as a tire rolls through its footprint. The energy loss must be overcome by the vehicle’s engine, which results in wasted fuel.
CAN ROLLING RESISTANCE BE AVOIDED?
Rolling resistance is going to happen whenever a tire makes contact with a road surface. However, although it can’t be avoided, it can be minimized. Since tire rolling resistance is caused by hysteresis, tires can be engineered with specially formulated tread compounds that are more resistant to heat generation and constructed to minimize tire deflection for less energy loss. These are known as low rolling resistance tires.
ARE THERE BENEFITS TO LOW ROLLING RESISTANCE TIRES?
For drivers who are interested in optimizing their vehicle’s fuel efficiency, the answer is yes. Low rolling resistance tires can be much more fuel-efficient tire than conventional tires. The U.S. Department of Energy has done research that shows that utilizing low rolling resistance tires can have as much as a 10% fuel savings impact for drivers. However, for most drivers, the fuel savings is around 3%. Although that doesn’t sound like a lot, those numbers can add up over time and result in a substantial savings in fuel spending and waste.
ARE THERE COMPROMISES WITH LOW ROLLING RESISTANCE TIRES?
Like most things in life, you can’t get something without giving a little, and the same holds true for low rolling resistance tires, unless new technology is introduced. For example, a tire manufacturer can reduce tread depth to improve rolling resistance. However, there will be a corresponding reduction in tire wear life. To overcome this tradeoff, new technology could be designed to maintain the wear performance, while still improving rolling resistance.
WHAT TYPES OF LOW ROLLING RESISTANCE TIRES DOES BRIDGESTONE OFFER?
Here at Bridgestone, the tires with the best rolling resistance are in the Ecopia line. They’re also our most fuel-efficient tires. Our Ecopia line of tires is engineered to offer a balanced, all-season comfortable ride and a top-notch driving experience. Some of our Ecopia tires are even partially made from recycled rubber to improve their environmental friendliness.
Our entire line of Ecopia tires is designed to offer drivers an eco-friendlier all-season tire option that doesn’t compromise on performance or ride comfort.
Actual results may vary based on tire maintenance, vehicle, driving style and road conditions
Tyre pressure
OPTIMUM TYRE PRESSURES PROVIDE:
- Increased safety
- More predictable road handling
- Reduced fuel consumption
- Reduced emissions
WHEN SHOULD TYRE PRESSURES BE CHECKED?
It’s very easy for tyres to become deflated if they aren’t checked regularly, so how often should you check tyre pressure? A tyre typically loses around 1 psi (0.07 bars) per month and this can result in uneven wearing of the tread, so we recommend checking your tyres every two weeks as well as before motorway driving and long journeys. Make it part of your tyre maintenance routine, as well as taking time to check your tyre’s tread depth and see if there’s any damage.
It’s best to check your tyre pressure when your tyres are cold, and by ‘cold’ we mean that you’ve driven no more than 2 miles before checking. If your tyres are warm, the pressure inside them increases so any change in pressure will probably be too low.
Something else to bear in mind is that cars manufactured after 2012 have an inbuilt Tyre Pressure Monitoring System (TPMS). But how do tyre pressure sensors work? TPMS allows you to set your vehicle’s required tyre pressure and you’ll be alerted immediately if there’s any change in pressure.
WHY IS IT IMPORTANT TO CHECK TYRE PRESSURE?
Checking your tyres is incredibly important for three main reasons:
- Tyre safety - Incorrect tyre pressure can affect handling. If you’re below your vehicle manufacturer guidelines, there’s an increase in the risk of aquaplaning as well as an increase in braking distance on dry roads.
- Fuel economy - You’ll reduce your running costs by keeping your tyres at the correct pressure. Underinflated tyres have to work a lot harder than properly inflated tyres as they’re met with an increased rolling distance, which then increases your vehicle’s fuel consumption.
- Longevity - Driving with the incorrect tyre pressure can lead to tyre deterioration and weakening of the reinforcing structure, and that dramatically reduces the lifespan of your tyres.
UNDER INFLATED TYRES
Tyres can quickly become underinflated if you don’t check them regularly enough. Driving with low tyre pressure for a long period of time will cause excessive wear on the inside and outside edges of the tread because of the uneven contact between tyre and road.
Underinflated tyres also increase rolling resistance, which means the fuel efficiency of your car is reduced as it uses more power to make up for the resistance. If your tyres need a little more air, use a suitable pump, adding small amounts of air at a time.
OVER INFLATED TYRES
Overinflated tyres can really impact the handling of your car. Tyres with too much air in them have less contact with the road, which means you’ll have longer braking distances and less traction. They’ll also be more sensitive to impacts which can have a knock-on effect to the way your suspension handles.
You’re likely to find overinflated tyres have heavy and uneven wear across the central part of the tyre, and that irregular wear leads to a shorter tyre lifespan compared to correctly inflated tyres.
1. A LIST of various total weight of aircraft has studied and mentioned in above description
2. the difference between ground spped and air speed has mentioned above
3. Is it not recommended for the condtional air craft why it not necessary at airport mentioned
4. from the therotical expression has mentioned about pushed to runaway
5.A detailed report is mentioned about the take off power, tyre design, rolling resistance, tyre pressure, brake forces when landing
PART-B
A. With necessary assumptions, calculate the force and power required to push / pull an aircraft by a towing vehicle
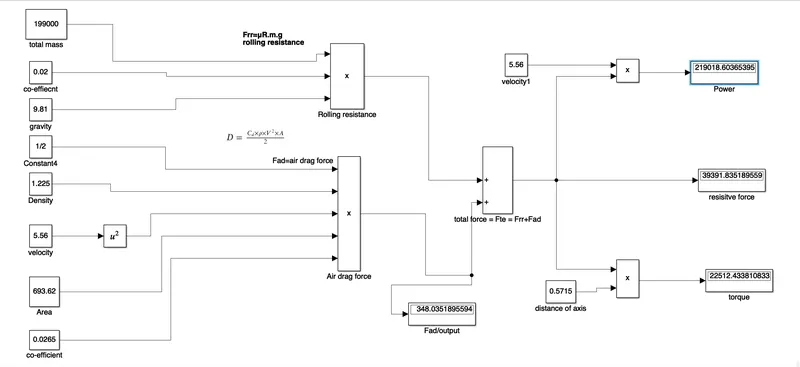
To find rolling resistance force:
Coefficient μR is defined by μR = /G
m=weight
g=gravity
Rolling resistance force =Frr=μR.m.g....................(1)
Total weight (m)= weight of the towing vehicle+weight of the airbus
(m) = 35000+164000 = 199000kg
susbistute the value in eq(1)
Rolling resistance force = Frr = (0.02 x 199000 x 9.81)
Frr = 39043.8 N
To find the air drag force:
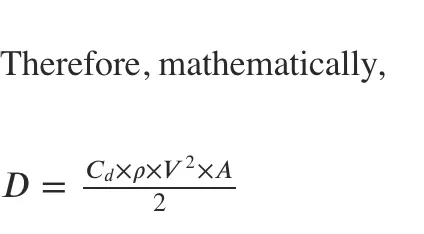
| D | Drag Force |
| 𝐶𝑑 | It is the drag coefficient |
| 𝜌 | It is the density of the medium in 𝑘𝑔𝑚^3 |
| V | It is the velocity of the body in 𝑚𝑠 |
| A | It is the cross-sectional area in m² |
p = 1.225 kg/m^3
Frontal area A = Height of the airbus * Width of the airbus
A = 15.80 * 43.90 = 693.62 m^2
Substituting the p and A values in drag force formula,
Assume that vehicle running at the speed of 20 kmph


Fad= 348.0351 N
Now find the total force = Fte = Frr+Fad
Fte=39043.8+348.0351
Fte=39391.835189 N
To find the power required by towing vehicle
Power=horsepower=speed. More horsepower means more speed.
Power required for towing vehicle Ptow = (Fte x v)= (39391.835189 x 5.56) = 219018.60365 W
By converting the unit of power we get,
Ptow = 219.018 KW
Torque= how much your vehicle can push/pull. More torque means more pulling/pushing power.
r = distance measured from the axis of rotation to where the linear force is applied
Torque (T) = (Fte x R) = (39391.835189 x 0.5715)=
Torque = 22512.4338 N-m
B. Develop the model for the calculated force and power using Simulink.
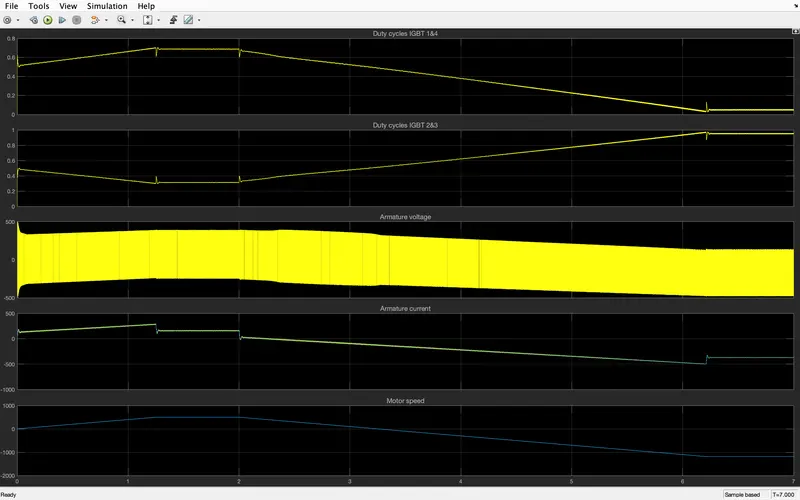
7. A. Design an electric powertrain with type of motor, it’s power rating, and energy requirement to fulfill aircraft towing application in Simulink. Estimate the duty cycle range to control the aircraft speed from zero to highest. Make all required assumptions. Prepare a table of assumed parameters. Draw a block diagram of powertrain.
(Hint :DC7 Block)
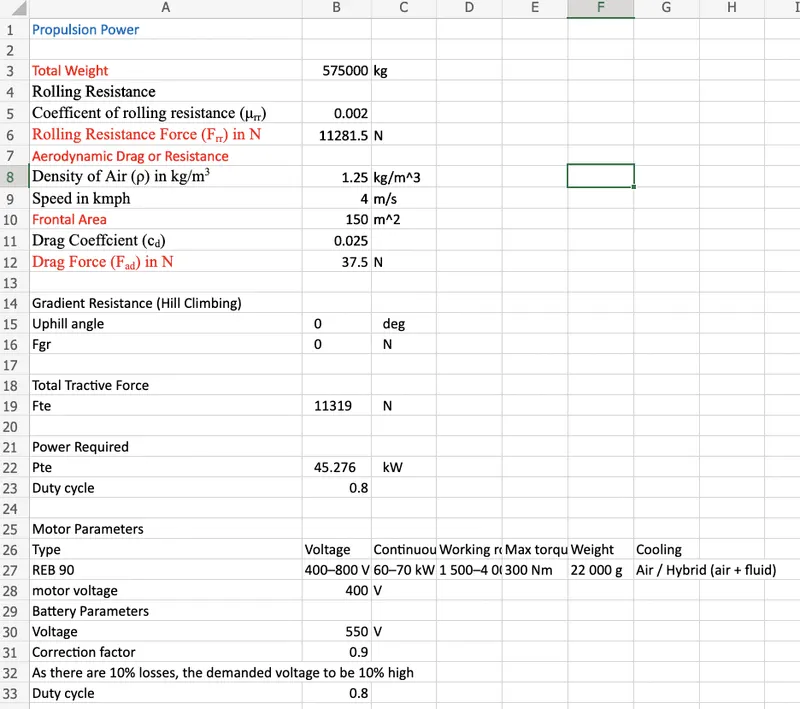
| Assumed Parameters | ||
| Mass of aircraft | 575000 | kg |
| Mass of the push back truck | 1000 | kg |
| Coefficient of Rolling Resistance | 0.002 | |
| Drag Coefficient | 0.025 | |
| Air density | 1.125 | kg/m13 |
| Frontal Area | 150 | m12 |
| Velocity | 4 | m/s |
| Uphill gradient | 0 | deg |
| Battery Voltage | 550 | V |
| Correction Factor | 0.8 |
BLOCK DIAGRAM OF THE SYSTEM:
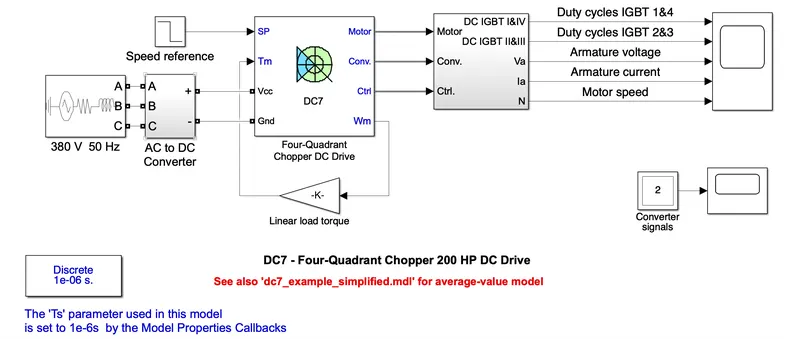 blocks used in simlink
DC7 chopper
step input
gain
scope
mux
OUTPUT:
B. Also, Design the parameters in excel sheet.
RESULT:
6. from the necessary data which were taken to calcualate the force and power required to push / pull an aircraft by a towing vehicle has reported
B. A simulink model is created for the above calculated force and power
7.A electric powertrain Designed with motor implemented and mentoned the and a paramenter table prepared and results is attached using DC7. Estimated the duty cycle range to control the aircraft speed from zero to highest. required assumptions.
(Hint :DC7 Block)
B. An excel sheet is submitted with parameters