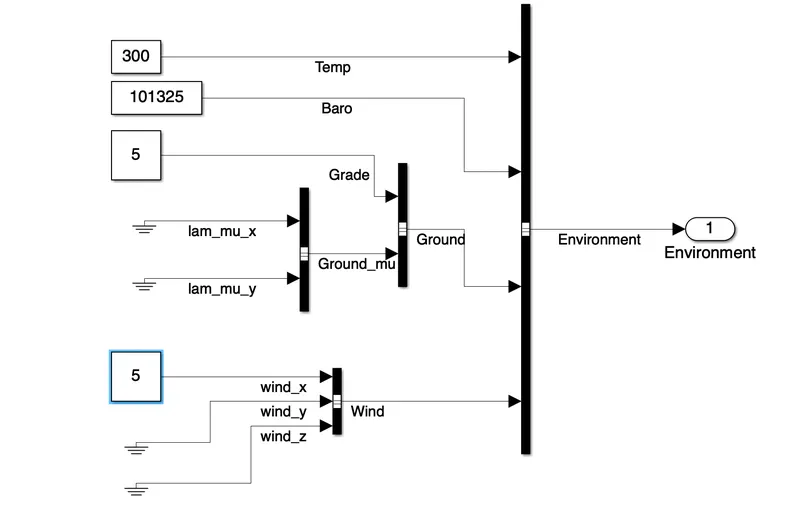
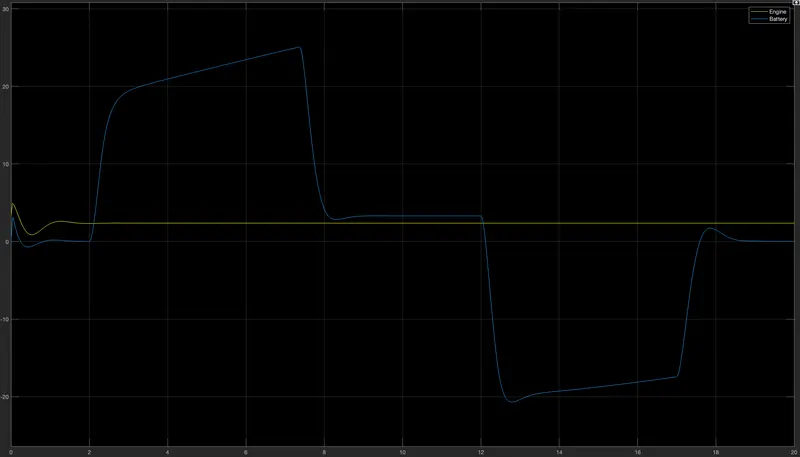
Week-4 Challenge WOT Condition Part-2
1)What is the difference between mapped and dynamic model of engine, motor and generator? How can you change model type
AIM:Showing difference between mapped & dynamic model of engine
|
Type |
Implementation |
When to Use |
|
|---|---|---|---|
|
Mapped |
|
Model uses a set of steady-state lookup tables to characterize engine performance. The tables provide overall engine characteristics, including actual torque, fuel flow rate, BSFC, and engine-out exhaust emissions. |
|
|
Dynamic |
|
Model decomposes the engine behavior into engine characteristics that are separated into lower-level components. By combining components in this way, the models capture the dynamic effects. |
|
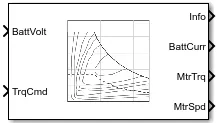
The Mapped Motor block implements a mapped motor and drive electronics operating in torque-control mode. The output torque tracks the torque reference demand and includes a motor-response and drive-response time constant. Use the block for fast system-level simulations when you do not know detailed motor parameters, for example, for motor power and torque tradeoff studies. The block assumes that the speed fluctuations due to mechanical load do not affect the motor torque tracking.
You can specify:
-
Port configuration — Input torque or speed.
-
Electrical torque range — Torque speed envelope or maximum motor power and torque.
-
Electrical loss — Single operating point, measured efficiency, or measured loss. If you have Model-Based Calibration Toolbox™, you can virtually calibrate the measured loss tables.
change model type
provides algorithms and functions for transforming geographic data and creating map displays. You can visualize your data in a geographic context, build map displays from more than 60 map projections, and transform data from a variety of sources into a consistent geographic coordinate system.
Mapping Toolbox supports a complete workflow for managing geographic data. You can import vector and raster data from a wide range of file formats and web map servers. The toolbox lets you process and customize data using trimming, interpolation, resampling, coordinate transformations, and other techniques. Data can be combined with base map layers from multiple sources in a single map display.
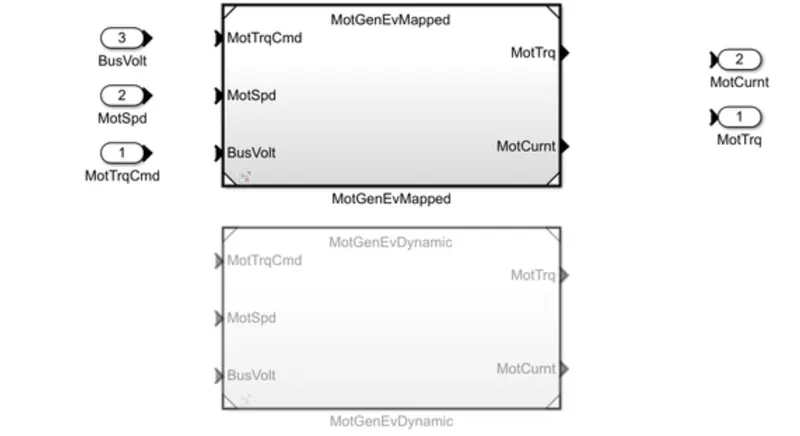
shifting from motor to generator
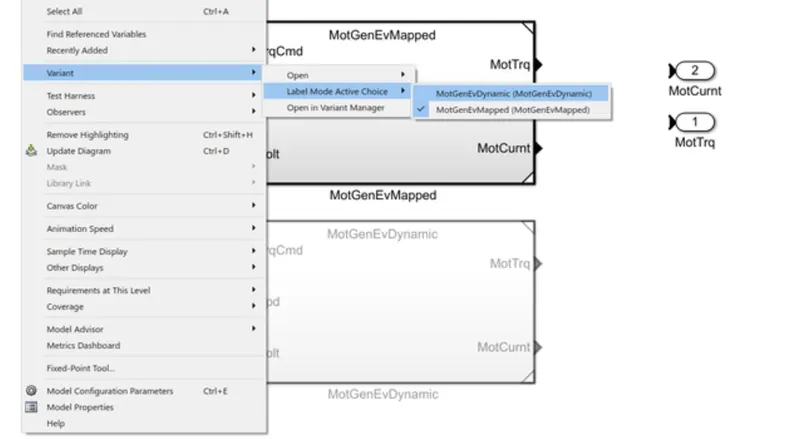
final interms of this case modified this plotted
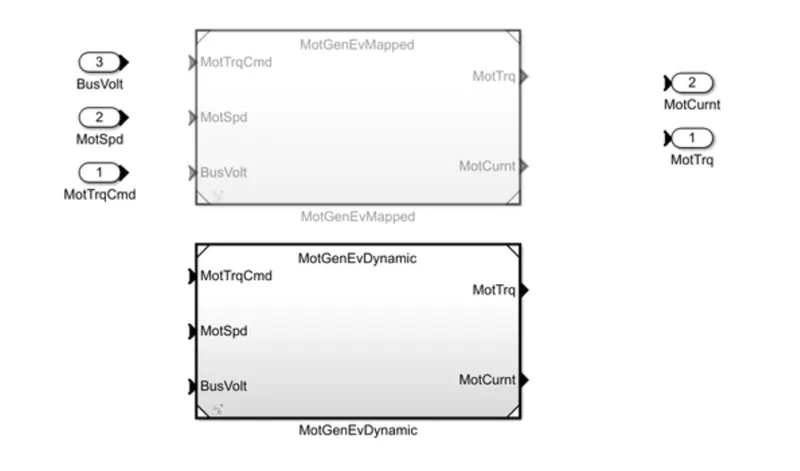
RESULT: between mapped and dynamic model of engine changing the model type motor and generator and the resulted images has been discussed
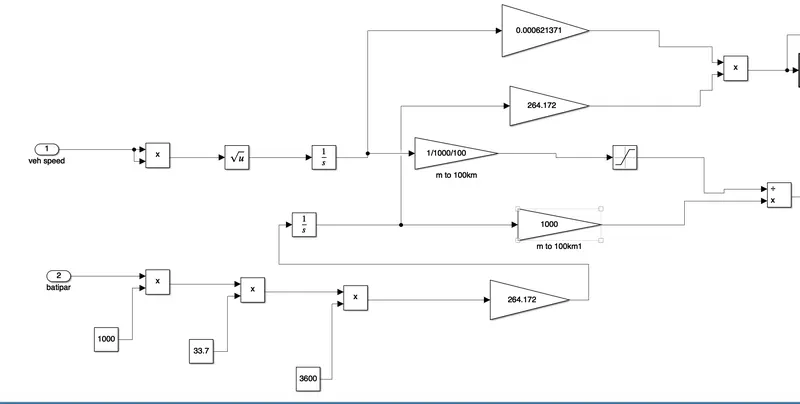
MPG) measurements for different makes and models of cars, grouped by country of origin (Origin), model year (Year), and other vehicle characteristics.Factor analysis was used to determine the underlying relationships between a number of measured variables and fuel consumption. Under the ‘free-flowing’ environment of the motorway route section, fuel consumption was primarily influenced by ambient pressure, vehicle speed and frequency of gear change. In suburban conditions, only throttle velocity made any significant contribution to fuel consumption. In the tests over urban sections, the significant variables were found to be vehicle speed and deceleration, frequency of gear change and ambient pressure. Of the ambient factors examined, only pressure had any significant independent effect. The associations derived from factor analyses point the way to realistic correction techniques for vehicle test data.
Regression models were constructed to fit the measured fuel consumption data to an expression derived to give fuel consumption as a function of engine, vehicle and environmental parameters. For purely urban, suburban and motorway travel and an overall journey based on a 50/40/10 per cent split of urban, suburban and motorway road types, 93.8, 92.4, 88.2 and 95 per cent of fuel consumption variance was explained by the respective regression models. Regression variables based on engine power correction factors for ambient temperature and humidity showed a degree of statistical significance in all models.
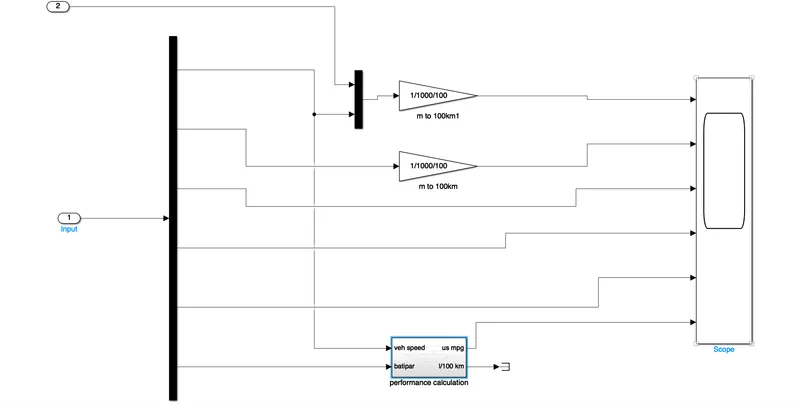
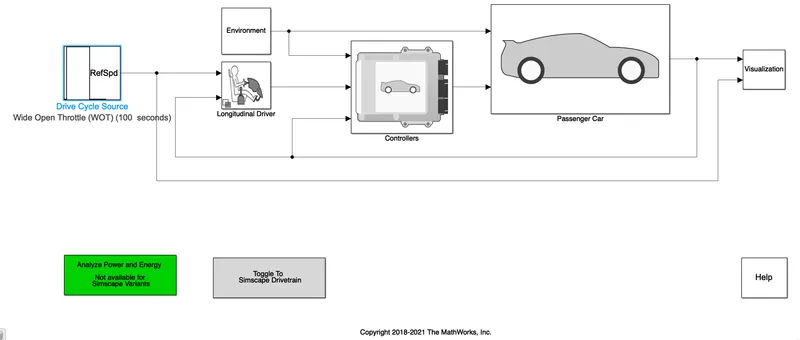
The Drive Cycle Source block generates a standard or user-specified longitudinal drive cycle. The block output is the specified vehicle longitudinal speed, which you can use to:
-
Predict the engine torque and fuel consumption that a vehicle requires to achieve desired speed and acceleration for a given gear shift reference.
-
Produce realistic velocity and shift references for closed loop acceleration and braking commands for vehicle control and plant models.
-
Study, tune, and optimize vehicle control, system performance, and system robustness over multiple drive cycles.
-
Identify the faults within tolerances specified by standardized tests, including:
-
EPA dynamometer driving schedules1
-
Worldwide Harmonised Light Vehicle Test Procedure (WLTP) laboratory tests2
-
For the drive cycles, you can use:
-
Drive cycles from predefined sources. By default, the block includes the
FTP–75drive cycle. To install additional drive cycles from a support package, seeThe support package has drive cycles that include the gear shift schedules, for exampleJC08andCUEDC. -
Workspace variables that define your own drive cycles.
-
.
mat, .xls, .xlsx, or .txtfiles. -
Wide open throttle (WOT) parameters, including initial and nominal reference speed, deceleration start time, and final reference speed.
To achieve the goals listed in the table, use the specified Drive Cycle Source block parameter options.