Project 1 - Parsing NASA thermodynamic data
Project 1: Parsing NASA thermodynamic data
Abstarct
In these project the MATLAB code is coded for parsing the NASA thermodynamic data about different species. In these each species is having 14 coefficients in which this coefficients are given to the forumlas for calculating the Enthalpy, Entropy and Specific heats. Each formulas is having this coefficients according to the temperature range coefficients need to be assigned on each formulas. Similarly for every species Enthalpy, Entropy and Specific heats need to be calculated. After this calculation Enthalpy, Entropy and Specific heats of every species need to be plotted and this plots need to be saved in each folder with the species name. The final step is to calculate the Molecular weight of each species and need to be showed as result.
Theory
DATA PARSING
It is method of converting one string of data into other categories of data based on user choice. It is also defined as input analysis to organize the data. Originally, parsing is essential because different entities need the data to be in different forms. Parsing permits transmute data in a way that can be acknowledged by a particular software. The universal example is programs -which are written by humans and executed by computers. Here, people scribe them in a form that they perceive , then a software transforms them in a way that can be used by a computer.
The official record of thermodynamic values at different temperatures has been stored by NASA in the form of polynomials with specified constants ranging from one to fourteen for various species. In order to quantify the values, the polynomials can be solved with defined temperature values in accordance with our requirements.
Governing Equations
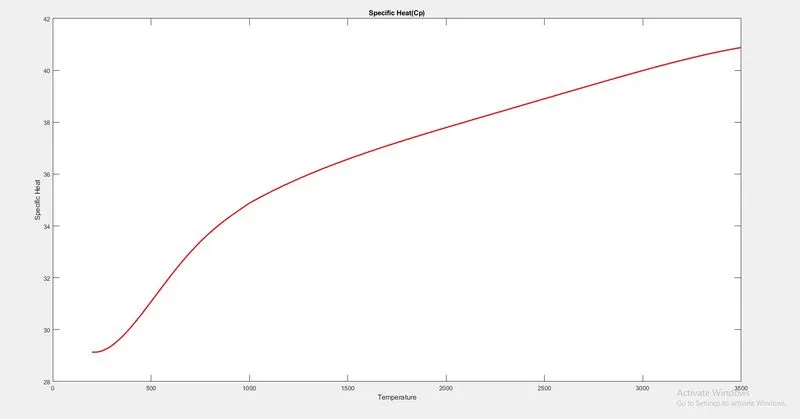
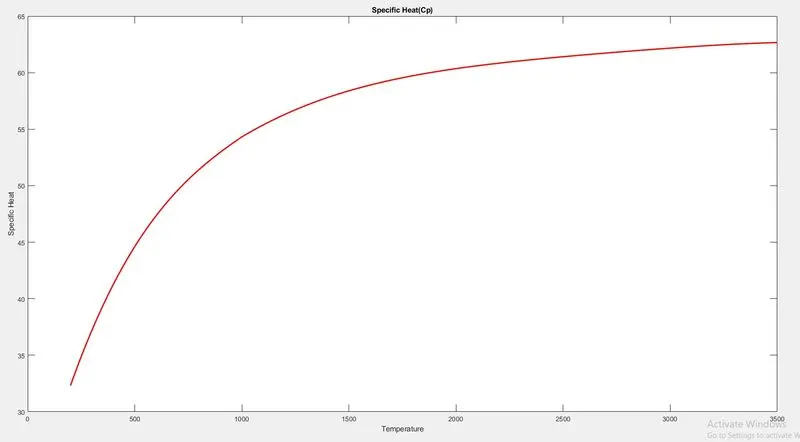
Specific Heat :Based on thermodynamics, the specific heat capacity of a substance is the heat capacity of a sample of the substance divided by the mass of the sample. In layman’s words, it is the amount of energy that must be added, in the form of heat, to one unit of mass of the substance in order to cause an increase of one unit in temperature.
`(Cp)/R = a1+a2*T+a3*T^2+a4*T^3+a5*T^4`
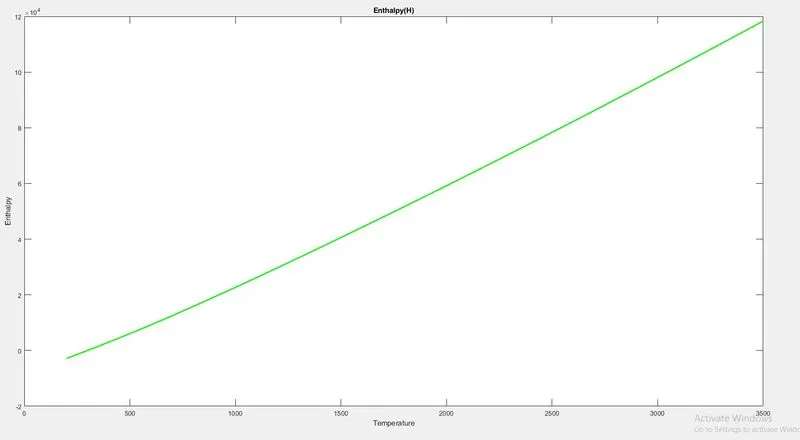
Enthalpy : It is a concept used in science and engineering when heat and work need to be calculated.If a substance changes at constant pressure at this juncture enthalpy tells how much heat and work was added or removed from the substance. Enthalpy is analogous to energy but not the similar . During the process of substance enlarging and shrinking , energy is consumed or released.
`(H)/(R*T) = a1+a2*(T/2) + a3*(T^2/2) + a4*(T^3/4) + a5*(T^4/5) + (a6)/T`
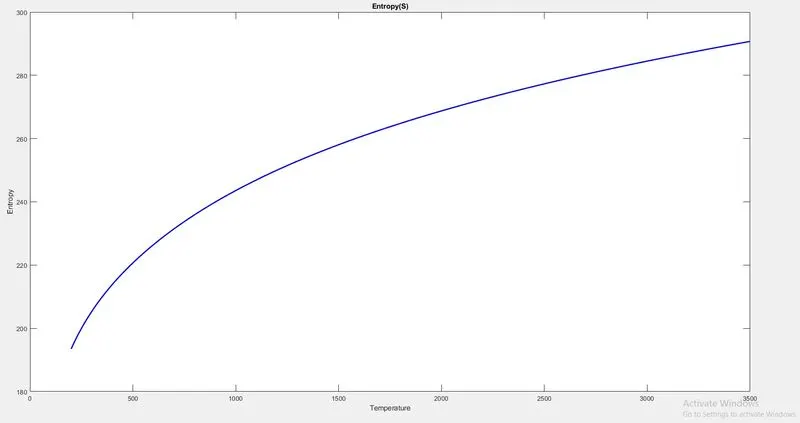
Entropy : It is defined as a measure of the amount of energy which is unavailable to do work. It is a measure of the number of possible arrangements of the atoms in a system that can have. So, it could be called as a measure of uncertainty or randomness.
`(S)/R = a1*ln*T + a2*T + a3*(T^2/2) + a4*(T^3/3) + a5*(T^4/4) + a7`
MATLAB code
clear all
close all
clc

%To open the data
f1= fopen('THERMO.dat','r')            %Opening the data file for reading the datas
fgetl(f1);

%Header Information
A = fgetl(f1);                         %Negelecting the first line

%Splitting the line
A = strsplit(A,' ' );                  %Splitting the next line of the data with space in between

%Reading the Global temperature
Global_low_temperature = str2num(A{end-2});
Global_mid_temperature = str2num(A{end-1});
Global_High_temperature = str2num(A{end-0});

%Negelecting next lines
for i = 1:3
    fgetl(f1);                         %Negelecing the next 3 lines in a loop
end

%To read the Species data and temperature
for j=1:53;                            %For 53 species
Cp=0;
H=0;
S=0;
t = fgetl(f1);                          %Negelecting the next line
temp = strsplit(t,' ');                 % Splits 1 line with space between
species_name = (temp{1});               %To display the species name from the data
Low_temperature = str2num(temp{end-3}); %To display the Low temperature from the data
High_temperature = str2num(temp{end-2});%To display the High temperature from the data
Mid_temperature = str2num(temp{end-1}); %To display the Mid temperature from the data

%To read the 1st set of coefficients
v1= fgetl(f1);
a = findstr(v1,'E');
a1 = v1(1:a(1)+3);
a1= str2num(a1);
a2= v1(a(1)+4:a(2)+3);
a2= str2num(a2);
a3= v1(a(2)+4:a(3)+3);
a3= str2num(a3);
a4= v1(a(3)+4:a(4)+3);
a4= str2num(a4);
a5= v1(a(4)+4:a(5)+3);
a5= str2num(a5);

%To read the 2nd set of coefficients
v2= fgetl(f1);
b = findstr(v2,'E');
a6 = v2(1:b(1)+3);
a6= str2num(a6);
a7= v2(b(1)+4:b(2)+3);
a7= str2num(a7);
a8= v2(b(2)+4:b(3)+3);
a8= str2num(a8);
a9= v2(b(3)+4:b(4)+3);
a9= str2num(a9);
a10= v2(b(4)+4:b(5)+3);
a10= str2num(a10);

%To read the 3rd set of coefficients
v3= fgetl(f1);
c = findstr(v3,'E');
a11 = v3(1:c(1)+3);
a11 = str2num(a11);
a12 = v3(c(1)+4:c(2)+3);
a12 = str2num(a12);
a13 = v3(c(2)+4:c(3)+3);
a13 = str2num(a13);
a14 = v3(c(3)+4:c(4)+3);
a14 = str2num(a14);

%Read the temperature array
Temperature=(Low_temperature:High_temperature);              %Assigning temperature from low to high
R=8.314;                                                     %Universal gas constant value
V=[a1 a2 a3 a4 a5 a6 a7 a8 a9 a10 a11 a12 a13 a14];          %Assigning all the coeffcients to Variable

i=1;

for T= (Low_temperature:High_temperature)                    %To setup the length of temperature

    if (T<=Mid_temperature)                                  %To compare if the temperaure range is less than mid temperature
        a1=V(8);
        a2=V(9);
        a3=V(10);
        a4=V(11);
        a5=V(12);
        a6=V(13);
        a7=V(14);
    else
        a1=V(1);
        a2=V(2);
        a3=V(3);
        a4=V(4);
        a5=V(5);
        a6=V(6);
        a7=V(7);
    end

    %Formulas to calculate Cp, H, S
    Cp(i) = ((a1) + (a2*T) + (a3*T^2) + (a4*T^3) + (a5*T^4))*R;
    H(i) = ((a1) + (a2*T/2) + (a3*T^2/3) + (a4*T^3/4) + (a5*T^4/5) + (a6/T))*R*T;
    S(i) = ((a1*log(T)) + (a2*T) + (a3*T^2/2) + (a4*T^3/3) + (a5*T^4/4) + (a7))*R;

    i=i+1;                                                   % Incrementing each values for temperature
end

%Creating folder for each species
mkdir (['E:\Matlab\NASA thermodynamic data\Species_',species_name]);

%Plotting the results
figure(1)
plot(Temperature,Cp,'linewidth',2,'color','r')
title('Specific Heat(Cp)')
xlabel('Temperature')
ylabel('Specific Heat')

figure(2)
plot(Temperature,H,'linewidth',2,'color','g')
title('Enthalpy(H)')
xlabel('Temperature')
ylabel('Enthalpy')

figure(3)
plot(Temperature,S,'linewidth',2,'color','b')
title('Entropy(S)')
xlabel('Temperature')
ylabel('Entropy')

% To save each species
saving = (['E:\Matlab\NASA thermodynamic data\Species_',species_name]);
cd(saving);
saveas(1,'Specific_heat')
saveas(2,'Enthaply')
saveas(3,'Entropy')

%Calculate the molecular weight
elems = ["H", "C", "N", "O", "S", "A"];
atomic_masses = [1.00797,12.011,14.0067,15.9994,32.06,39.948];
mw=0;
for i =1:length(species_name)

[num, status] = str2num(species_name(i));

if (status)
    mw=mw+(atomic_masses(n)*(num-1));

else

    for k=1:length(elems)

       if species_name(i)== elems(k)
           mw=mw+atomic_masses(k);
           n=k;
       end

    end
end
end
fprintf("Molecular weight of %s is : %f \n",species_name,mw)  %To print the molecular mass for each species

end
Step wise Explanation
clear all
close all
clc
This code is used to clear all the datas in workspace, command box and other figures
f1= fopen('THERMO.dat','r')
fgetl(f1);
This code is used to open the downloaded data and r is the command used to read the data
A = fgetl(f1); This code is used to negelect 1st line in the data file. In the data file the 1st line is "THERMO" which is removed
A = strsplit(A,' ' ); After removing the header the next line is shown with space in between. For spliiting the data strsplit is used and to have space ' ' is used.
Global_low_temperature = str2num(A{end-2});
Global_mid_temperature = str2num(A{end-1});
Global_High_temperature = str2num(A{end-0});
This commands are used to read the global temperatures from the data. In here str2num is used to convert string to number. In these after splliting the 2 nd line the value is calculated by subtracting the end values . By this value is taken to Global tempertures
for i = 1:3
    fgetl(f1);
end
This loop is used to neglect the 3 lines in the data
t = fgetl(f1);
temp = strsplit(t,' ');
species_name = (temp{1});
Low_temperature = str2num(temp{end-3});
High_temperature = str2num(temp{end-2});
Mid_temperature = str2num(temp{end-1});
In this commands fgetl will neglect the line and after that next line will be splitted. From that species name will be taken and temperature range for that species will be assigned to low temperature , middle temperature and high temperature
%To read the 1st set of coefficients
v1= fgetl(f1);
a = findstr(v1,'E');
a1 = v1(1:a(1)+3);
a1= str2num(a1);
a2= v1(a(1)+4:a(2)+3);
a2= str2num(a2);
a3= v1(a(2)+4:a(3)+3);
a3= str2num(a3);
a4= v1(a(3)+4:a(4)+3);
a4= str2num(a4);
a5= v1(a(4)+4:a(5)+3);
a5= str2num(a5);
Next step is to read the coefficents of next line in the species. The header details of species will be removed and after that next command is used to find the string "E" in the corresponding line. For finding the E string findstr is used. After finding the string the next command will give the value before E from the starting. For starting from the 1st '1' is used and after that a(1)+3 is used to add up the next 3 values. Then this value is converted to a number by using str2num.
For 2nd coefficient for getting the 1st value of 2nd coefficent a(1)+4 is used . This will avoid 1st coefficient value and started to read the 2nd coeffiecent value. The 2nd coeffiecent value ends to a(2)+3. From this the 2nd coefficent value will be assigned to a(2).
Same logic is used for next coefficients.
%To read the 2nd set of coefficients
v2= fgetl(f1);
b = findstr(v2,'E');
a6 = v2(1:b(1)+3);
a6= str2num(a6);
a7= v2(b(1)+4:b(2)+3);
a7= str2num(a7);
a8= v2(b(2)+4:b(3)+3);
a8= str2num(a8);
a9= v2(b(3)+4:b(4)+3);
a9= str2num(a9);
a10= v2(b(4)+4:b(5)+3);
a10= str2num(a10);
For reading the 2nd set of coefficents the 1st set of line of coefficents is removed by fgetl and after that above same step is used for reading the other set of coefficients.
%To read the 3rd set of coefficients
v3= fgetl(f1);
c = findstr(v3,'E');
a11 = v3(1:c(1)+3);
a11 = str2num(a11);
a12 = v3(c(1)+4:c(2)+3);
a12 = str2num(a12);
a13 = v3(c(2)+4:c(3)+3);
a13 = str2num(a13);
a14 = v3(c(3)+4:c(4)+3);
a14 = str2num(a14);
Similarly 3rd set of coefficents will be assigned to a11,a12,a13,a14.
All this coefficients and temperature are inside a for loop which is given to read all the species data coefficients and temperatures.
Temperature=(Low_temperature:High_temperature); Temperature=(Low_temperature:High_temperature);
R=8.314;
V=[a1 a2 a3 a4 a5 a6 a7 a8 a9 a10 a11 a12 a13 a14];
i=1;
for T= (Low_temperature:High_temperature)
if (T<=Mid_temperature)
a1=V(8);
a2=V(9);
a3=V(10);
a4=V(11);
a5=V(12);
a6=V(13);
a7=V(14);
else
a1=V(1);
a2=V(2);
a3=V(3);
a4=V(4);
a5=V(5);
a6=V(6);
a7=V(7);
end
%Formulas to calculate Cp, H, S
Cp(i) = ((a1) + (a2*T) + (a3*T^2) + (a4*T^3) + (a5*T^4))*R;
H(i) = ((a1) + (a2*T/2) + (a3*T^2/3) + (a4*T^3/4) + (a5*T^4/5) + (a6/T))*R*T;
S(i) = ((a1*log(T)) + (a2*T) + (a3*T^2/2) + (a4*T^3/3) + (a5*T^4/4) + (a7))*R;
i=i+1;
endIn the Temperature the range of temperature is defined inside array
All the coefficients are assigned to V
For incrementing every set i =1 ised and at end i =i+1 us used. After that inside for loop temperature range is defined. In the next command temperature is compared with mid temperature using if command. If the temperature is less than mid temperature the last 7set of coefficients is ised in the formula if it is more the 1st 7 set of coefficents is used in the governing equations.
So with this all the species, Specific heat , enthalpy and Entropy is calculated.
%Creating folder for each species
mkdir (['E:\Matlab\NASA thermodynamic data\Species_',species_name]);

%Plotting the results
figure(1)
plot(Temperature,Cp,'linewidth',2,'color','r')
title('Specific Heat(Cp)')
xlabel('Temperature')
ylabel('Specific Heat')

figure(2)
plot(Temperature,H,'linewidth',2,'color','g')
title('Enthalpy(H)')
xlabel('Temperature')
ylabel('Enthalpy')

figure(3)
plot(Temperature,S,'linewidth',2,'color','b')
title('Entropy(S)')
xlabel('Temperature')
ylabel('Entropy')

% To save each species
saving = (['E:\Matlab\NASA thermodynamic data\Species_',species_name]);
cd(saving);
saveas(1,'Specific_heat')
saveas(2,'Enthaply')
saveas(3,'Entropy')
In this mkdir is used to save the individual species data inside a folder. After that all the plots of species is given.
At last saveas is used to save the plot inside the source file of the corresponding species
%Calculate the molecular weight
elems = ["H", "C", "N", "O", "S", "A"];
atomic_masses = [1.00797,12.011,14.0067,15.9994,32.06,39.948];
mw=0;
for i =1:length(species_name)

[num, status] = str2num(species_name(i));

if (status)
    mw=mw+(atomic_masses(n)*(num-1));

else

    for k=1:length(elems)

       if species_name(i)== elems(k)
           mw=mw+atomic_masses(k);
           n=k;
       end

    end
end
end
fprintf("Molecular weight of %s is : %f \n",species_name,mw)  %To print the molecular mass for each species
This commands are used to calculate the molecular weight of each species. At first the molecular weigth and gas are assigned inside array.
Next a for loop is defined to run all the species molecular weigth. Inside the for loop by looking the status from the str2num(species_name) the if or else command is taken into account for calculating the molecular weight. In the for loop if the species is having number in the next command number will be updated in num.
For example if it is CO2, the molecular weigth of C is calculated from the else command and 1 value of O is calculated by same. But 2 O is there so for the second O value is calculated from the 1st If command. So whole value of CO2 is updated in mw which is printed by fprintf.
All this comands are inside a for loop so for the whole species it is calculated inside a for loop.
Errors Faced
On coding the each sections in this , i faced lot of issues in the variables i have assigned to get the results. And issues in the spelling of some variables.
Results
- Files saved for each species

- Plot for O2
- Plot for CO2
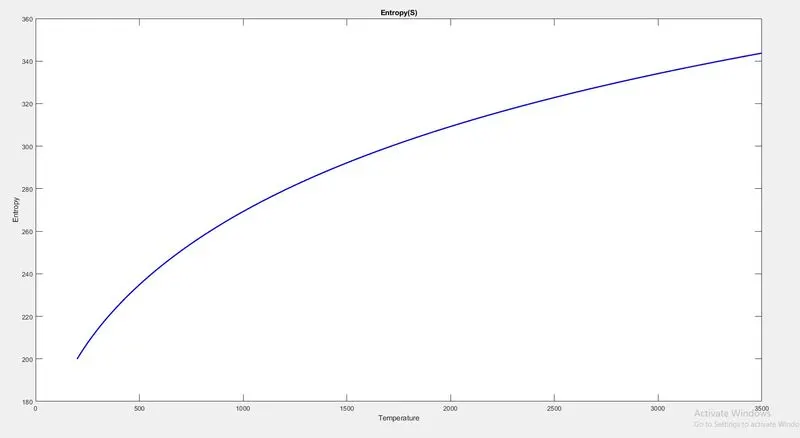
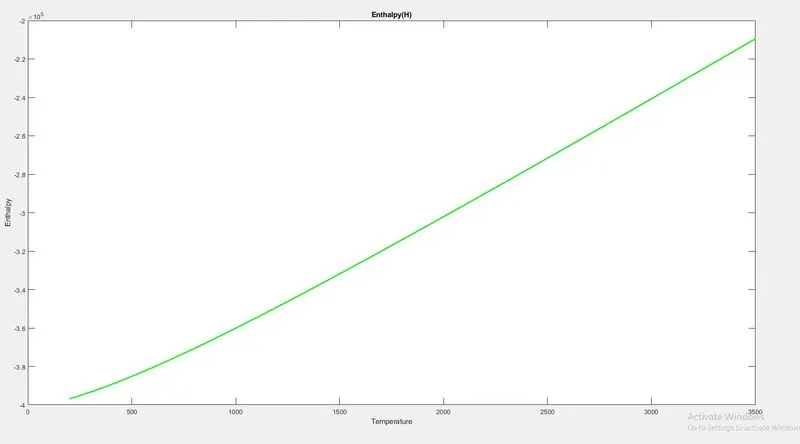
- Plot for N2
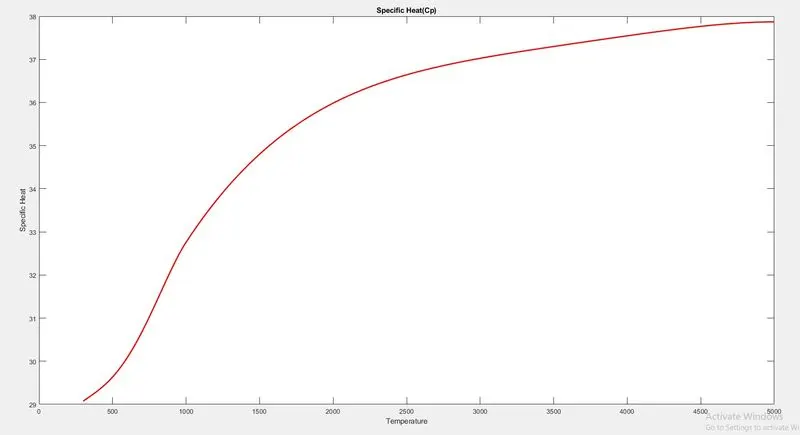
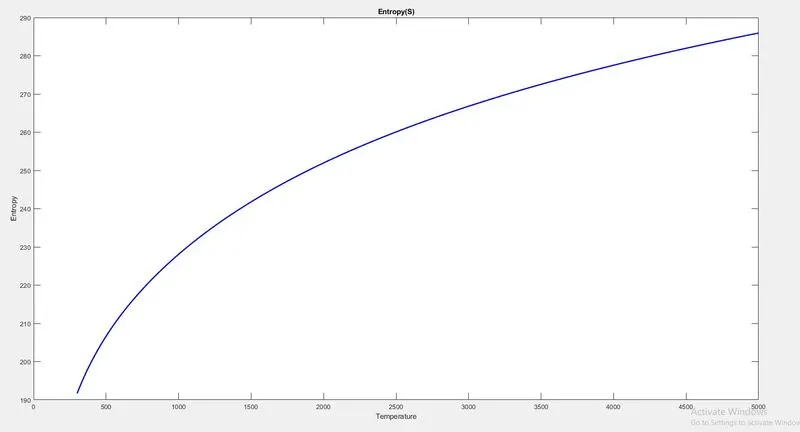
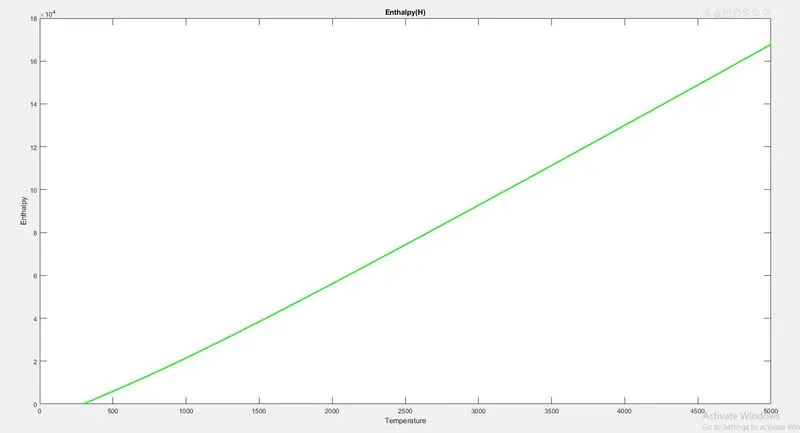
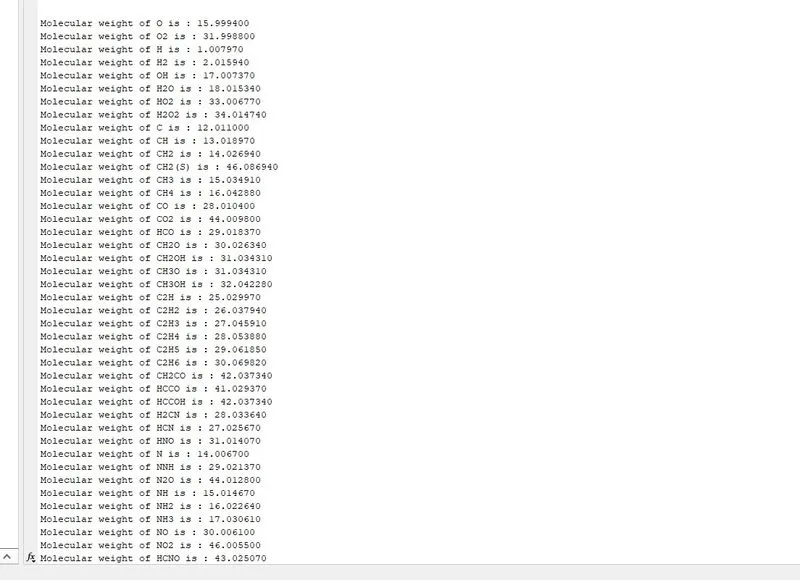
- Molecular weight of each species
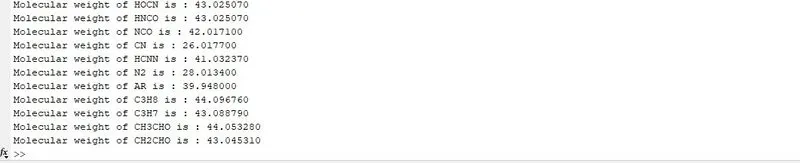
Conclusion
- Parsing of the file was done with the plot generation
- Plots for 53 species are generated
- All three plots(Cp, H, S) were saved in a folder for each species
- Molecular weight is generated for the 53 species in the command window