Project-1 [Frontal Crash]
OBJECTIVE
The main objective of frontal crash analysis of Neon BIW to know the force that recieved at different components of BIW like cross Rail , A pillar and Shot gun areas and to know the Intrusions on the Dash wall and acceleration recieved on the accelerometer
THEORY
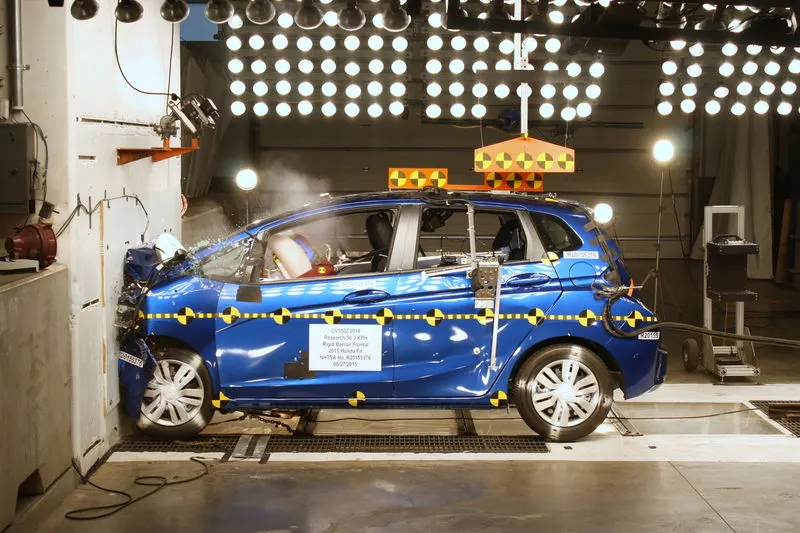
A crash test is a form of destructive testing usually performed in order to ensure safe design standards in crashworthiness and crash compatibility for various modes of transportation or related systems and components.Real crash test dummies, however, are true life-savers as an integral part of automotive crash tests. Even though cars get a little safer each year, and fatality rates are declining, car crashes are still one of the leading causes of death and injury in the United States.The dummy's job is to simulate a human being during a crash, while collecting data that would not be possible to collect from a human occupant.
The dummies contain three types of instrumentation:
- Accelerometers
- Load sensors
- Motion sensors
Accelerometers
These devices measure the acceleration in a particular direction. This data can be used to determine the probability of injury. Acceleration is the rate at which speed changes. The crash-test dummy has accelerometers all over it. Inside the dummy's head, there is an accelerometer that measures the acceleration in all three directions (fore-aft, up-down, left-right). There are also accelerometers in the chest, pelvis, legs, feet and other parts of the body.
Load Sensors
Inside the dummy are load sensors that measure the amount of force on different body parts during a crash.
Movement Sensors
These sensors are used in the dummy's chest. They measure how much the chest deflects during a crash.
CASE SETUP AND EXECUTION
1. Import the model by using the option import Solver deck
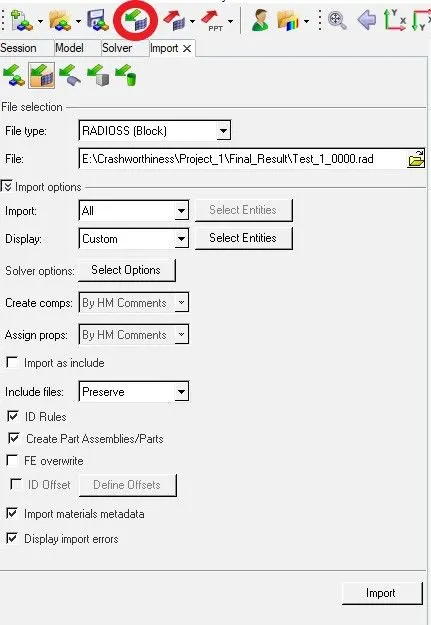
[Fig-1]
MODEL
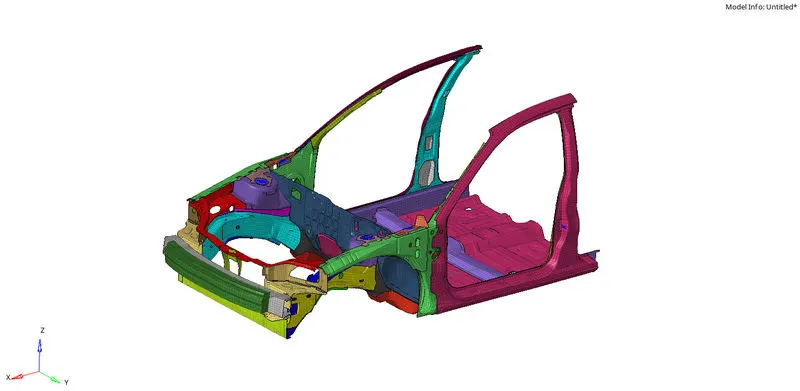
[Fig-2]
2. Check the unit system by following the Kg mm ms unit system for the whole process
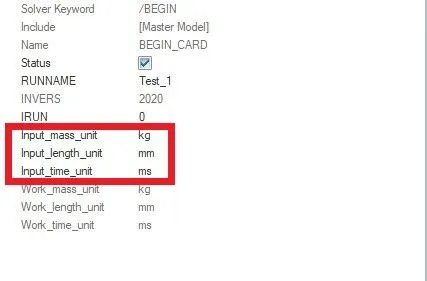
[Fig-3]
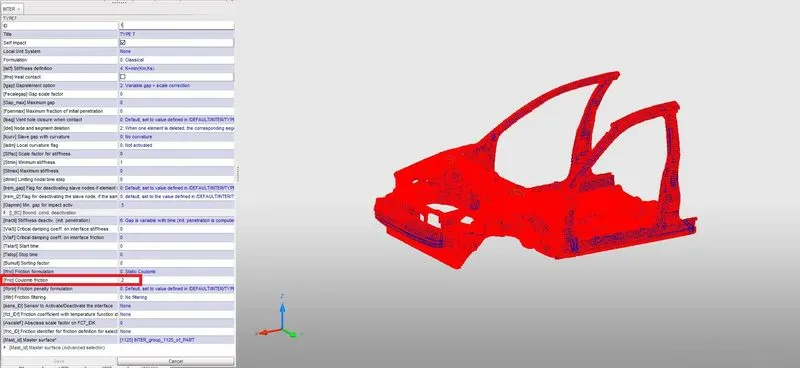
3. To create appropriate interface for the model with friction 0.2 by folllowing the recommended parameters
In this model some default interfaces are provided, this interface need to be deleted and input Type-7 Interface for the whole model, this can be done in Hypercrash
[Fig-4]
In Type-7 interface it is defined to be self impact which means the master and slave nodes are itself on the same body.
In the above list the recommended parameters for Type 7 interface are :
| Parameter | Description |
| Igap =2 | Set variable gap to take into account the true distance between parts |
| Gapmin `>=` 0.5mm | Specify minimum thickness of the model to avoid numerical issue. Typically half of the thinnest part |
| Inacti = 6 | Remove initial penetration possible where possible |
| Istf = 4 | Set stiffness of Interface based on the softer of master and slave |
| St min= 1Kn/mm | Specify a minimum stiffness in the contact to avoid too soft contact |
| Idel = 2 | Remove slave nodes from contact because of element deletion |
| Iform = 2 | Sliding force are computed using stiffness parameters of the interface. Usually results in bigger time step |
4. To check there is no penetrations and intersection on the model
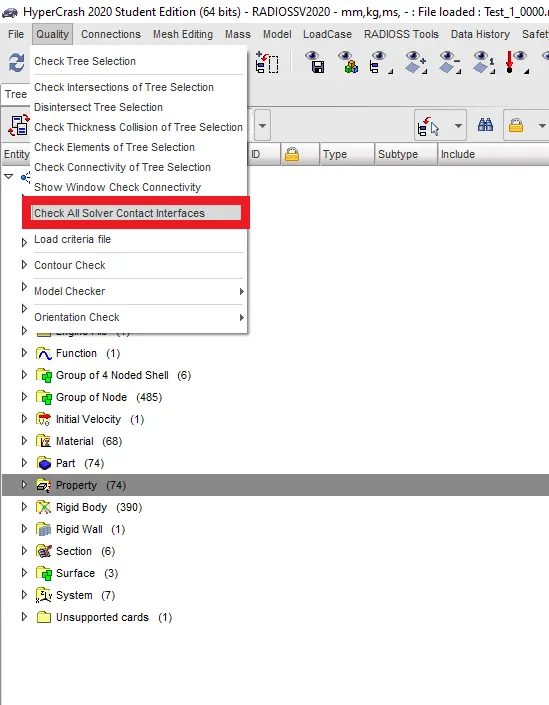
[Fig-5 : To check the penetration]
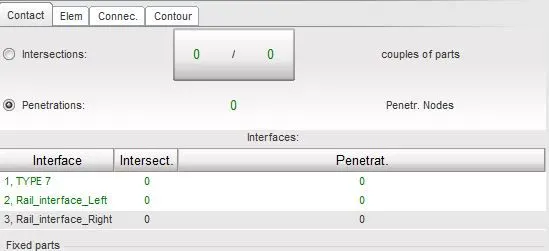
[Fig-6 : Penetration checked]
5. To create rigid wall :
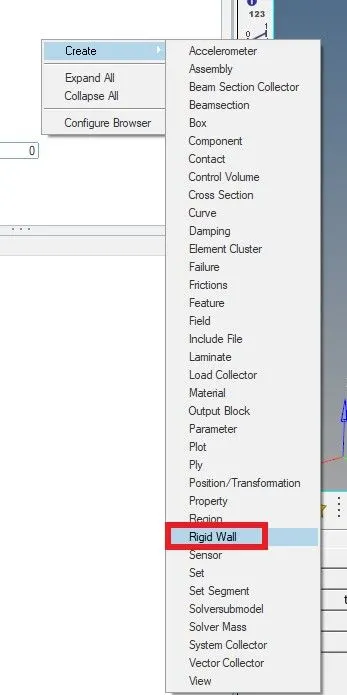
[Fig-7 : Rigid wall is created]
After setting up the Rigid wall the coordinates of the infinite plane need to be defined and normal need to setup and with friction 0.1
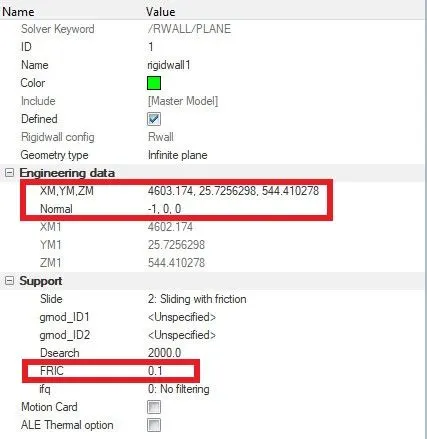
[Fig-8 : Rigid wall with all parameters are inputed]
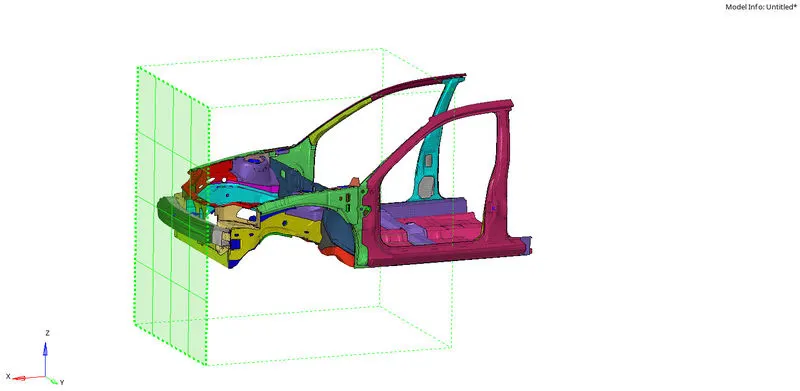
[Fig-9 : Rigid wall is created]
6. Add masses to reach target weight 700kg to set CG about the required range.
In this the center of Gravity need to be setup on the center of the whole model, so the mass need to be added and balance the CG at the center.
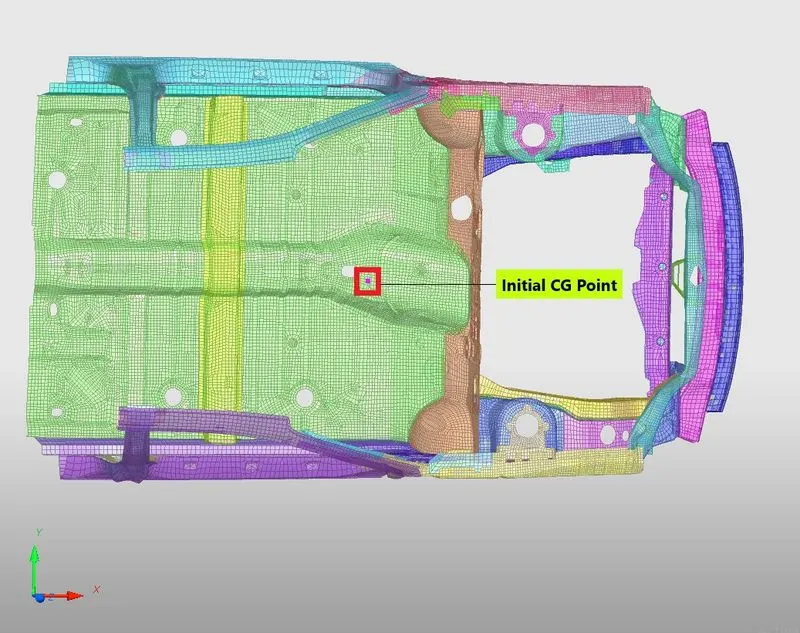
Fig:10
This is done in Hypercrash, in Hypercrash open the 2 tabs that is mass balancing and add mass. In mass balancing the total mass will be shown and Center of Gravity point is also visible. Initially the model has a weight of 188.42, so this mass need to be changed to 700kg. This is done in the tab Add mass and When adding the mass the CG should located at center of whole model.
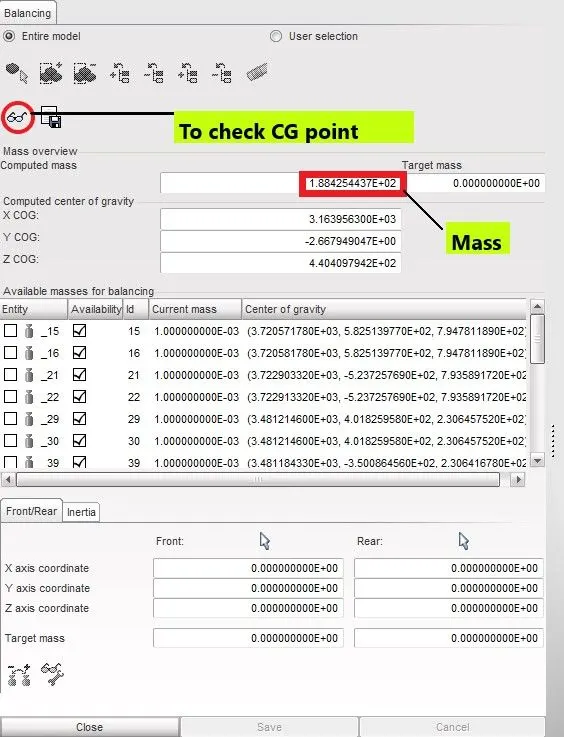
Fig:11
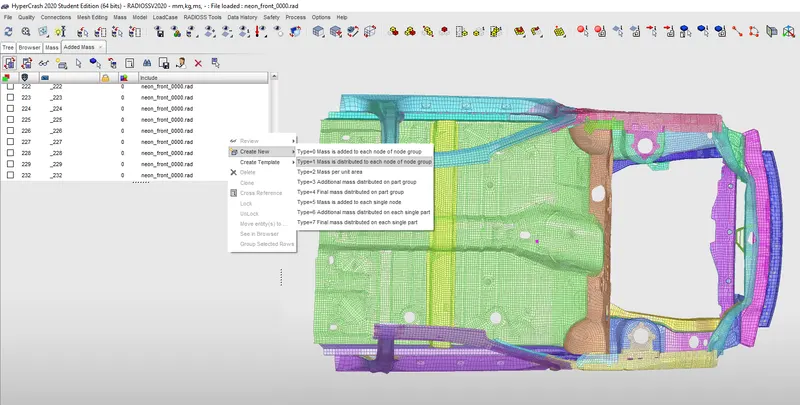
[ Fig:12 - Mass addition to the model ]
Adding mass means mass are created on some of the areas according to CG point, the mass will assigned based on that.
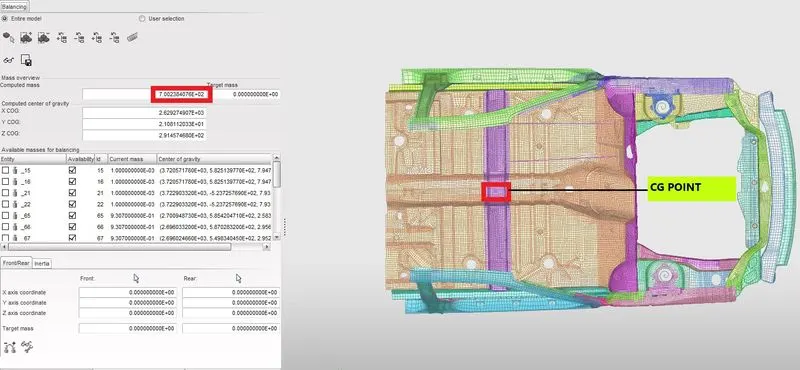
[Fig:13 - CG Point location after adding mass]
7. Initial velocity 35 mph
It is requied to create initial velocity in order to perform the crash. Generally the initial velocity value is given to be 35mph which is standard value according to the crash standards. In this the unit system that are followed in kg-mm-ms, so the value need to be changed with respect to the following unit system.
On conversion value becomes 15.64 mm/ms, so this value is applied in VX direction which is perpendicular to rigid wall.
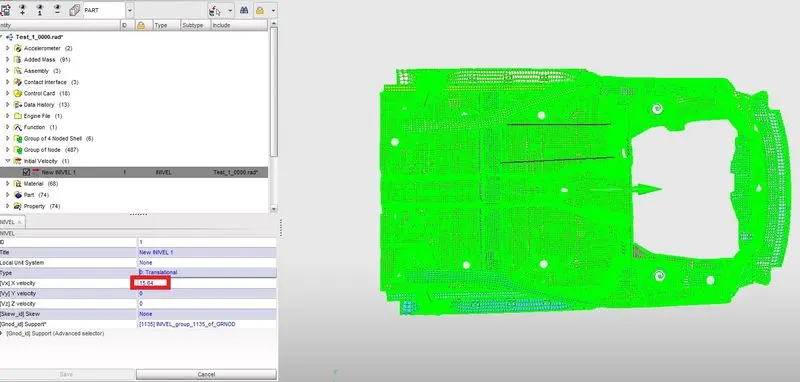
Fig:14
8. Time step and Run time
In the solver browser go to the Engine keyword , select Eng_DT_NODA and change Tmin to 0.0003 as time step. Whereas to setup the run time, under the Engine keyword select Eng_Run and change the T_stop value to 80.0.
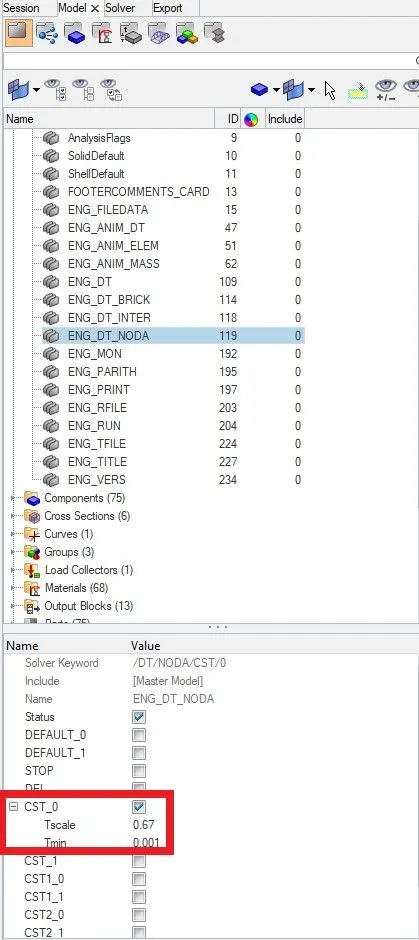
Fig:15
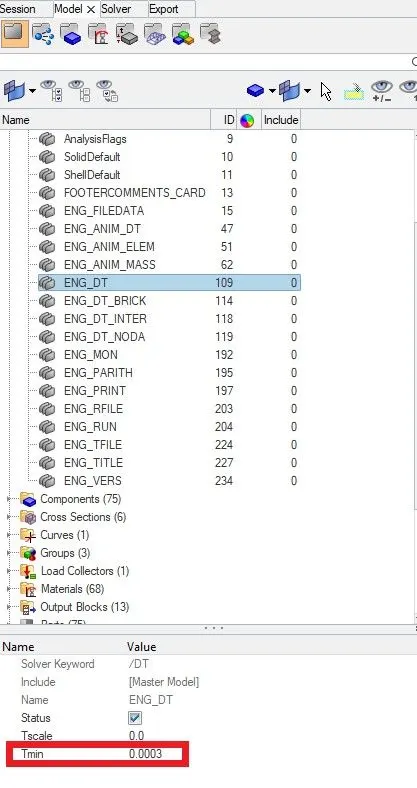
Fig:16
9. Sectional force in Right & Left Rail, Shotgun on 2 sides, A piller areas on 2 sides
The purpose of creating the section to understand how the force waves travels around a section. The section at different components a broad idea of peak force generated at a particular instant of time. This tool is very handy and helpful in understanding in depth about the simulation results.
To create section at Left rail:
* Open the section option using the solver -> create -> SECT -> SECT option
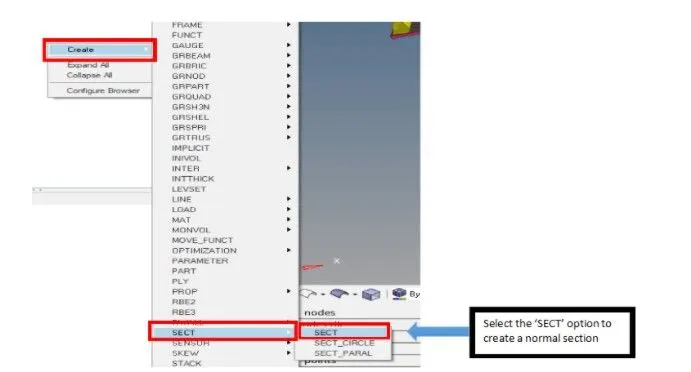
Fig:17
* Create a moving frame for the section. To create a moving frame solver -> create -> Frame -> MOV
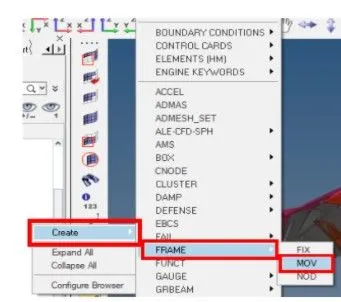
Fig:18
* Now go back to already created corss section. Select the Orgin node, Z axis direction and ZY plane.
* In the sect option , first select the frame that is already created and assign it to the section.
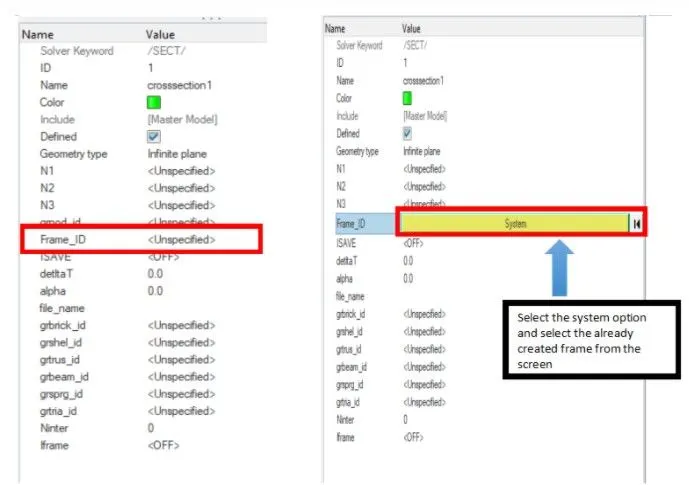
Fig:19
* Select the required shell elements in the Left rail area using the grshell_id option. Right click on it -> Create -> in the new dialogue box select the required elements by clicking on the entity id as elements
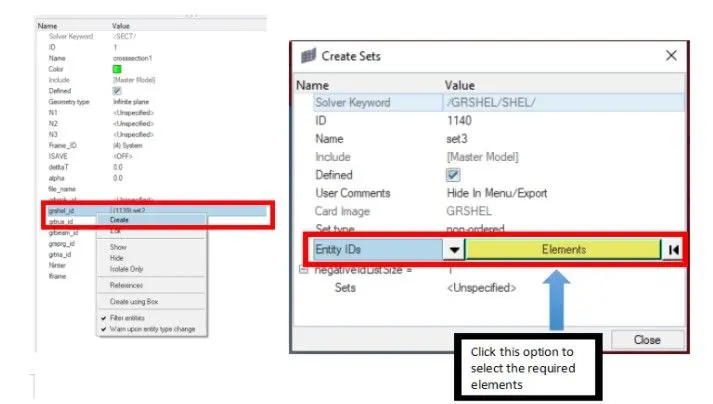
Fig:20
* Input the values for N1, N2, N3 from the seleced shell elements and input the value of Delta-T and alpha. Here the Delta-T value is 0.1 and alpha value is 1.67
Here the Delta-t is the time to start saving the section force data
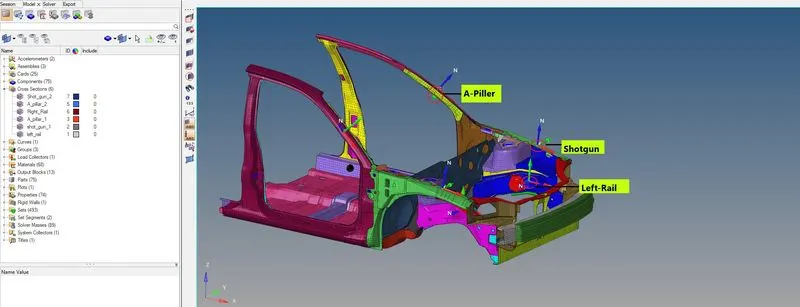
Fig:21
10. To get an Acceleration curve received on the accelerometer at base B pillar , go with click on solver-> Right click create -> Accelerometer
Accelerometer need to be created on both sides , for that respective nodes from both sides need to be selected.
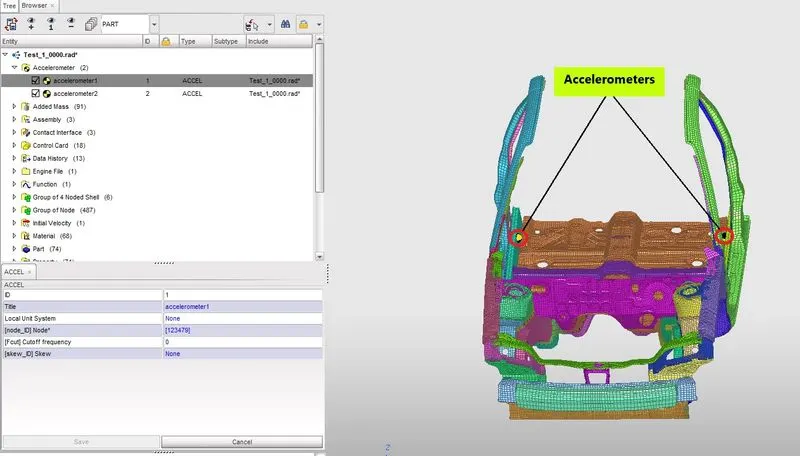
Fig:22
11. To create Intrusion on the dash wall
Intrusions on the dash wall need to be created at the locations 66695,66244. It is created to know how much area is displaced from the respective positions.
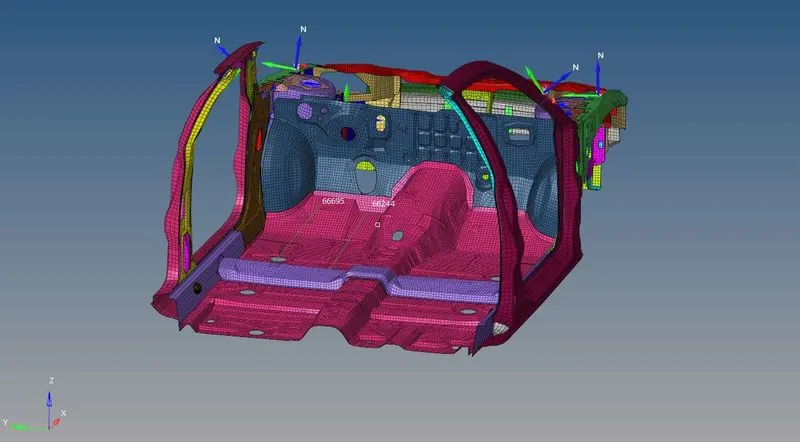
Fig:23
In these 2 opposite nodes are created and create an a spring connection between 2 nodes. So this is followed on the other 2 nodes which is created in the model.
RESULTS & DISCUSSIONS
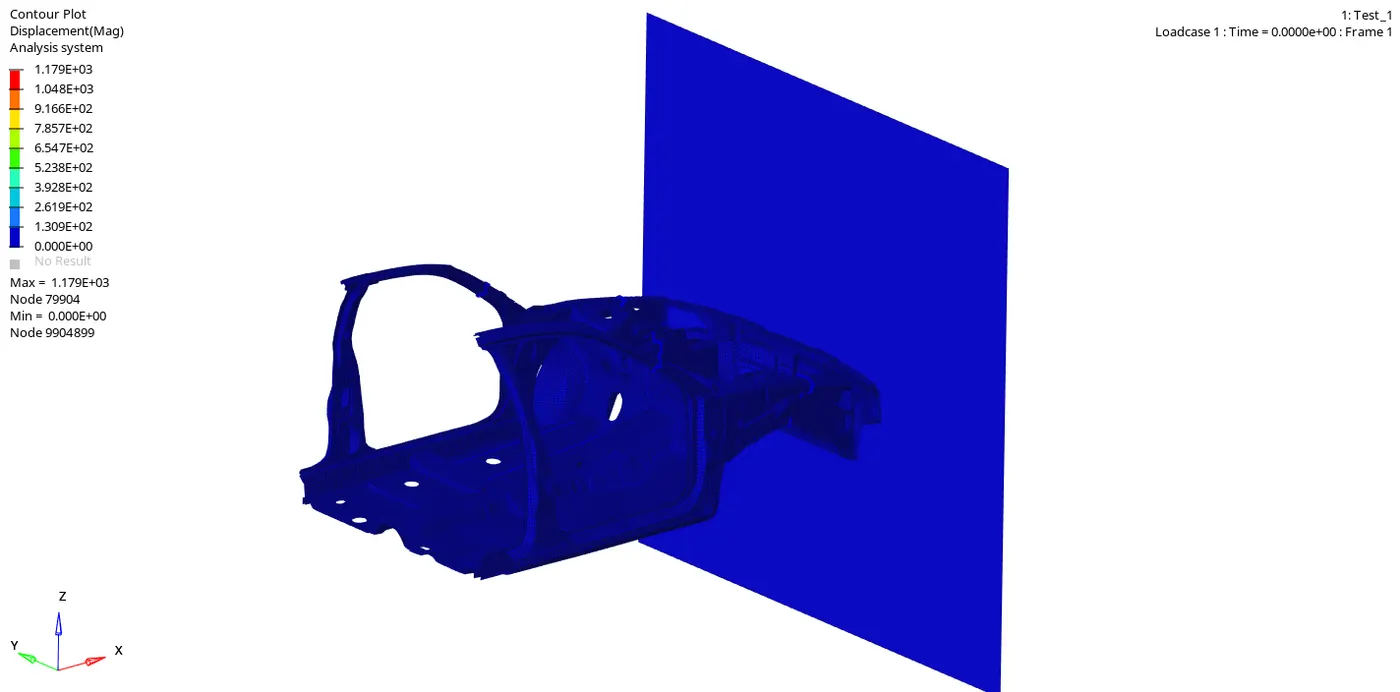
Simulation
Graph plot for Internal Energy and Kinetic Energy
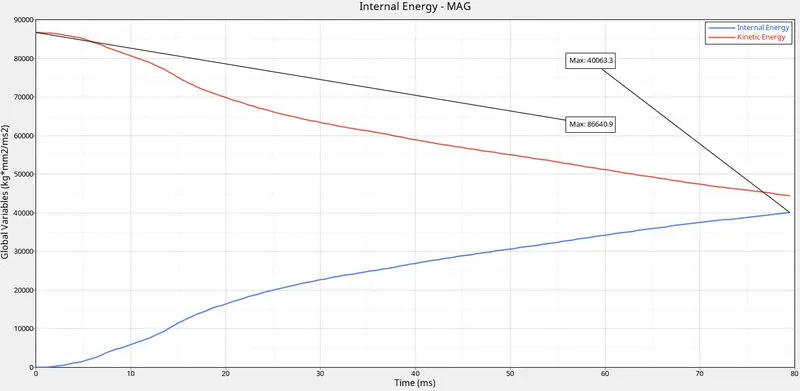
Fig:24
In this when the car collide with the rigid wall, a reaction force will generate from the wall which is the kinetic energy. This energy has huge amount of impact. If this force is taken by the passenger there is a chance of injury to passenger, inorder to overcome the injury the impact force is absorbed by the component itself. So if the component absorbed the energy the internal energy get increases. In the graph plot initially the Kinetic energy is higher and Internal energy is zero, after some time the Kinetic energy is converted to Internal energy.
Graph Plot for Axial force received on the rails from bumper
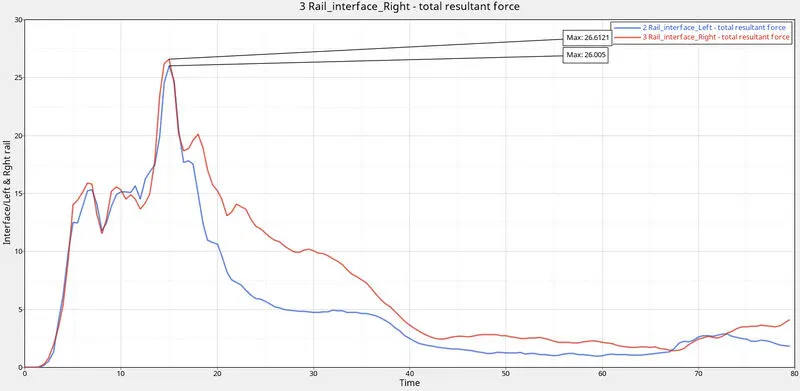
Fig:25
This graph gives the details about the difference in the force recieved from Bumber to Rail. Here the Bumber area is considered to be slave nodes and the rail area is taken as master nodes. The impact force that recieved from slave to master node is plotted.
In this graph the force plotted is not having much variations, for the left rail the maximum force recieved is 26.005 KN and for Right rail is 26.61 KN
Graph Plot for Section force recieved in Left rail and Rigth rail
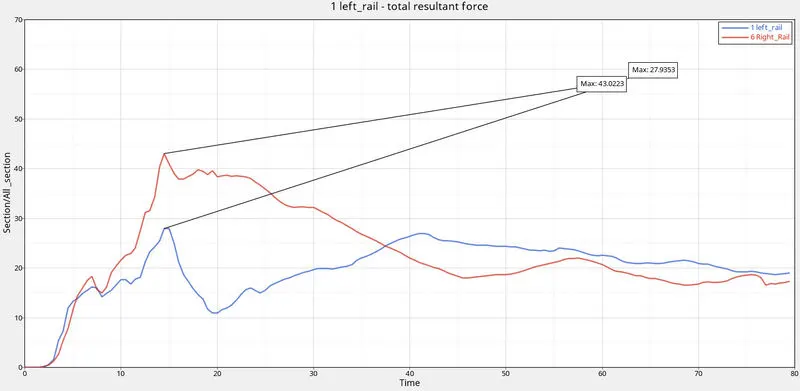
Fig:26
In this there is difference in the graph plotted for the right and left rail , the peak value in the Right rail is 43.022 KN and Left rail is 27.93 KN at 15 ms (approx). It is due to the design change in Right and left rail, ie in the right rail the hole position and number of hole is different from left. Due to this the deformation in both is diffferent.
Graph Plot for Section force recieved in Left and Right Shotgun area
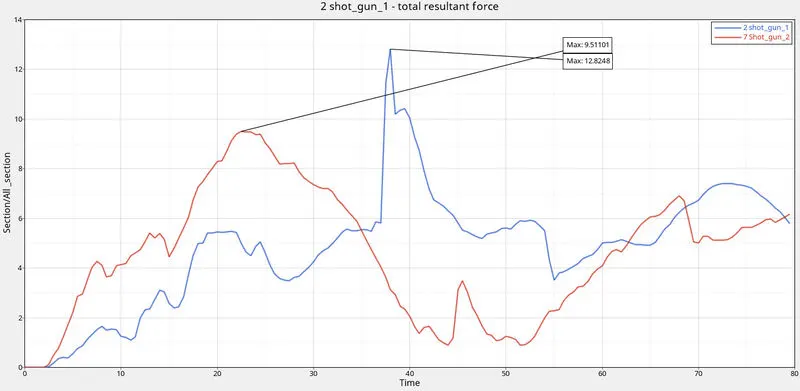
Fig:27
In this it plots the difference in sectional froce recieved in shotgun areas on both sides. The force flowing through Shotgun and Rails is diferent, the force in shotgun is less in comparison with the rails. The difference in force is due to structure design in Shotgun and Rails.
Here the maximum force in left shotgun area is 12.82 KN and Right shotgun area is 9.511KN.
Graph Plot for Section force recieved in Left and Right A Pillar area
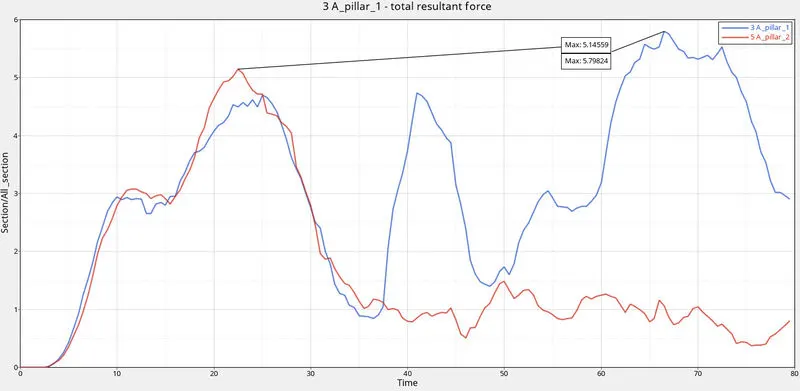
Fig:28
In this the graph is almost same up to 32ms (approx), after 32 ms the graph is changing. For Left hand A piller the maximum force is 5.798 KN and for Right hand A piller the maximum force is 5.145 KN.
Acceleration curve received on the accelerometer at base of B pillar
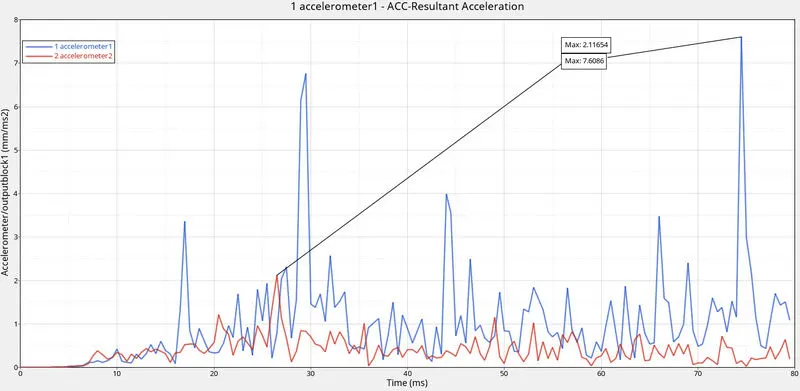
Fig:29
Accelerometers are used to measure the vibrations. It is carried out using change in the velocity with respect to time so that after the crash the change in velocity at particular node can be noted.
From the above graph the 1st accelerometer reaches maximum velocity of 7.608 mm/ms and for the 2 nd accelerometer that is in the right side of the vehicle reaches the maximum velocity of 2.11 mm/ms. It is due to in the left rail more energy is transfered from the rail to occupant seat area, whereas in right less energy is tranfered. That is why the accelerometer in right rail have not much changes in the graph compared with Left rail graph.
Intrusions on the dash wall 66695,66244
The main objective behind the Intrusion is to know the displacement of the front area of vehicle to Occupant area. So in this 2 spring are created at 66695 and 66244 with less mass and stiffness. The maximum displacement of spring can found by the compression of spring from initial position of vehcile to after the collision of vehicle.
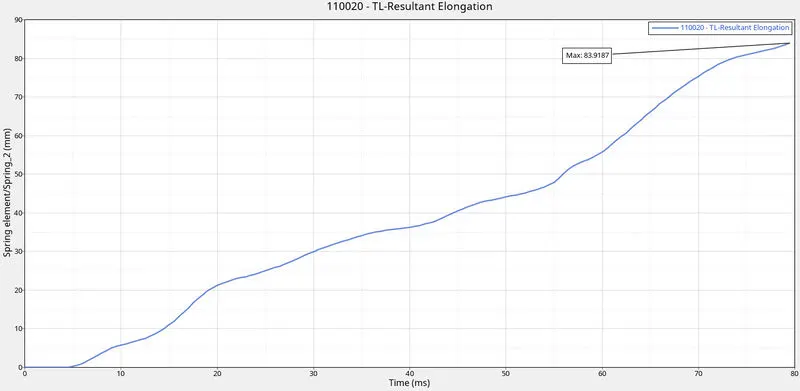
Fig:30
In this the spring elongation is 83.9187mm
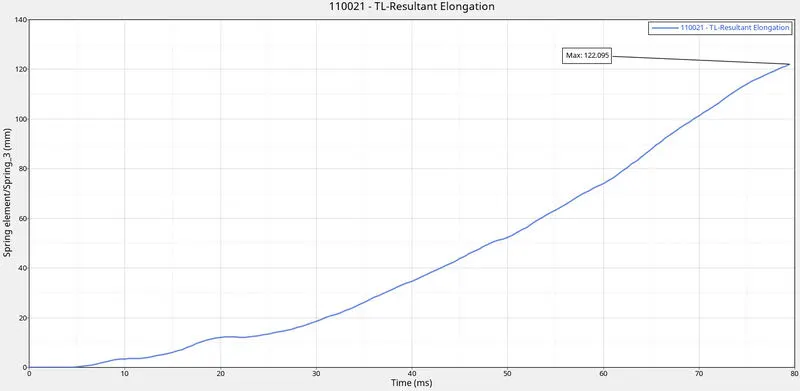
Fig:31
In this the spring elongation is 122.095mm
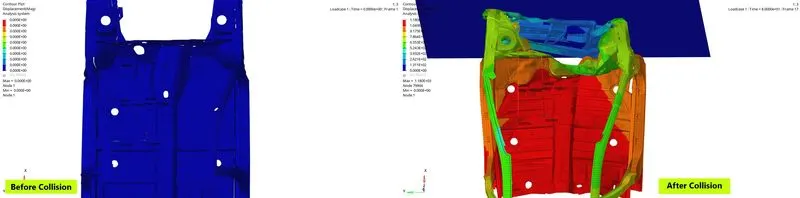
Fig:32
From the above figure the initial magnitude of 2 springs is 767.575 and 781.808 and after the collision the magnitude changes to 683.202 and 658.847.
CONCLUSION
In this frontal crash test the main objective is to know the behaviour of a car when hits with a wall, ie to know the forces that recieved in each components of car. So by doing this the user can understand the injury affected by occupant during real crashing of car. The results will be almost similar to real scenario. In this the simulation is shown to know how the components get deformed and the force recieved on components.