Project 1 - Parsing NASA thermodynamic data
AIM: To write a program to extract the coefficients and calculate the thermodynamic properties of various species in the data file.
GOVERNING EQUATIONS:
`C_p /R = a1+a2T+a3T^2+a4T^3+a5T^4`
`H/(RT) = a1+a2T/2+a3T^2/3+a4T^3/4+a5T^4/5+(a6)/T`
`S/R = a1lnT + a2T+a3T^2/2 + a4T^3/3+a5T^4/4+a7`
R is the universal gas constant
T is the temperature
Cp is the specific heat, H is the enthalpy and S is the entropy.
OBJECTIVE:
- Extract the 14 coefficients and calculate the enthalpy, entropy, and specific heats of all the species in the data file.
- calculate the molecular weight of each species.
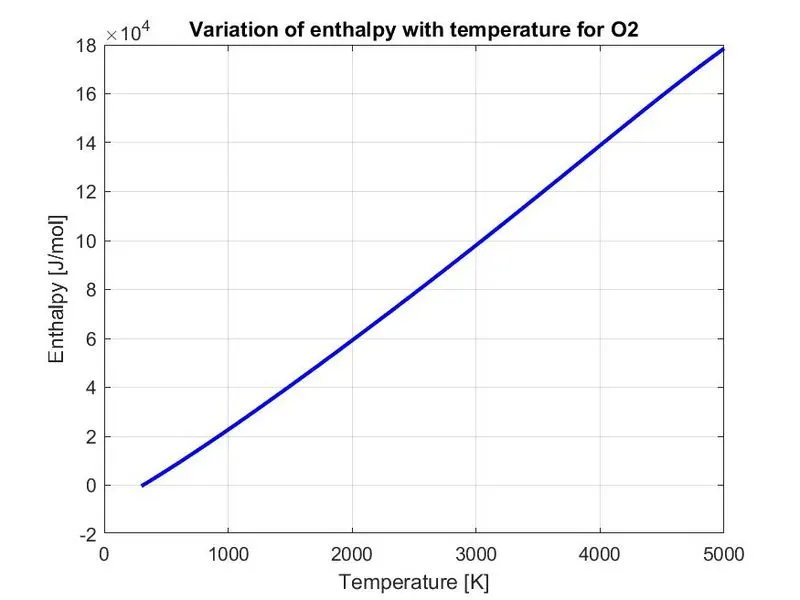
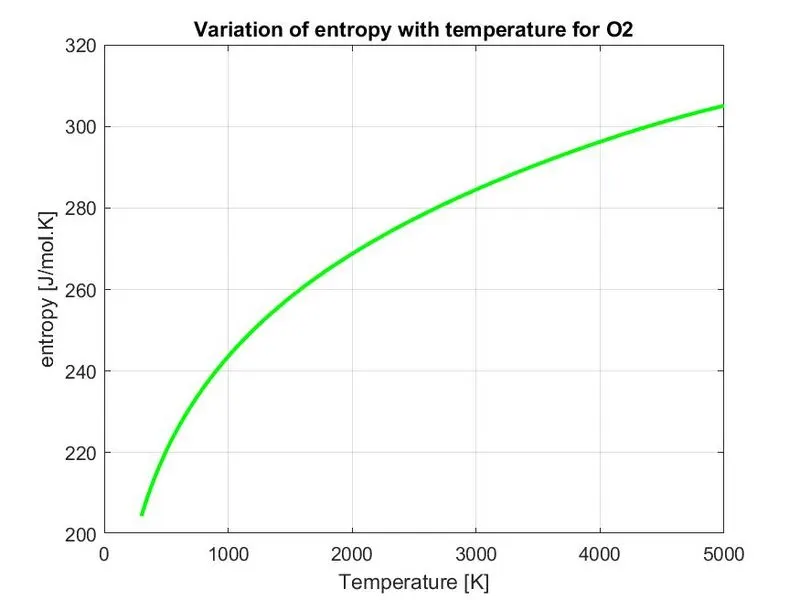
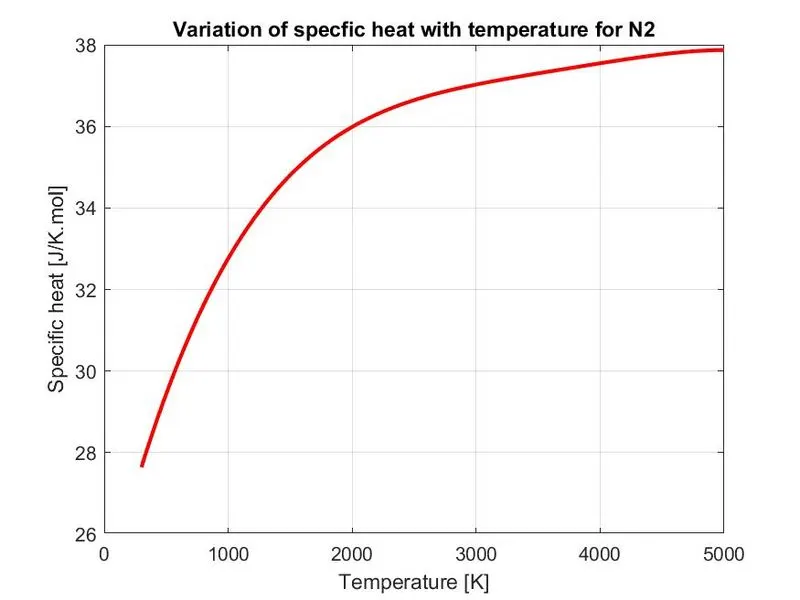
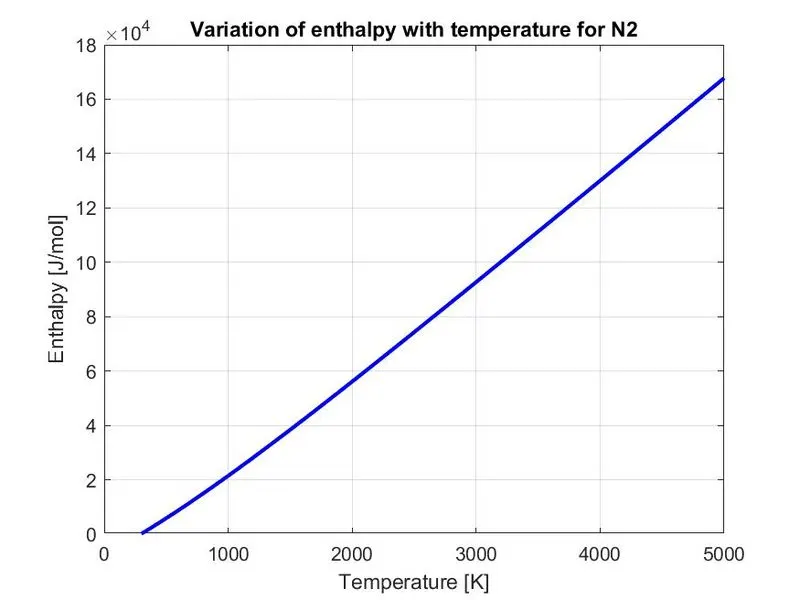
- plot the cp, H, S values against the temperature.
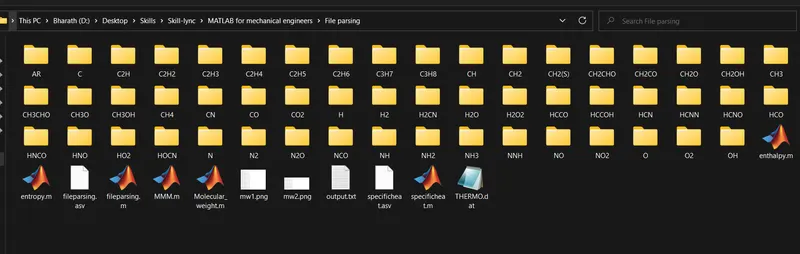
- save the plots as images and keep them in the folder automatically for each species.
File parsing: Parsing is the process of taking data in one format and transforming it into another format that is easily readable. In essence, the word parse means to divide something into parts to examine each part individually. you can take a sentence, split it into grammatical components, then identify them and their relations. To be more specific, it's about analyzing relationships between components in a given piece of data.
NASA has Compiled the polynomials that can be used to evaluate thermodynamic properties in the CHEMKIN file format. We have to parse the data by analyzing the pattern in which the data is presented and calculate the required thermodynamic properties.
Main code:
- Using fopen command, the data in the provided file can be made accessible.
- fgetl command is used the get the entire line. Either we can store it in a variable, for accessing the data or skip the not usable data.
- First, we used the fgetl command to skip the first line and then stored the second line in the l2 variable. The fgetl command returns the data in cell array format. Immediately the pattern is found, which is the space in the sentence, and then separate the array to store the data by converting them into the required format.
- Comments in the data files are also skipped.
- The main data is in format like species name, reference code, number of atoms, phase, and temperature ranges. The next 14 coefficients are arranged in the next three lines.
- Extracting the first line and splitting the line by identifying the spaces and storing the name of species and local temperature ranges in variables.
- Then assign all the coefficients to variables by finding the pattern in the coefficients format which is expressed in scientific notation 'E'. It should be noted that the values have to convert into number format from string format.
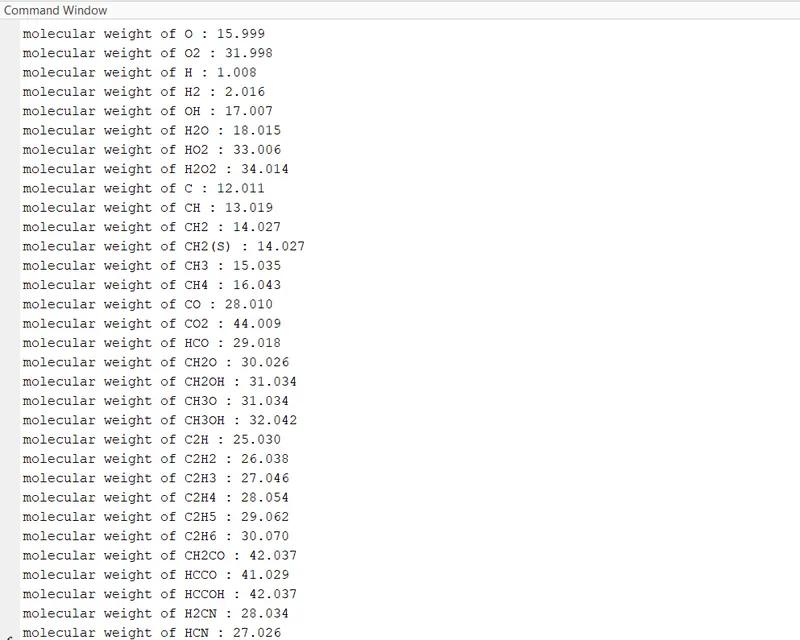
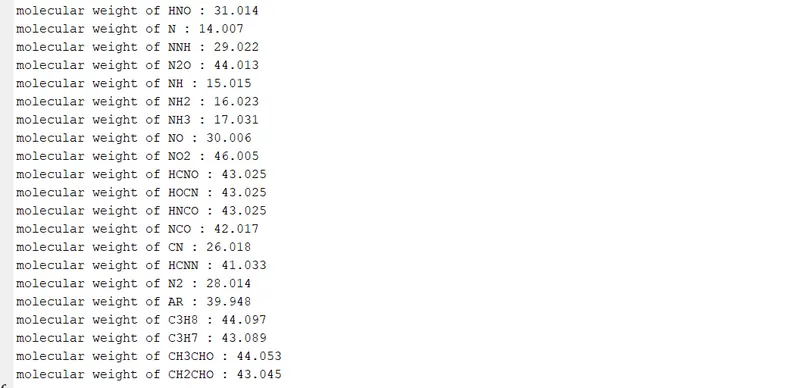
- call the functions for calculating the specific heat, enthalpy, and entropy. the molecular weight is also calculated and printed in the command window.
clear
close all
clc

%loading the thermodynamic data file
f1 = fopen('THERMO.dat','r'); % f1 is the file handler used to access data in the file
l1 = fgetl(f1);     %skipping the first line
l2 = fgetl(f1);
temp = strsplit(l2,' '); % extracting the global temperatures
global_low_temp = str2double(temp{2});
global_mid_temp = str2double(temp{3});
global_high_temp = str2double(temp{4});

T = linspace(global_low_temp,global_high_temp,1000);
R =8.314; %J/K.mol

%skipping the next three lines which are comments
l3 = fgetl(f1);
l4 = fgetl(f1);
l5 = fgetl(f1);

for i = 1:53
    tline = fgetl(f1);
    A = strsplit(tline,' ');
    Name_of_species = (A{1});
    lowtemp = str2double(A{end-3});
    midtemp = str2double(A{end-2});
    hightemp = str2double(A{end-1});

    line1 = fgetl(f1);
    a = strfind(line1,'E');
    a1 = line1(1:a(1)+3);
    a1 = str2double(a1);

    a2 = line1(a(1)+4:a(2)+3);
    a2 = str2double(a2);

    a3 = line1(a(2)+4:a(3)+3);
    a3 = str2double(a3);

    a4 = line1(a(3)+4:a(4)+3);
    a4 = str2double(a4);

    a5 = line1(a(4)+4:a(5)+3);
    a5 = str2double(a5);

    line2 = fgetl(f1);
    b = strfind(line2,'E');
    a6 = line2(1:b(1)+3);
    a6 = str2double(a6);

    a7 = line2(b(1)+4:b(2)+3);
    a7 = str2double(a7);

    a8 = line2(b(2)+4:b(3)+3);
    a8 = str2double(a8);

    a9 = line2(b(3)+4:b(4)+3);
    a9 = str2double(a9);

    a10 = line2(b(4)+4:b(5)+3);
    a10 = str2double(a10);

    line3 = fgetl(f1);
    c = strfind(line3,'E');
    a11 = line3(1:c(1)+3);
    a11 = str2double(a11);

    a12 = line3(c(1)+4:c(2)+3);
    a12 = str2double(a12);

    a13 = line3(c(2)+4:c(3)+3);
    a13 = str2double(a13);

    a14 = line3(c(3)+4:c(4)+3);
    a14 = str2double(a14);

    %calling functions to calculate the enthalpy, entropy and specific
    %heats
    cp = specificheat(a1,a2,a3,a4,a5,a6,a7,a8,a9,a10,a11,a12,a13,a14,T,R,global_mid_temp);
    H = enthalpy(a1,a2,a3,a4,a5,a6,a7,a8,a9,a10,a11,a12,a13,a14,T,R,global_mid_temp);
    S = entropy(a1,a2,a3,a4,a5,a6,a7,a8,a9,a10,a11,a12,a13,a14,T,R,global_mid_temp);

    %creating the folders
    current_directory = pwd;
    mkdir(Name_of_species)
    cd(Name_of_species)

    %plotting specific heat and temperature
    figure(1)
    plot(T,cp,'linewidth',2,'color','r')
    xlabel('Temperature [K]')
    ylabel('Specific heat [J/K.mol]')
    title(sprintf('Variation of specfic heat with temperature for %s',Name_of_species))
    grid on
    saveas(figure(1), 'specificheat.jpg')

    %Temperature and enthalpy
    figure(2)
    plot(T,H,'linewidth',2,'color','b')
    xlabel('Temperature [K]')
    ylabel('Enthalpy [J/mol]')
    title(sprintf('Variation of enthalpy with temperature for %s',Name_of_species))
    grid on
    saveas(figure(2), 'enthalpy.jpg')

    %Entropy and enthalpy
    figure(3)
    plot(T,S,'linewidth',2,'color','g')
    xlabel('Temperature [K]')
    ylabel('entropy [J/mol.K]')
    title(sprintf('Variation of entropy with temperature for %s',Name_of_species))
    grid on
    saveas(figure(3), 'entropy.jpg')
    cd(current_directory)

    %calling fuction to calculate the molecular weight
    Molecularweight = Molecular_weight(Name_of_species);
end
Function for Specific heat
function cp = specificheat(a1,a2,a3,a4,a5,a6,a7,a8,a9,a10,a11,a12,a13,a14,T,R,global_mid_temp)

%function for calculatig specific heat

%if the local temperature if lower then take second 7 coefficients
%else take first 7 coefficients
if T<=global_mid_temp
    cp = R*(a8 + a9*T + a10*T.^2 + a11*T.^3 + a12*T^4);
else
    cp = R*(a1 + a2*T + a3*T.^2 + a4*T.^3 + a5*T.^4);

end
Function for enthalpy
function H = enthalpy(a1,a2,a3,a4,a5,a6,a7,a8,a9,a10,a11,a12,a13,a14,T,R,global_mid_temp)

%function for calculatig enthalpy

%if the local temperature if lower then take second 7 coefficients
%else take first 7 coefficients
    if T<=global_mid_temp
        H = R*T.*(a8 + ((a9*T)/2) + (a10*(T.^2)/3) + ((a11*(T.^3))/4) + ((a12*(T.^4))/5) + (a13./T));
    else
        H = R*T.*(a1 + a2*T/2 + a3*(T.^2)/3 + a4*(T.^3)/4 + a5*(T.^4)/5 + a6./T);
    end

end
Function for entropy
function S = entropy(a1,a2,a3,a4,a5,a6,a7,a8,a9,a10,a11,a12,a13,a14,T,R,global_mid_temp)

%function for calculatig entropy

%if the local temperature if lower then take second 7 coefficients
%else take first 7 coefficients
    if T<=global_mid_temp
        S = R*(a8*log(T) + a9*T + a10*T.^2/2 + a11*T.^3/3 + a12*T.^4/4 + a13);
    else
        S = R*(a1*log(T) + a2*T + a3*T.^2/2 + a4*T.^3/3 + a5*T.^4/4 + a7);
    end
end
Function for Molecular weight calculation
function Molecularweight = Molecular_weight(Name_of_species)
    atomic_name = ['H','C','O','N','A']; %declaring the elements in the file
    atomic_weight = [1.008 12.011 15.999 14.007 39.948]; %the atomic weights in the sequence of the atomic names
    Molecularweight = 0;

    %loop for calulating the molecualar weight
    for i = 1:length(Name_of_species)
        for j = 1:length(atomic_name)
            if strcmpi(Name_of_species(i),atomic_name(j))
                %using the strcmpi for comparing the elements in the name
                %it is case insensitive
                Molecularweight = Molecularweight + atomic_weight(j);
                u = j;
            end
        end
            n = str2num(Name_of_species(i));

            if n>1
                Molecularweight = Molecularweight + atomic_weight(u)*(n-1);
            end
    end
        fprintf('molecular weight of %s : ' , Name_of_species)
        fprintf('%.3f\n',Molecularweight)
end
In the functions for specific heat, enthalpy, and entropy the values are given as input arguments while calling the function are used in the calculation. using if loop and the equations provided the values are calculated for low-temperature ranges or high-temperature ranges.
While in the molecular weight function, first the atomic names and their weights are declared in the arrays. then using the for loop and comparison of the atomic names and species names we are identifying the elements and their number in the species. We are calculating the molecular weight and then printing it in the command window.
Final results:
Screenshots of molecular weight are printed in the command window for particular species.
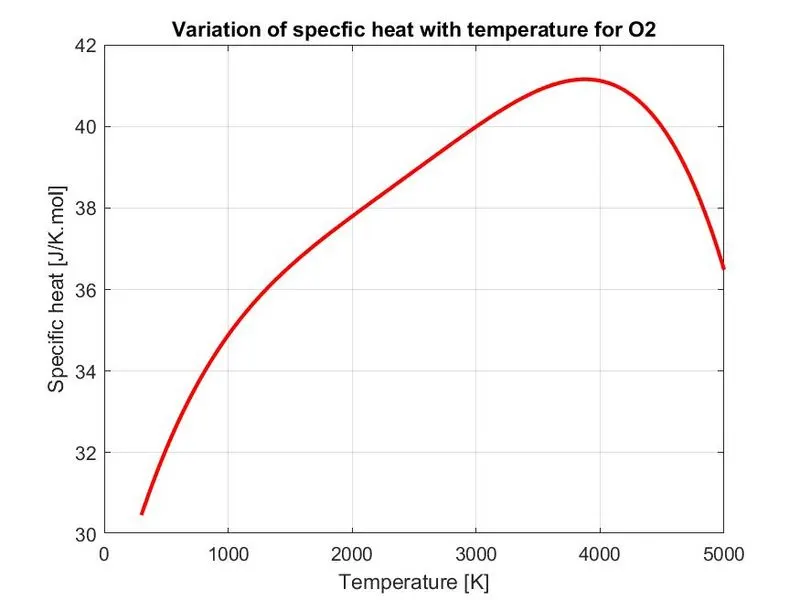
Plot for O2
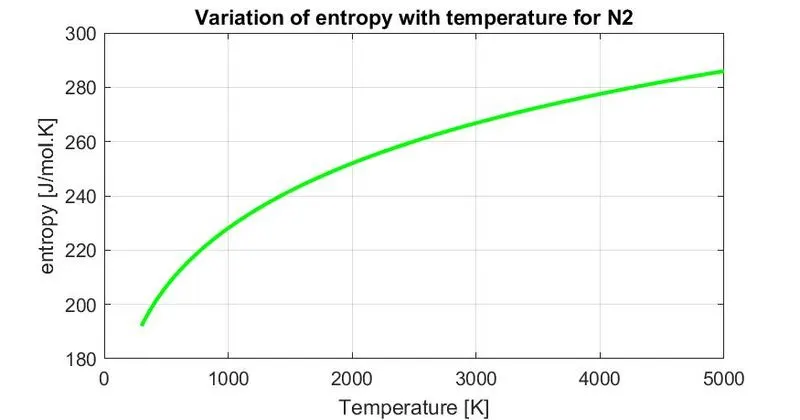
Plots for N2
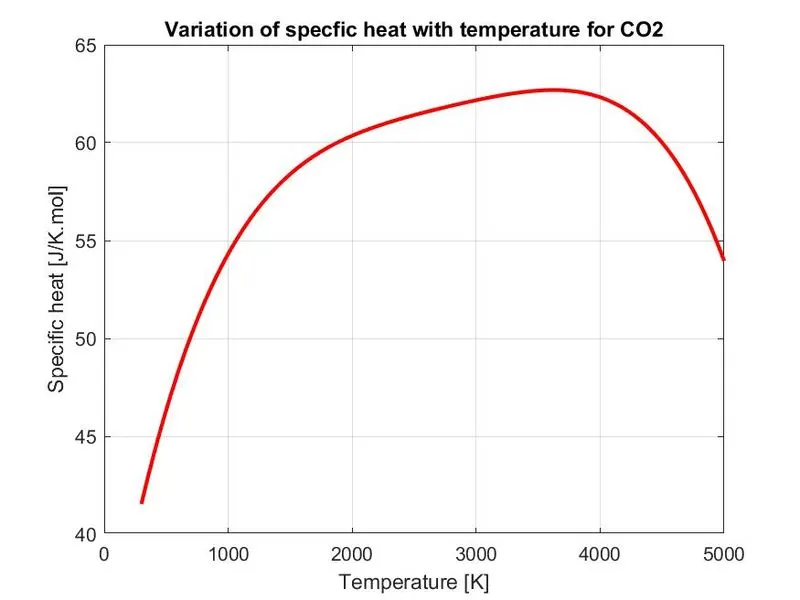
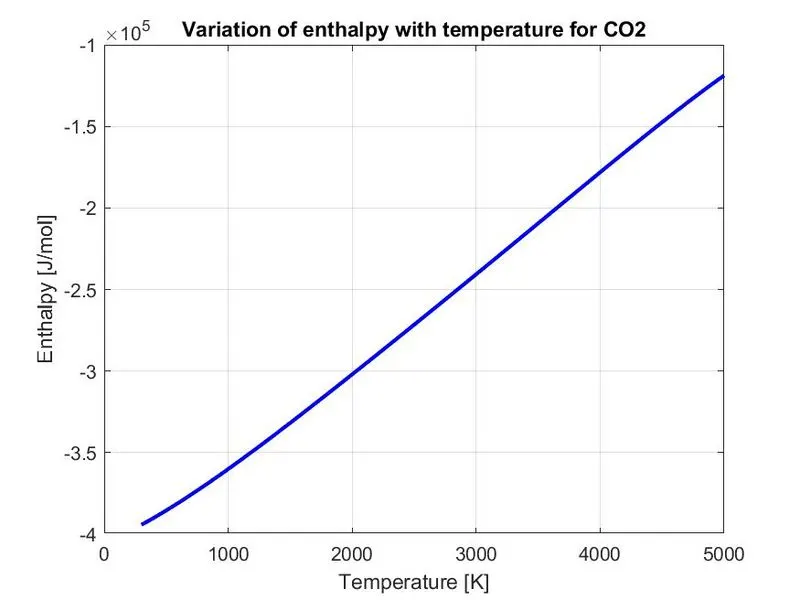
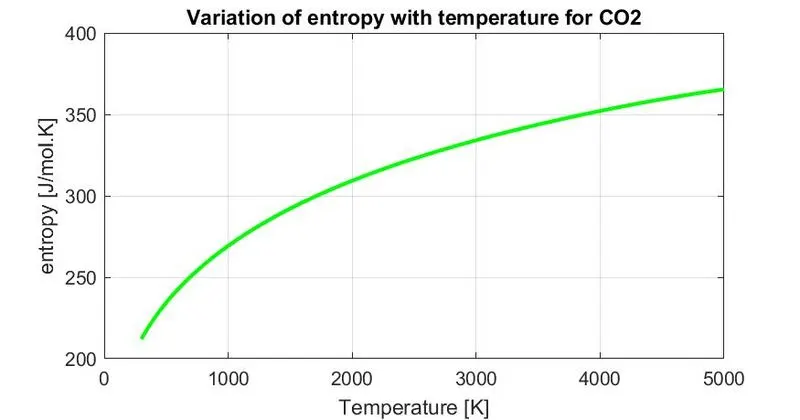
Plots for CO2
Screenshots of folders for species