Project 1 - Parsing NASA thermodynamic data
OBJECTIVE - PARSING NASA THERMODYNAMIC DATA
main code :
clear all
close all
clc

%opening a file & 'r' open for reading
f1=fopen('THERMO.dat','r');
skippinglines=fgetl(f1);

tline=fgetl(f1);

tline1=fgetl(f1);

%string splitting
A=strsplit(tline1,' ');

%converting string cells into numbers
global_low_temp=str2double(A{2});
global_medium_temp=str2double(A{3});
global_high_temp=str2double(A{4});


%universal gas constant
R=8.314;

%skipping next 3 lines
for i=1:3
    skippinglines=fgetl(f1);
end

%creating a loop to read the species
for i=1:53

    line1=fgetl(f1);

    %splitting into cell array
    temp=strsplit(line1,' ');

    %to read the name of the species
    species_name=(temp{1});

    %to convert string to numbers
    local_low_temp=str2double(temp{end-3});
    local_mid_temp=str2double(temp{end-2});
    local_high_temp=str2double(temp{end-1});

    %defining temmparature range
    T=linspace(local_low_temp,local_high_temp,800);


%extracting first 7 coefficients
% here A values are denoted for high temparature coefficients
% here B values are denoted for low temparature coefficients

tline_1=fgetl(f1);
a=strfind(tline_1,'E');

a1=tline_1(1:a(1)+3);
A1=str2double(a1);

a2=tline_1(a(1)+4:a(2)+3);
A2=str2double(a2);

a3=tline_1(a(2)+4:a(3)+3);
A3=str2double(a3);

a4=tline_1(a(3)+4:a(4)+3);
A4=str2double(a4);

a5=tline_1(a(4)+4:a(5)+3);
A5=str2double(a5);


tline_2=fgetl(f1);
b=strfind(tline_2,'E');

b1=tline_2(1:b(1)+3);
A6=str2double(b1);

b2=tline_2(b(1)+4:b(2)+3);
A7=str2double(b2);

%extracting second 7 coefficients - low temparature coefficients
b3=tline_2(b(2)+4:b(3)+3);
B1=str2double(b3);

b4=tline_2(b(3)+4:b(4)+3);
B2=str2double(b4);

b5=tline_2(b(4)+4:b(5)+3);
B3=str2double(b5);

tline_3=fgetl(f1);
c=strfind(tline_3,'E');

c1=tline_3(1:c(1)+3);
B4=str2double(c1);

c2=tline_3(c(1)+4:c(2)+3);
B5=str2double(c2);

c3=tline_3(c(2)+4:c(3)+3);
B6=str2double(c3);

c4=tline_3(c(3)+4:c(4)+3);
B7=str2double(c4);


%defining value of universal gas constant
R=8.314;

%calculating specific heat
cp=specificheat(A1,A2,A3,A4,A5,B1,B2,B3,B4,B5,T,R,local_mid_temp);

%endhalpy calculation
H=Enthalpy(A1,A2,A3,A4,A5,A6,B1,B2,B3,B4,B5,B6,T,R,local_mid_temp);

%entropy calculation
S=Entropy(A1,A2,A3,A4,A5,A7,B1,B2,B3,B4,B5,B7,T,R,local_mid_temp);

%calculating molecular weight of following atom
%atomic name
atoms=['H','C','O','N','R','S'];
%hydrogen,carbon,oxygen,bitrogen,argon,sulphur

%standard atomic weight
atomic_weight =[1 12 16 14 40 32];
%starting range of molecule
MW =0;

%adding atomic number to obtain particular value
for i=1:length(species_name)
    for j =1:length(atoms)
        if strcmp(species_name(i),atoms(j))
            MW = MW + atomic_weight(j);
            position = j;
        end
    end
    n = str2double(species_name(i));

    if n>1

        MW = MW + (atomic_weight(position).*(n-1));
    end
end

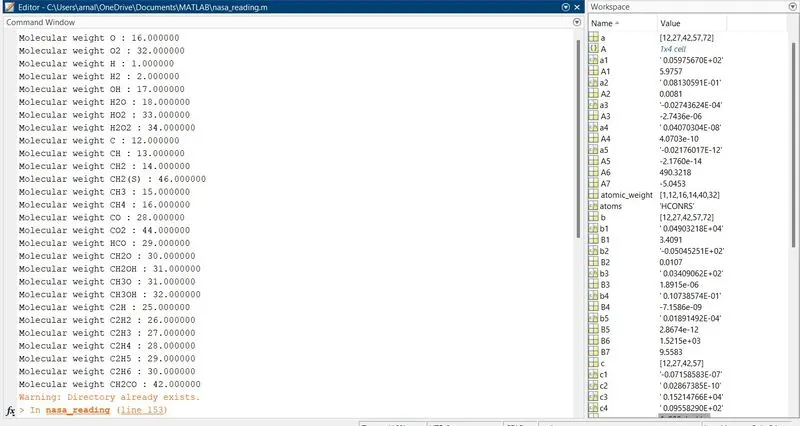
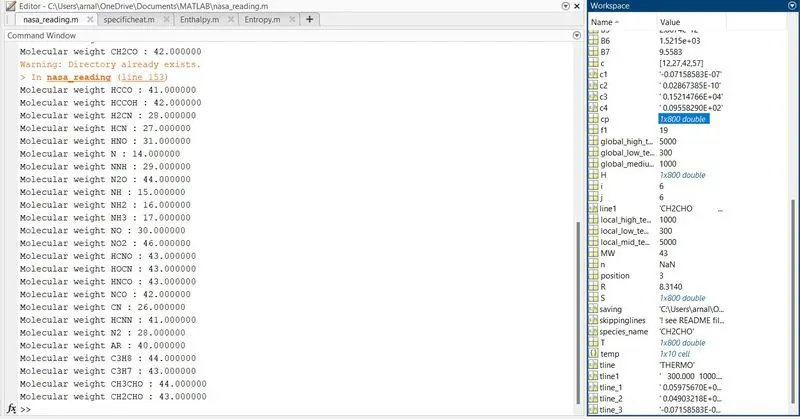
    fprintf('Molecular weight %s : %f ',species_name,MW);
    disp(' ');


%plotting(cp,H,S,temp,species_sp)
%creating a folder
mkdir(['C:\Users\arnal\OneDrive\Documents\MATLAB\NASA\',species_name]);

%plotting specific heat(cp) vs temparature range(T)
figure(1)
plot(T,cp,'linewidth',3,'Color','r')
xlabel('Temparature [K]')
ylabel('Specific heat [KJ]')
title(sprintf('SPECIFIC HEAT VS TEMPARATURE OF %s',species_name));
grid on
saveas(figure(1),'specific heat.jpg')

%plotting endhalpy(H) vs temparature range(T)
figure(2)
plot(T,H,'linewidth',3,'color','g')
xlabel('Temparature [K]')
ylabel('Endhalpy in [KJ/(mol)]')
title(sprintf('ENTHALPY VS TEMPARATURE OF %s',species_name));
grid on
saveas(figure(2),'enthalpy.jpg')

%plotting entropy(S) vs temparature range(T)
figure(3)
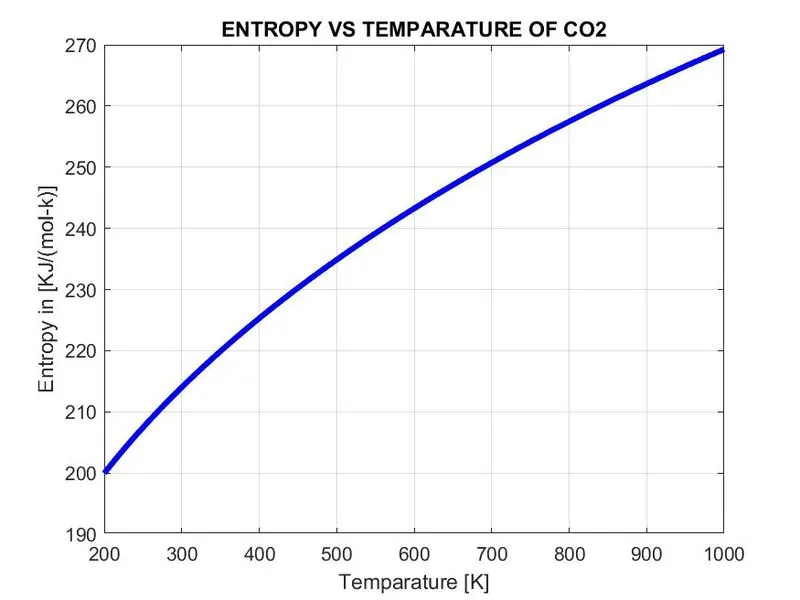
plot(T,S,'linewidth',3,'color','b')
xlabel('Temparature [K]')
ylabel('Entropy in [KJ/(mol-k)]')
title(sprintf('ENTROPY VS TEMPARATURE OF %s',species_name));
grid on
saveas(figure(3),'entropy.jpg')

%changing directory and saving file
saving=(['C:\Users\arnal\OneDrive\Documents\MATLAB\NASA\',species_name]);
cd(saving);


end
EXPLANATION :
- Firstly, we will input the parameter R & we will open a file THERMO.dat file and reading this file using fopen command.
- Then, we will read first THERMO using fgetl command and then we read temparature file and we will split the temparature using 'strsplit' command to convert it into cell array and then we will convert this string to number using 'str2double' command to find low, mid and high temparatures.
- Then run loop to skip command lines the data file using 'fgetl' command inside the loop.
- Now, we will run the loop to find 53 elements in the data file by assigning 'fgetl' command & then splitting into the cell array to find the species line and then find the species name and then find the number of the temparatures in the species line.
- Then we will assign temparature range using linspace command.
- Then we read the new line. In order to read the coefficient in the data file we will first find the 'E' string using 'strfind' command to find before and after numbers of the coefficients then we will find remaining 14 coefficients and convert them in to numbers from strings.
- out of which we will find the first 7 coefficients which are for higher temparature and then second 7 coefficients which are for lower temparature.
- Now we will specify specific heat cp, Entropy S and Enthalpy H functions to find these parameters using these coefficients for lower andd higher temparatures.Then we will specify molecular weight of the atoms to find the molecular weight of the different species.
- Now we will create a directory folder where we have to save our files using mkdir command .
- Then we will plot specific heat , Entropy and Enthalpy with the teemparature for different species .
- Then we will use saveas command to save the plots of different species in the directory folder .Now we will change the directory.
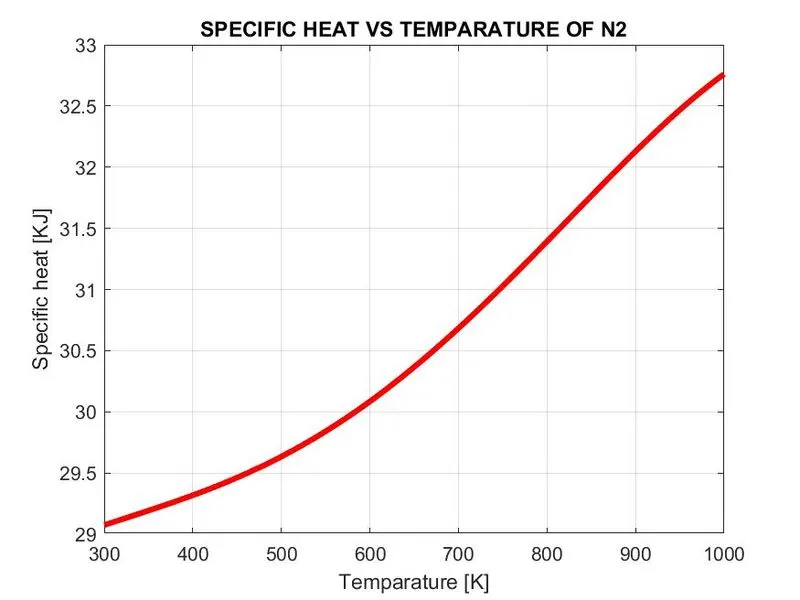
function to find specific heat :
function [cp]=specificheat(A1,A2,A3,A4,A5,B1,B2,B3,B4,B5,T,R,local_mid_temp)

%calculating specific heat
%calculating specific heat for higher and lower temparature respectively
if T > local_mid_temp

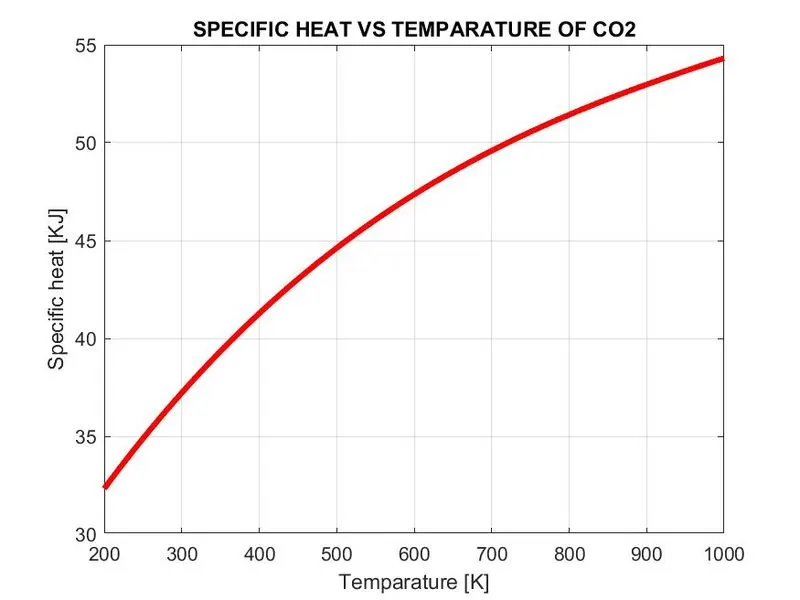
     cp=(A1+(A2*T)+(A3*T.^2)+(A4*T.^3)+(A5*T.^4))*R;

else
    cp=(B1+(B2*T)+(B3*T.^2)+ (B4*T.^3)+(B5*T.^4))*R;

end

end
Explanations :
- Here, we will find the specific heat by creating specific function and assigning its related formula coefficient from 14 coefficients, gas constant, temparature and mid temparature.
- Now we will create a condition using if loop and make the temparature less than and equal to mid temparature to spectify lower temparature coefficient in the formula.
- Then we will use else condtion to specify coefficient of higher temparature coefficient in the formula.
- Then end the loop and function to calculate specific heat.
function to find Enthalpy :
function [H]=Enthalpy(A1,A2,A3,A4,A5,A6,B1,B2,B3,B4,B5,B6,R,T,local_mid_temp)

%calculating endhalpy
%calculating endhalpy for higher and lower temparature
if T > local_mid_temp

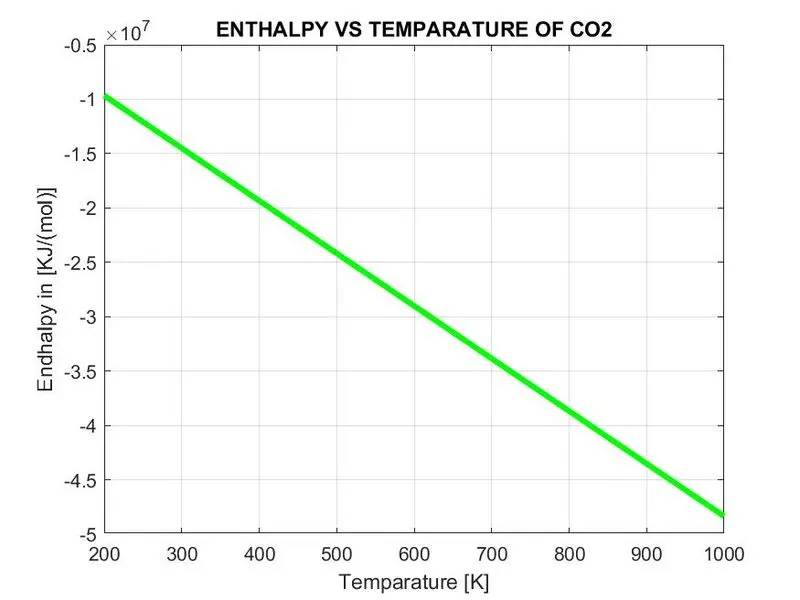
    H=R*T*(A1+ (A2*T./2) + (A3*T.^2./3) + (A4*T.^3./4) + (A5*T.^4./5) + A6./T);
else
    H=R*T*(B1+ (B2*T./2) + (B3*T.^2./3) + (B4*T.^3./4) + (B5*T.^4./5) + B6./T);

end
end
Explanation :
- Here, we will find the Enthalpy by creating Enthalpy function and assigning its related formula coefficient from 14 coefficients, gas constant, temparature and mid temparature.
- Now we will create a condition using if loop and make the temparature less than and equal to mid temparature to spectify lower temparature coefficient in the formula.
- Then we will use else condtion to specify coefficient of higher temparature coefficient in the formula.
- Then end the loop and function to calculate Enthalpy.
function to find Entropy :
function [S]=Entropy(A1,A2,A3,A4,A5,A7,B1,B2,B3,B4,B5,B7,T,R,local_mid_temp)

%calculating entropy
%calculating entropy for higher and lower temparature

if T > local_mid_temp

    S=R*(A1*log(T) + (A2*T) + ((A3*T.^2)./2) + ((A4*T.^3)./3) + ((A5*T.^4)./4) + A7);
else
    S=R*(B1*log(T) + (B2*T) + ((B3*T.^2)./2) + ((B4*T.^3)./3) + ((B5*T.^4)./4) + B7);

end
end
Explanation :
- Here, we will find the Entropy by creating Entropy function and assigning its related formula coefficient from 14 coefficients, gas constant, temparature and mid temparature.
- Now we will create a condition using if loop and make the temparature less than and equal to mid temparature to spectify lower temparature coefficient in the formula.
- Then we will use else condtion to specify coefficient of higher temparature coefficient in the formula.
- Then end the loop and function to calculate Entropy.
FINAL RESULTS :
plots :
plots of species O2 :
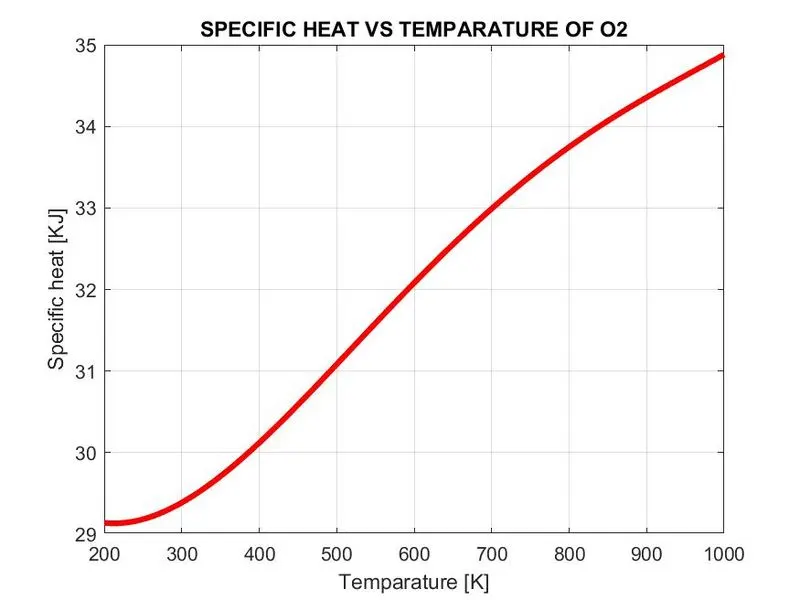
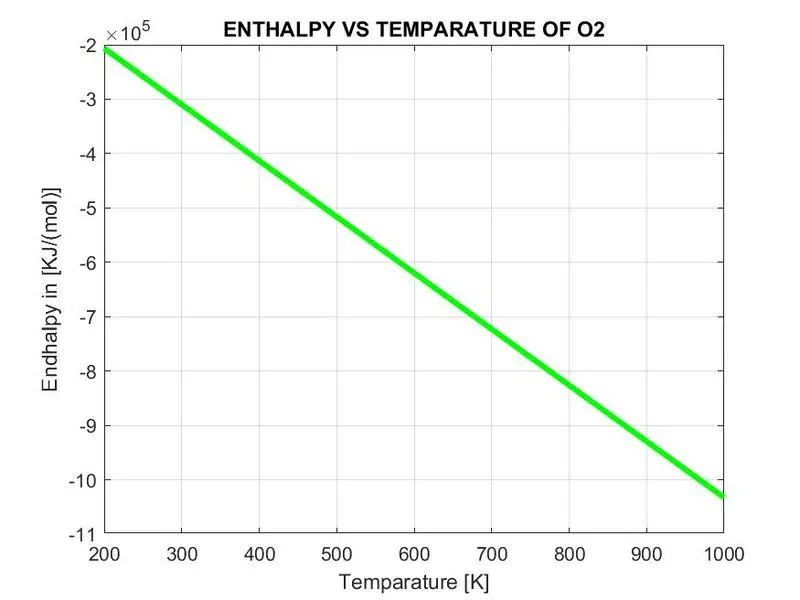
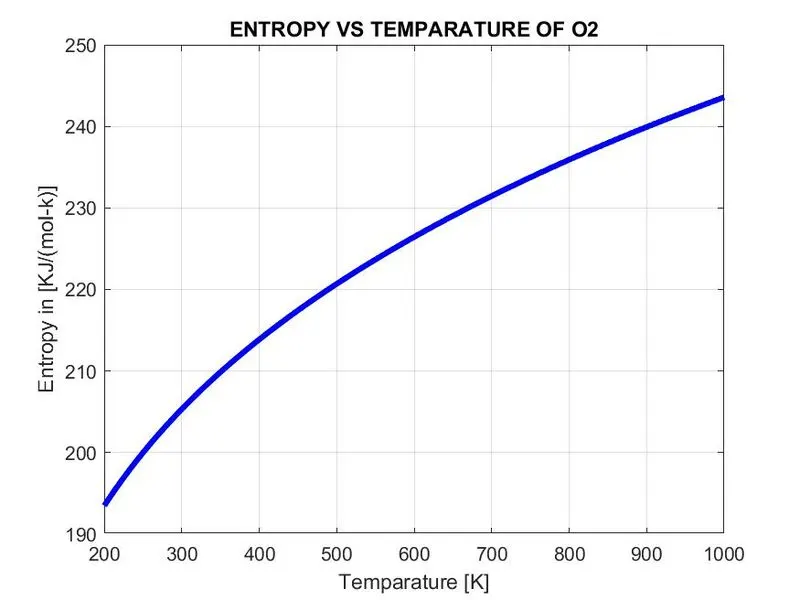
plots of species N2 :
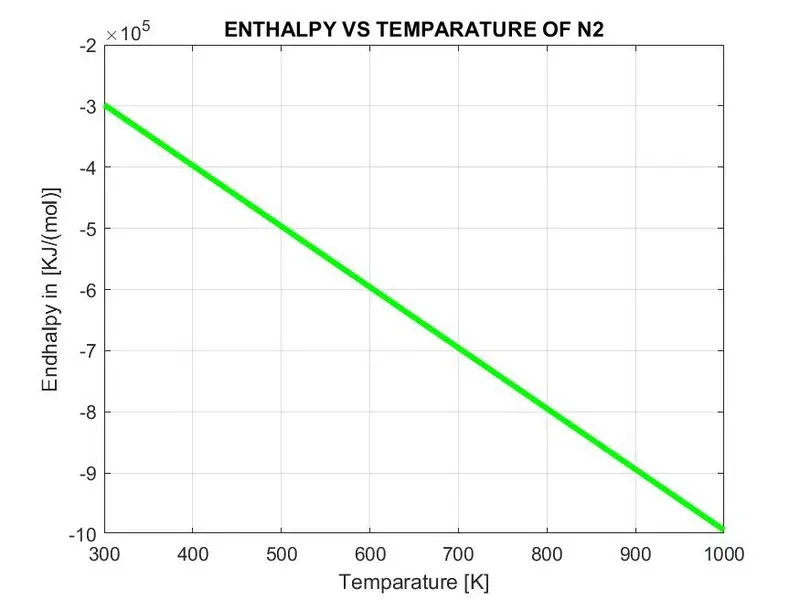
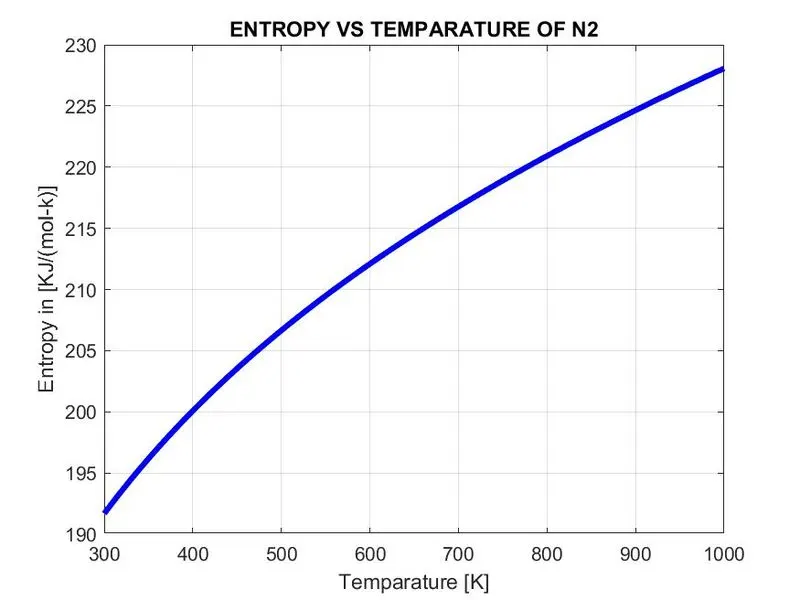
plots of species CO2 :
screenshot of the directory where different species are saved :

output of Molecular weight of different species :
References :
https://in.mathworks.com/matlabcentral/answers/317006-create-new-folders-by-mkdir
https://in.mathworks.com/matlabcentral/answers/17580-how-to-define-a-path-in-saveas-command