Modelling and simulation of flow through a flowbench
Aim:- Modelling and Simulation of flow through flowbench and obtaining a plot of lift vs mass flow rate
Introduction:-
An Air flow bench is a device used for testing the internal aerodynamic qualities of an engine component and is related to the more familiar wind tunnel.
It is used primarily for testing the intake and exhaust ports of cylinder heads of internal combustion engines. It is also used to test the flow capabilities of any component such as air filters, carburettors, manifolds or any other part that is required to flow gas. A flow bench is one of the primary tools of high performance engine builders, and porting cylinder heads would be strictly hit or miss without it.
A flow bench consists of an air pump of some sort, a metering element, pressure and temperature measuring instruments such as manometers, and various controls. The test piece is attached in series with the pump and measuring element and air is pumped through the whole system. Therefore, all the air passing through the metering element also passes through the test piece. Because the volume flow rate through the metering element is known and the flow through the test piece is the same, it is also known. The mass flow rate can be calculated using the known pressure and temperature data to calculate air densities, and multiplying by the volume flow rate.
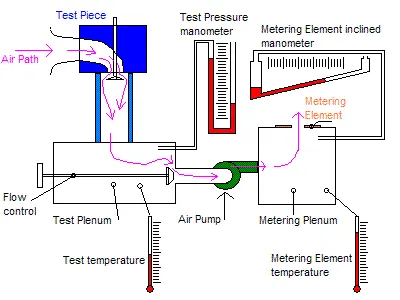
Flow bench schematic diagram
Procedure:-
1) Geometry
Diameter of Cylinder -100 mm
Length of Cylinder - 100 mm
Thickness of Cylinder - 10mm
Minimum Valve lift = 1.1 mm
Maximum Valve lift = 7 mm
Simulation Parameters
Simulation type =Steady
Flow Type= Internal
Velocity= 6 m/s
Pressure = 101325 Pa
Simulation Procedure:-
- Design cylinder and valve as per the given geometry then apply lids at both end to prepare the domain for computation.
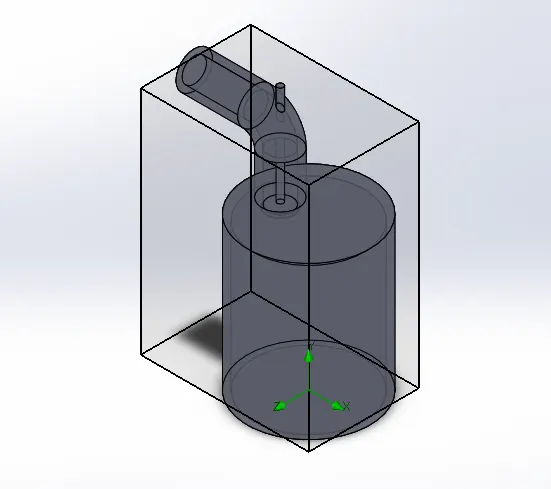
Design Flowbench as per Geometry.
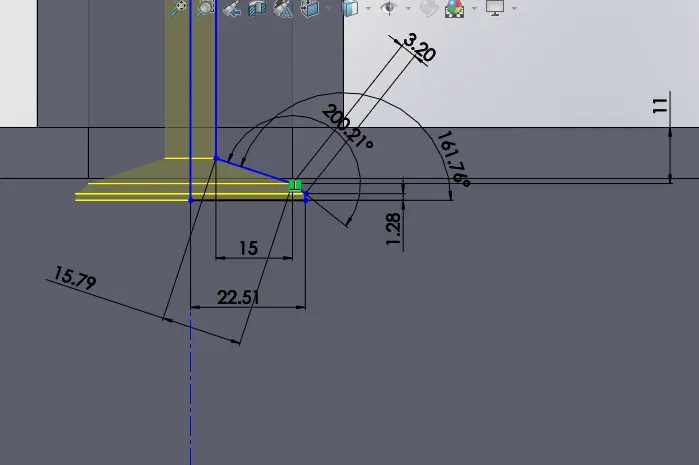
Valve Geometry
- Activate the flow simulation and enter the parameters for steady state flow simulation.
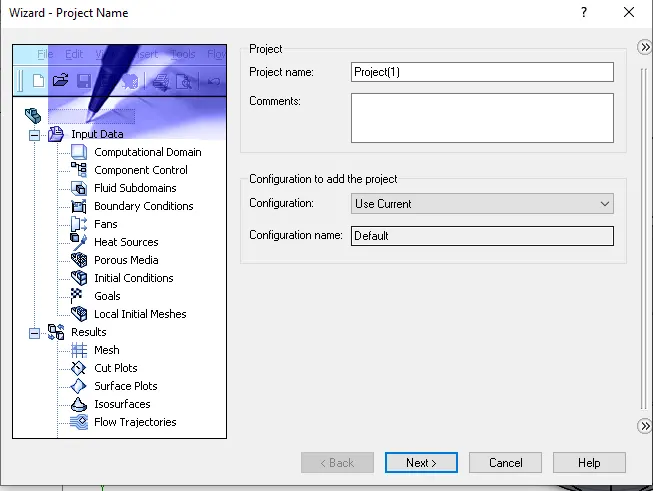
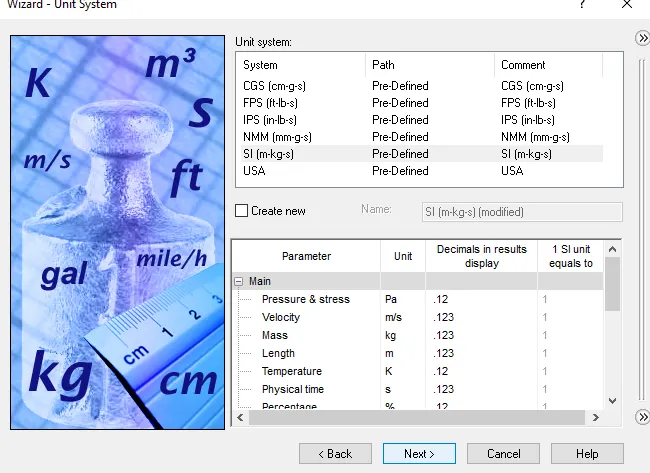
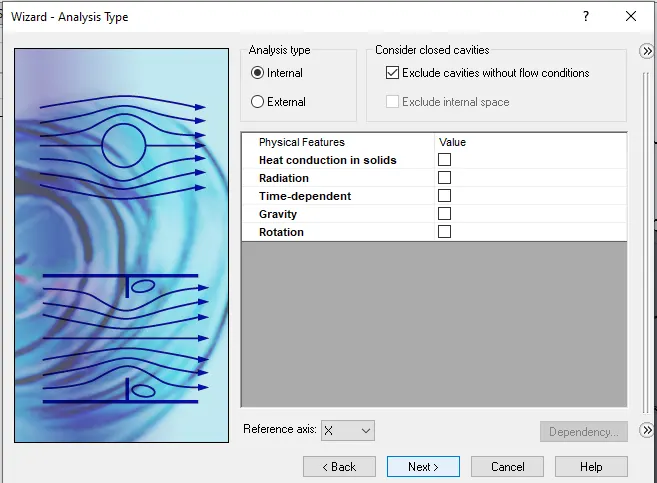
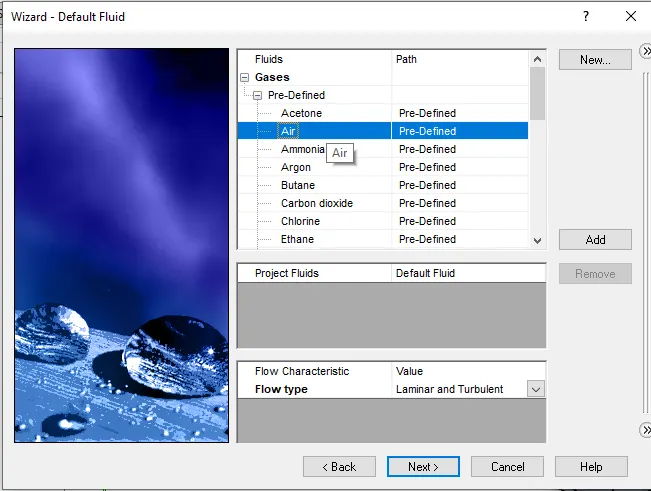
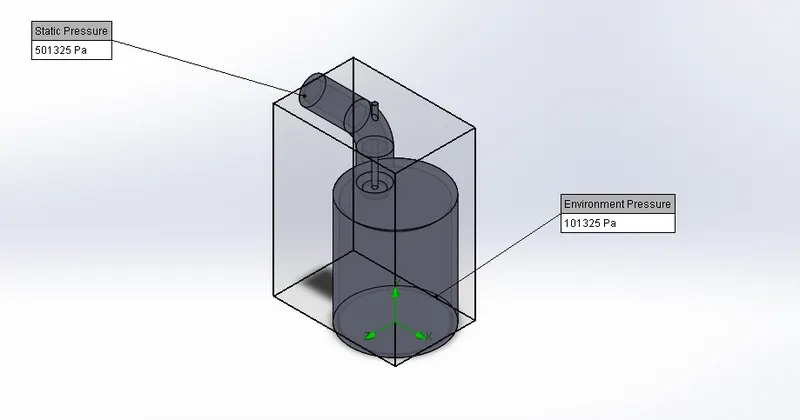
Inlet Boundary Condition is Static Pressure at 5 bar & Outlet Boundary Condition is Enivornmental Pressure at 1 bar .
- Perform grid dependency for various mesh grid sizes and select the suitable one.
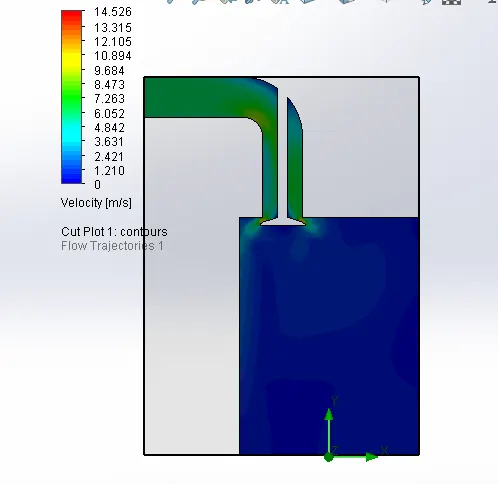
Grid Size at 4
Grid Size at 5
Grid Size at 6 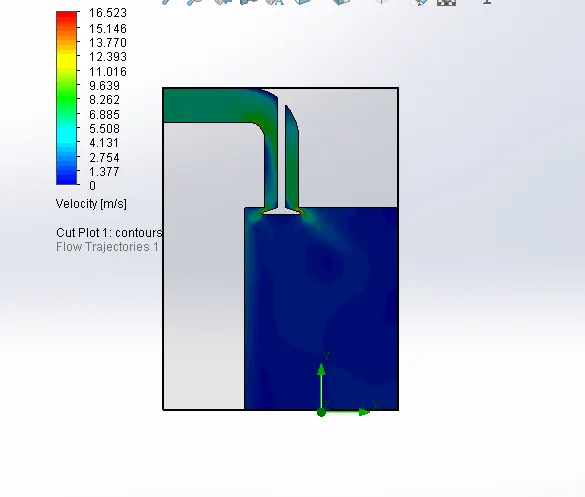
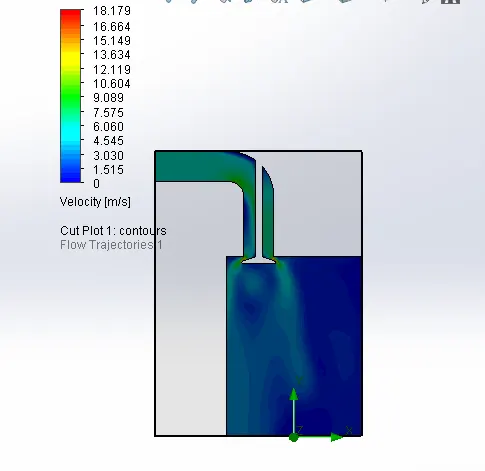

Grid size 5 gives fair enough result for the analysis as seen from the velocity plot which has sharp contours of velocity . Also the mass flow rate is perfectly approximated at Global mesh setting of 5 and takes less time for computation
Basic Grid for the computational domain
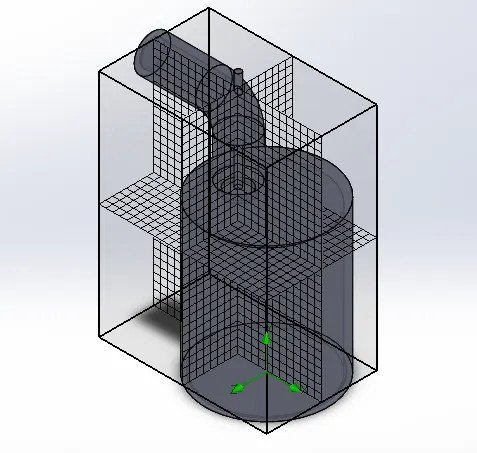
Also localised mesh is made near the valve seat area so as to that obtain accurate results along that region.
- Assign local and surface goals for mass flow rate which is the lid at the outlet .
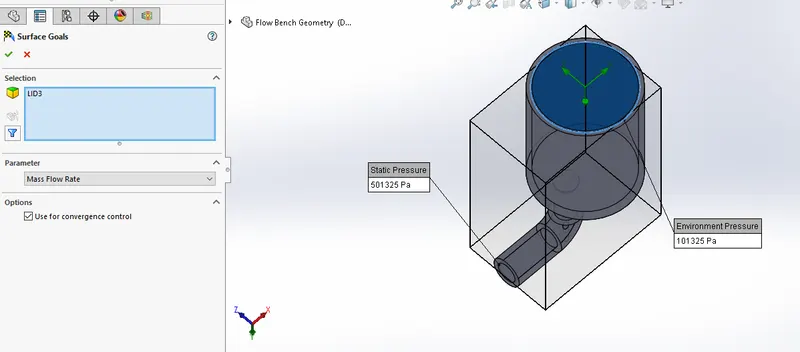
- Run the simulation and check results for velocity plots for every valve opening.
- Adding Cut plot in Front Plane for velocity and adding flow trajectory.
- Varying the valve lift in the second parametric study
Results:-

Velocity at valve opening of 15 mm
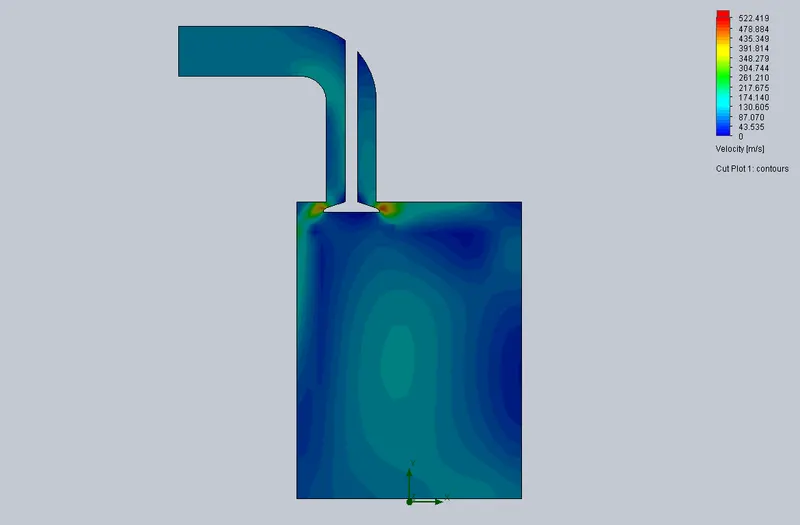
Velocity at valve opening of 17 mm
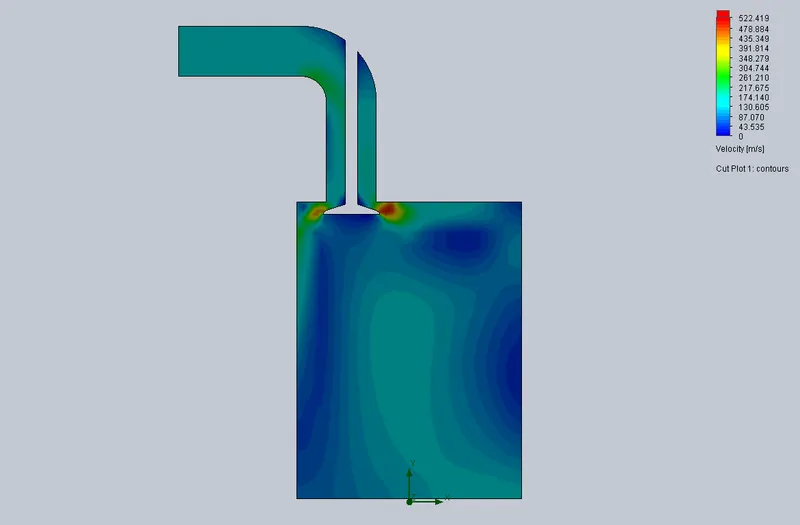
Velocity at valve opening of 19 mm
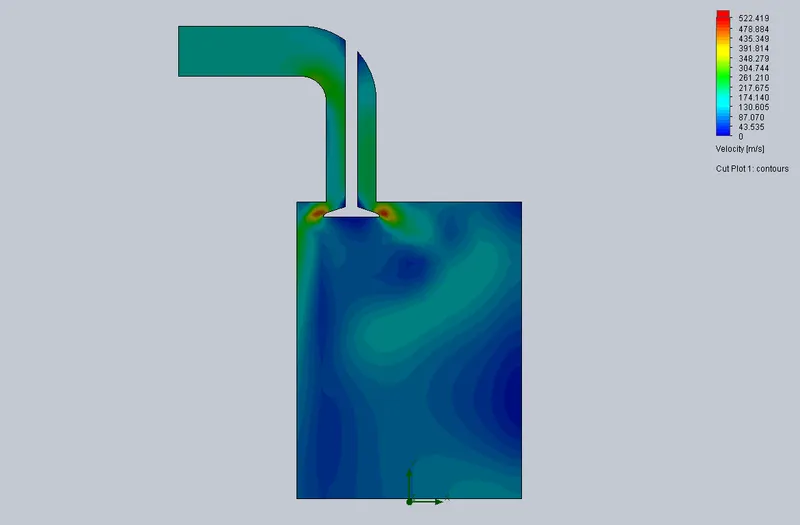
Velocity at valve opening of 21 mm
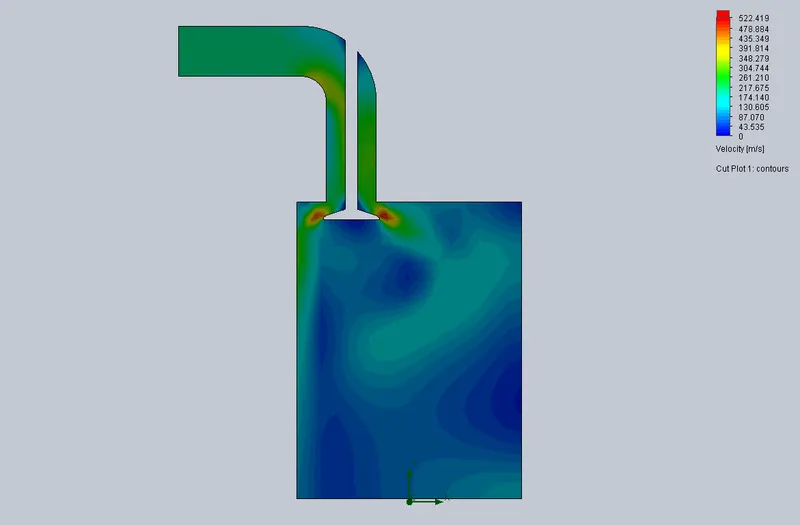
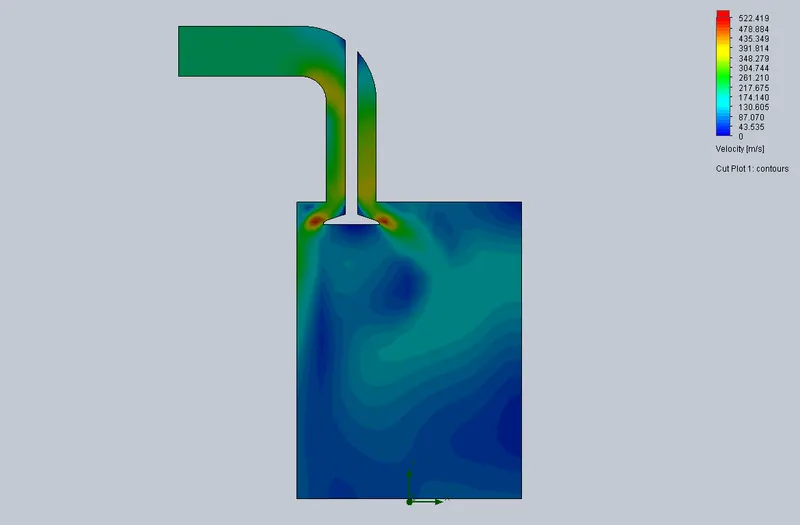
Velocity at opening of 25 mm
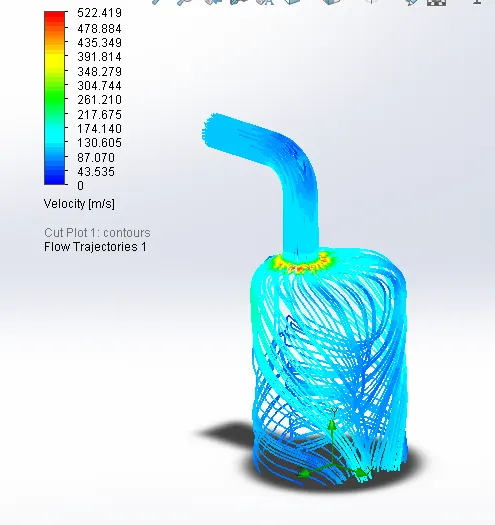
Flow Trajectories inside the flowbench
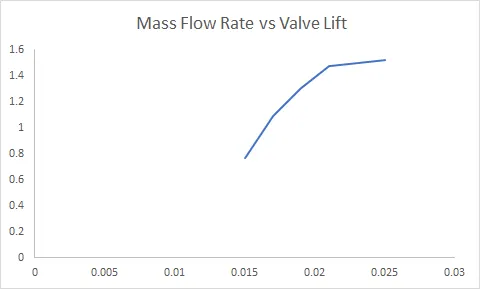
Mass Flow Rate vs Valve Lift
Conclusion:-
1. As the valve lift increases the inlet velocity also increases inside the flowbench.
2. There as small pressure drop region between valve and flowbench where the maximum velocity is reached .
3. As the valve lift increases the mass flow rate in flowbench increases as more air is sucked in .