Flow over a cylinder at various Reynolds number using SolidWorks.
Objective:
To simulate the flow over a cylinder.
- Calculate the baseline case Reynolds number.
- Run a baseline simulation and then calculate the Reynolds number. Then increase the Reynolds number by a factor of 20%, 40%, and 100% then run the transient flow simulation.
- Explain your observations.
Theory:
External Flow
External flow means, flow over bodies that are immersed in a fluid. In external flow, the viscous effects are confined to a portion of the flow field such as the boundary layers and wakes, which are surrounded by an outer flow region that involves small velocity and temperature gradients.
The critical Reynolds number for flow across a circular cylinder or sphere is about Recr ≅ 2 × 10^5 . That is, the boundary layer remains laminar for about Re ≲ 2 × 10^5 , is transitional for 2 × 10^5 ≲ Re ≲ 2 × 10^6 and becomes fully turbulent for Re ≳ 2 × 10^6 .
Drag and Lift
A stationary fluid exerts only normal pressure forces on the surface of a body immersed in it. A moving fluid, however, also exerts tangential shear forces on the surface because of the no-slip condition caused by viscous effects. Both of these forces, in general, have components in the direction of flow, and thus the drag force is due to the combined effects of pressure and wall shear (skin friction) forces in the flow direction. The components of the pressure and wall shear forces in the direction normal to the flow tend to move the body in that direction, and their sum is called lift. For Drag and lift to occur it is not necessary that fluid should move over the body, what important is, the relative motion between fluid and body i.e., the body can also move against still fluid. The phenomenon of drag and lift can be observed in daily life such as drag force acting on moving automobile, wind blowing over trees etc, lift developed by birds and airplane. Reduction of drag is considered favourable in many engineering applications for example in automobiles and aircrafts, less drag means, less fuel consumption, noise and improvement in handling. But in some cases, drag produces a beneficial effect and we try to maximize it. For example, drag that makes it possible for people to parachute. Understanding of lift is also important since positive lift is required to fly airplane and negative lift is required to keep super cars stay on ground or to improve grip at high-speed using components like Wing and spoilers.
The velocity of the fluid approaching a body is called the free-stream velocity and is denoted by V. The fluid velocity ranges from zero at the body surface (the no-slip condition) to the free-stream value away from the body surface.
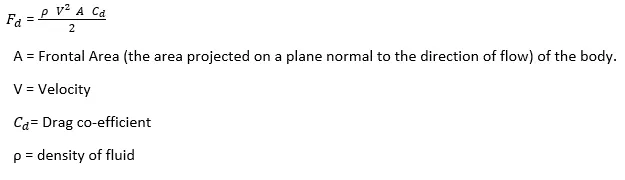
Mathematical Expression for Drag Force:
Friction and Pressure Drag
The part of drag that is due directly to wall shear stress is called the skin friction drag (or just friction drag, friction) since it is caused by frictional effects, and the part that is due directly to pressure is called the pressure drag (also called the form drag because of its strong dependence on the form or shape of the body).
total drag coefficient and drag force,

Flow Separation
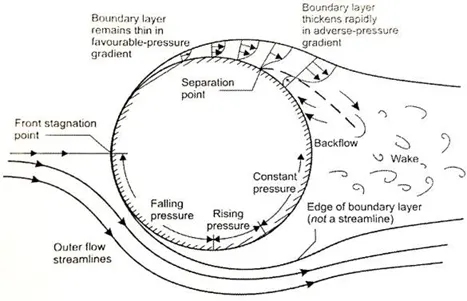
Fluid, when forced to flow over a curved surface at high velocities, follows the front portion of the curved surface with no problem, but it has difficulty remaining attached to the surface on the back side. At sufficiently high velocities, the fluid stream detaches itself from the surface of the body. This is called flow separation.
Steps Taken:
- Model and dimensions of cylinder:
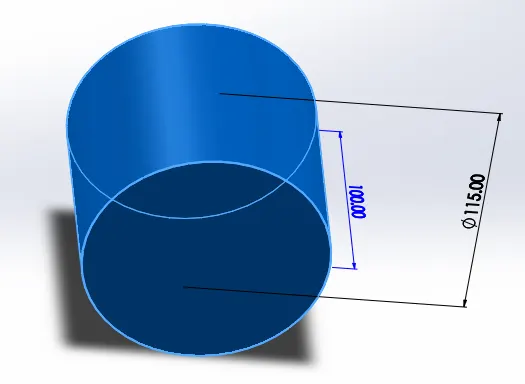
Diameter = 115mm
Width = 100mm
- Calculating velocity of flow with respect to Reynolds number ).
Working fluid = Air
Properties of Air at 1 atm pressure and 30 °C:
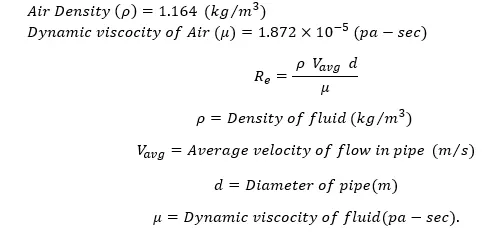
- Base line Condition (Reynold’s no. = 10^4):
Characteristic length of cylinder or external diameter = 115mm

- Increment in Reynold’s no. by 20% (Reynold’s no. = 2 x 10 ^4):
Characteristic length of cylinder or external diameter = 115mm

- Increment in Reynold’s no. by 40% (Reynold’s no. = 4 x 10 ^4):
Characteristic length of cylinder or external diameter = 115mm

- Increment in Reynold’s no. by 100% (Reynold’s no. = 2 x 10 ^4):
Characteristic length of cylinder or external diameter = 115mm

Using ‘Flow Simulation’ tab:
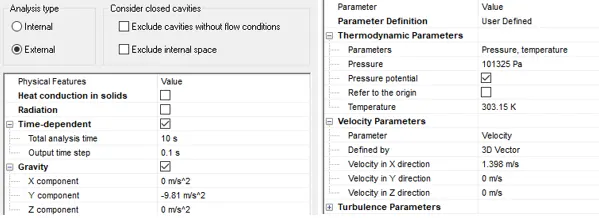
- Setting up Flow simulation Project using ‘Analysis Wizard’.
It asks us a series of questions that sets up majority of our analysis. In Analysis wizard we choose type and analysis and select fluid from extensive database.
Selecting Unit system as SI.
Analysis type = External.
Check Time dependent analysis with analysis time 10sec.
Turing Gravity on in Y-component = -9.81 m/s^2.
Fluid = Air.
Flow type = Laminar and Turbulent.
In Thermodynamic Properties, select Temperature = 303.15 K, Pressure = 101325 Pa .
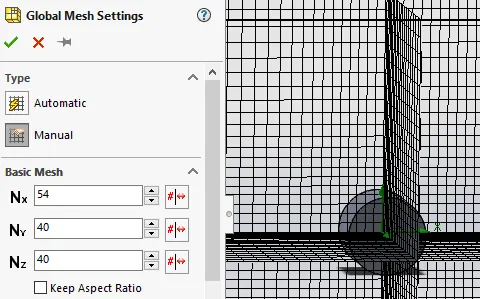
- Change mesh size to a finer mesh for more accurate results.
Results:
Note:
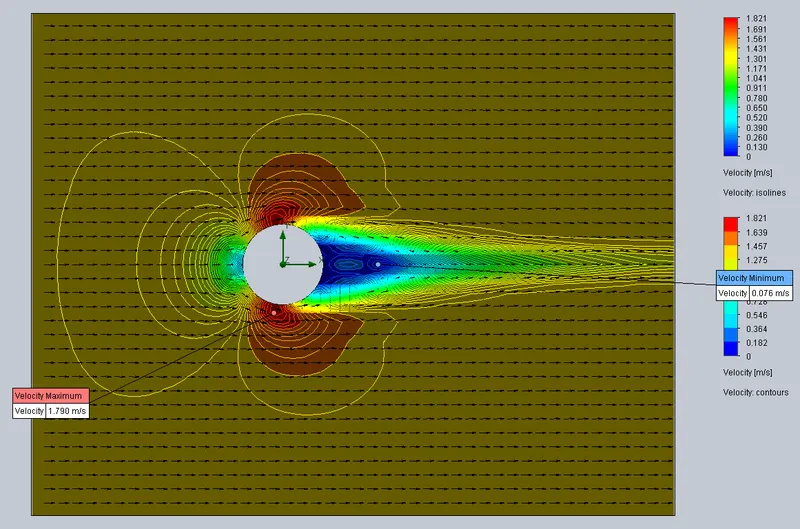
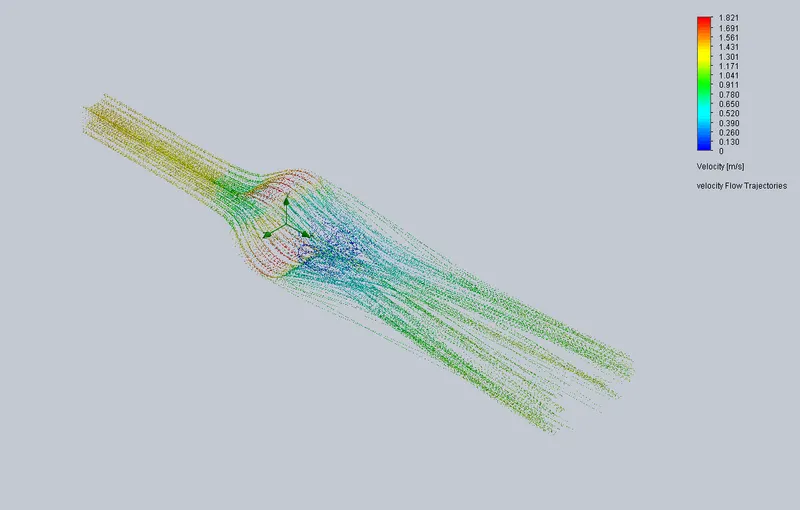
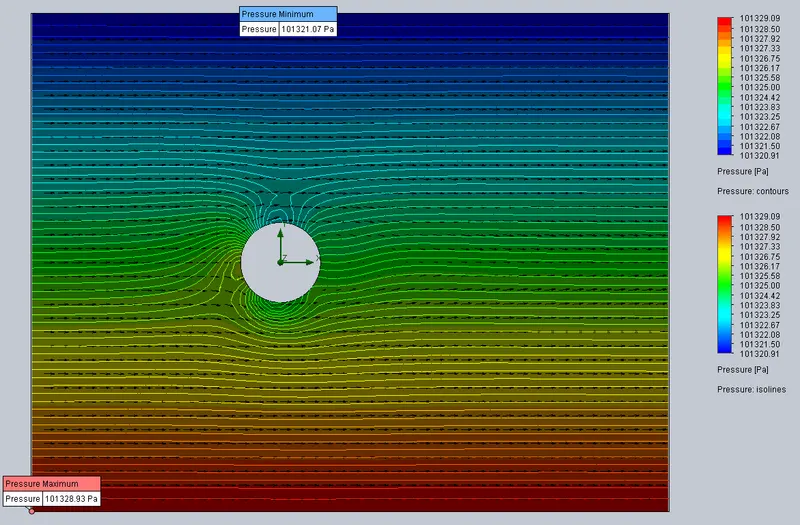
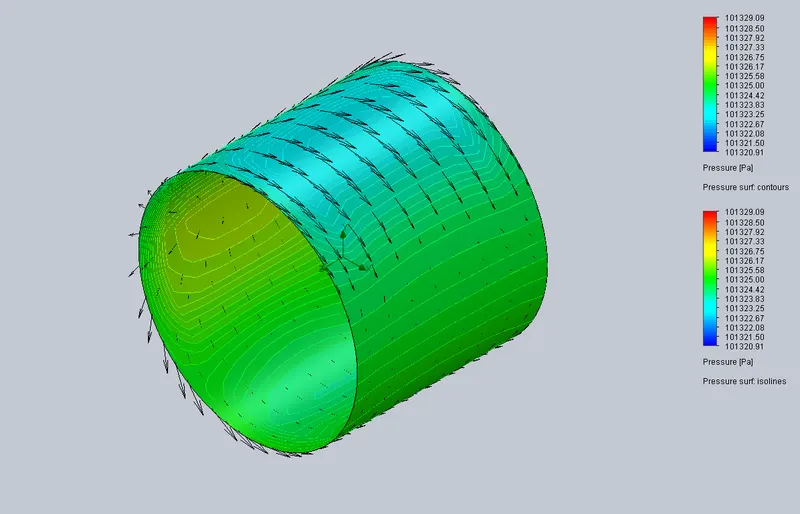
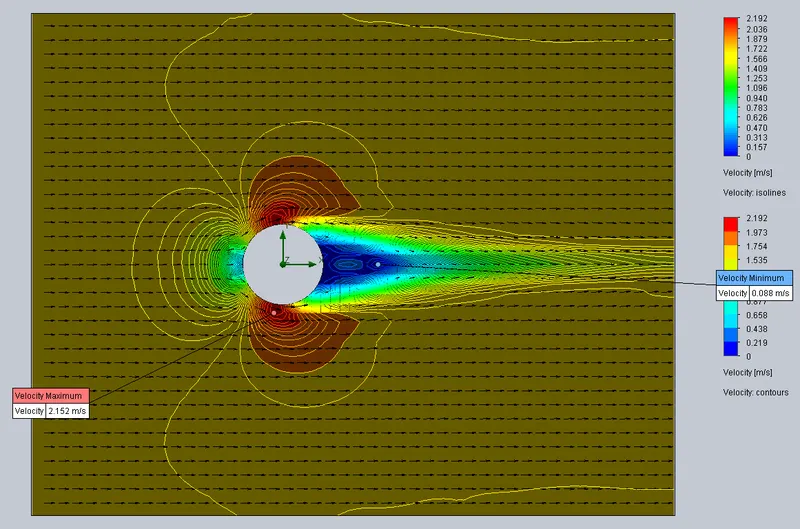
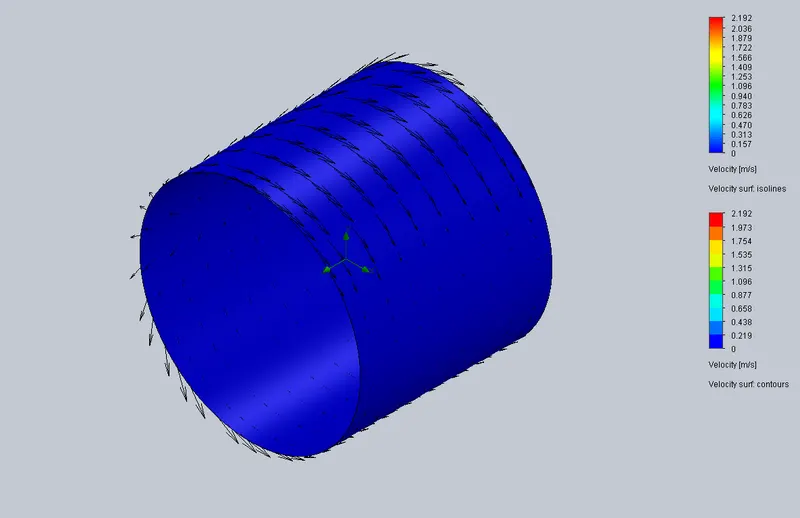
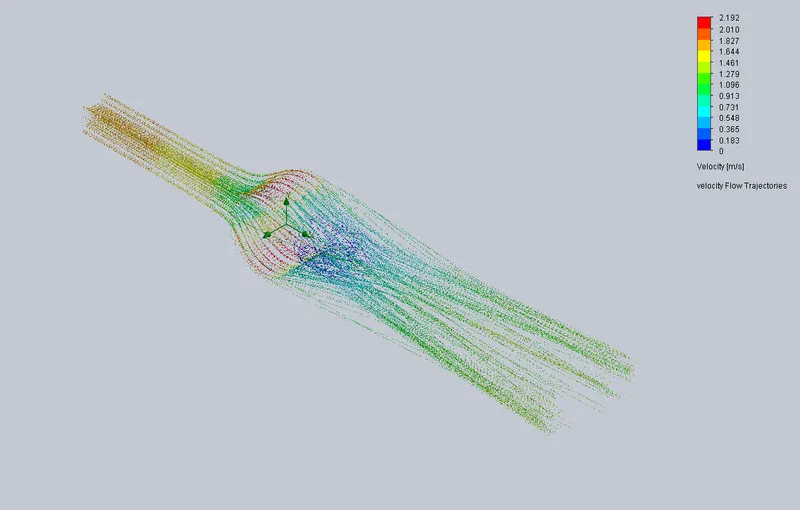
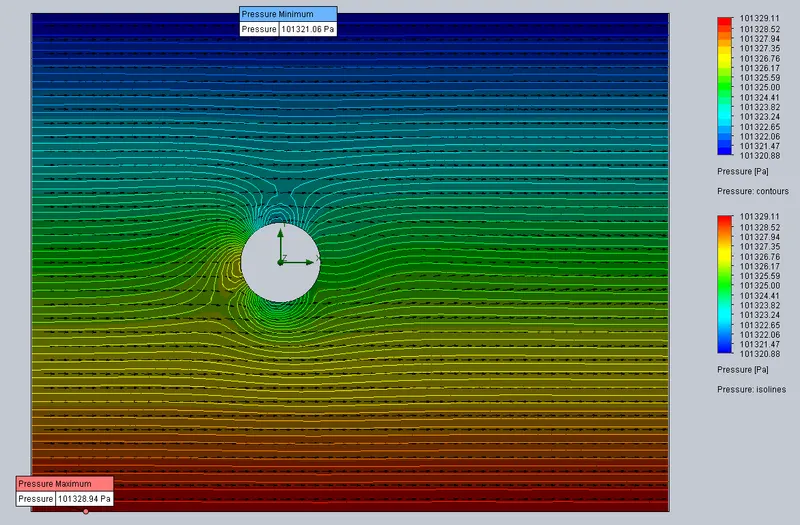
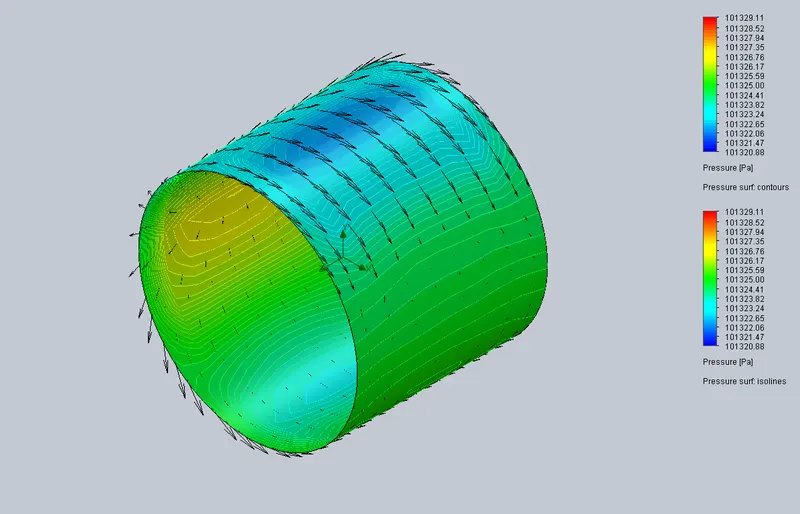
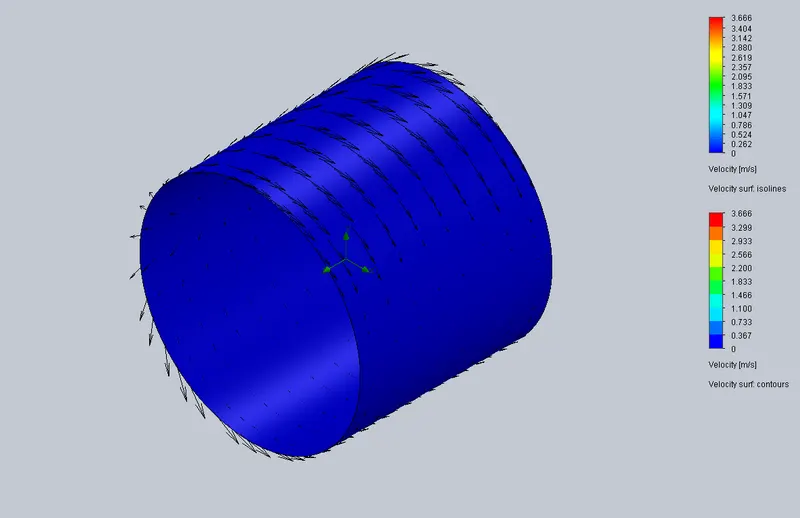
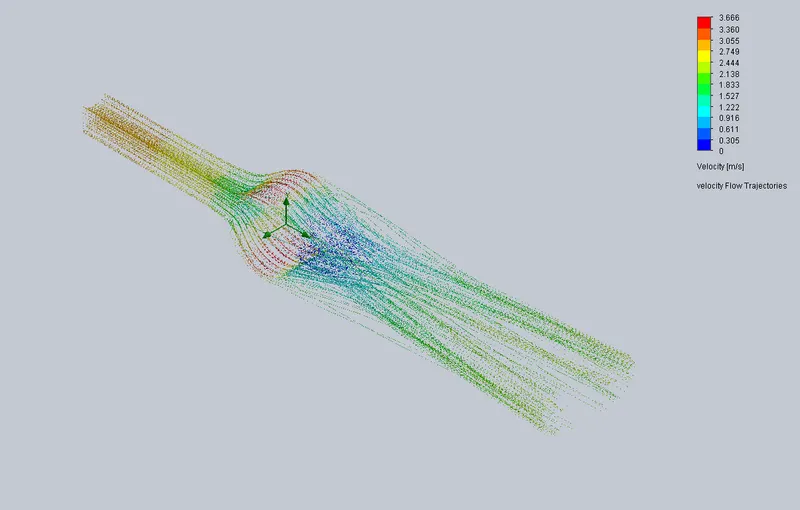
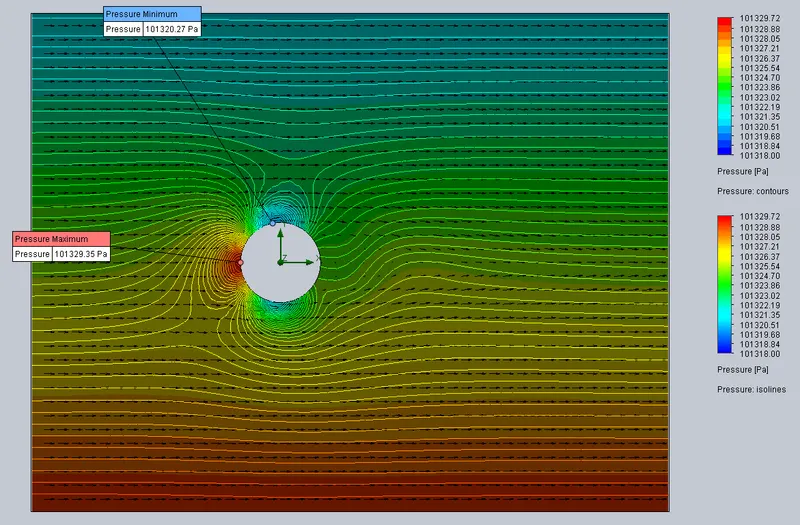
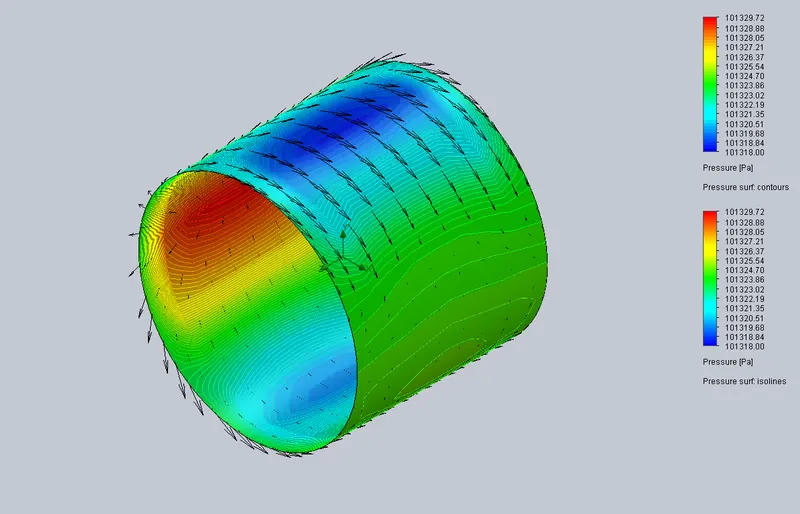
In the plot image, the arrow depicts velocity vectors, the length of arrows shows the magnitude of the velocity and they point in the direction of the flow.
The counter lines are iso-lines, they show regions with same velocity or pressure.
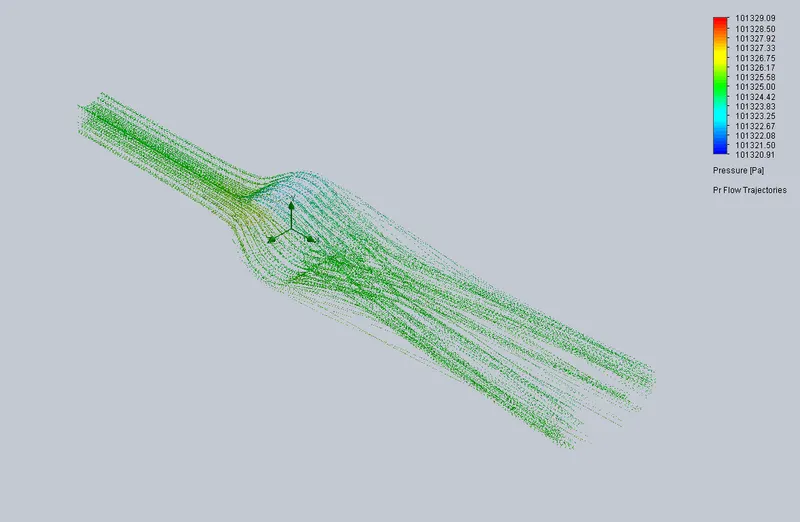
The colour gradient shows the variation of velocity or pressure. The red colour depicts maximum intensity, were as, blue represents the minimum intensity.
- Base line Condition (Reynold’s no. = 10^4):
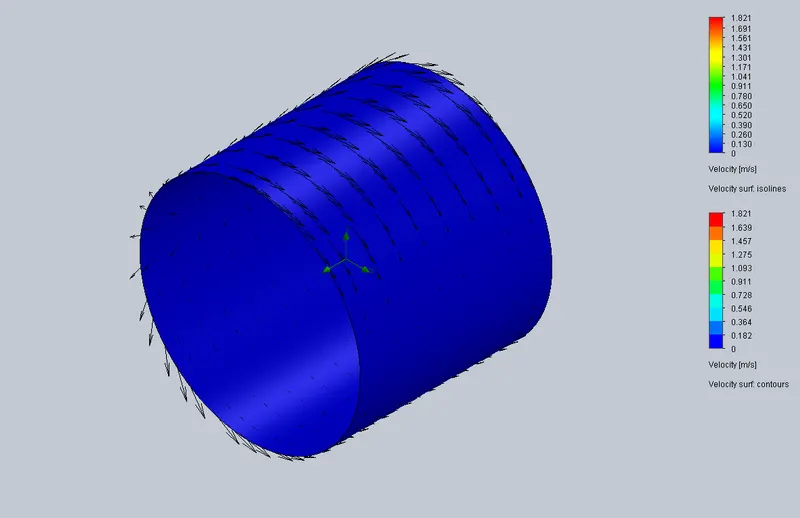
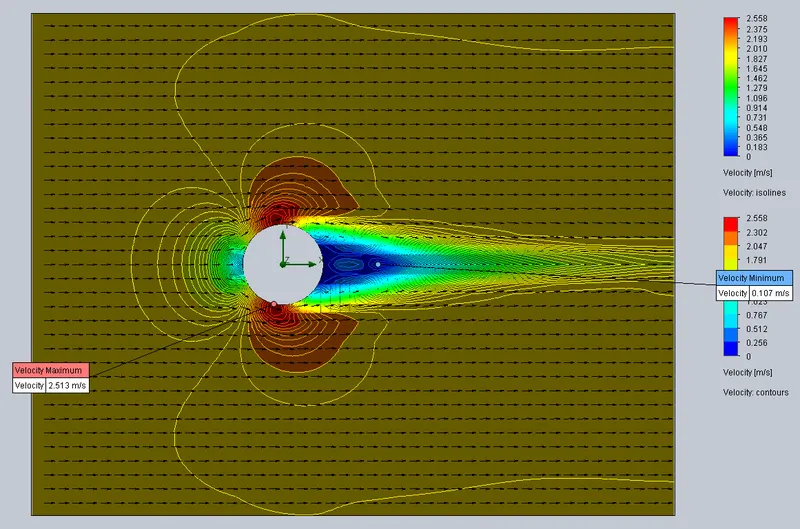
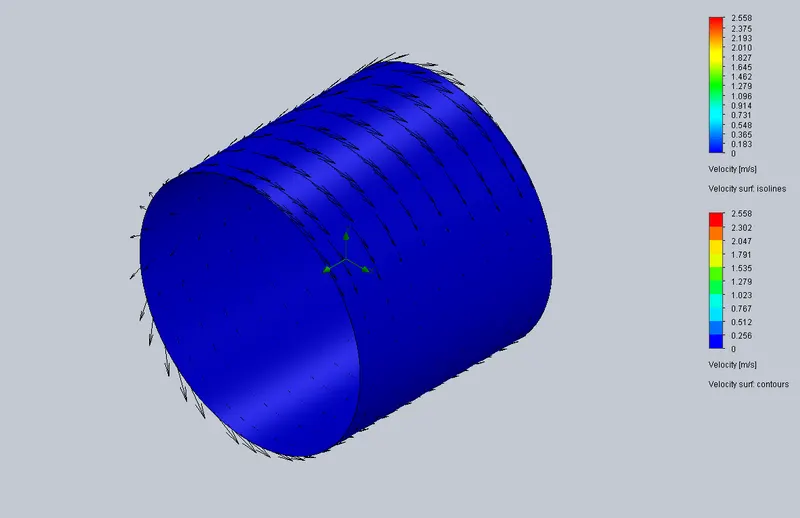
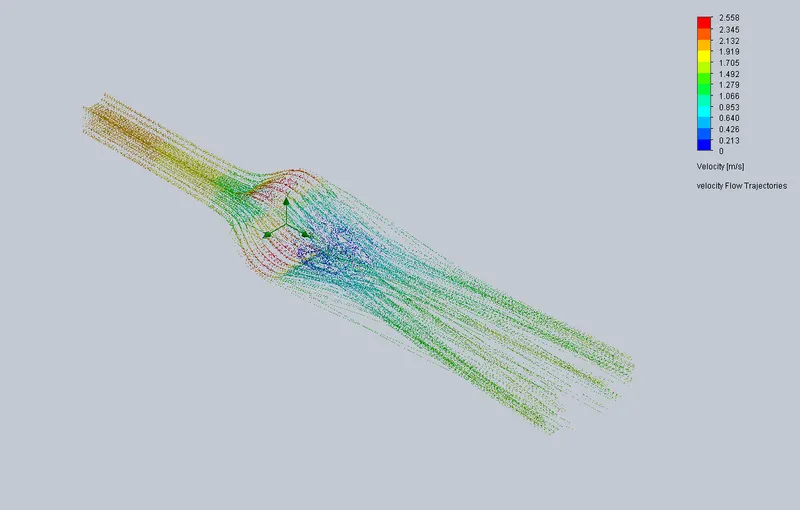
- Velocity Plot (Cut-plot, surface plot and Flow trajectory plot)
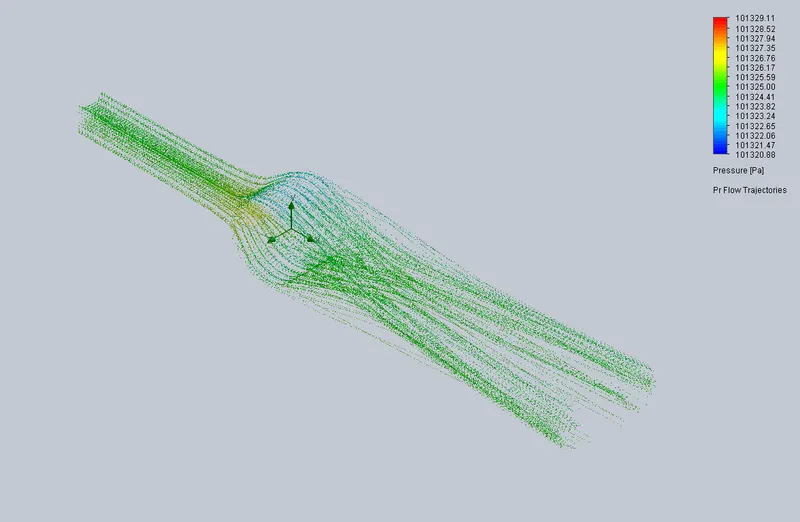
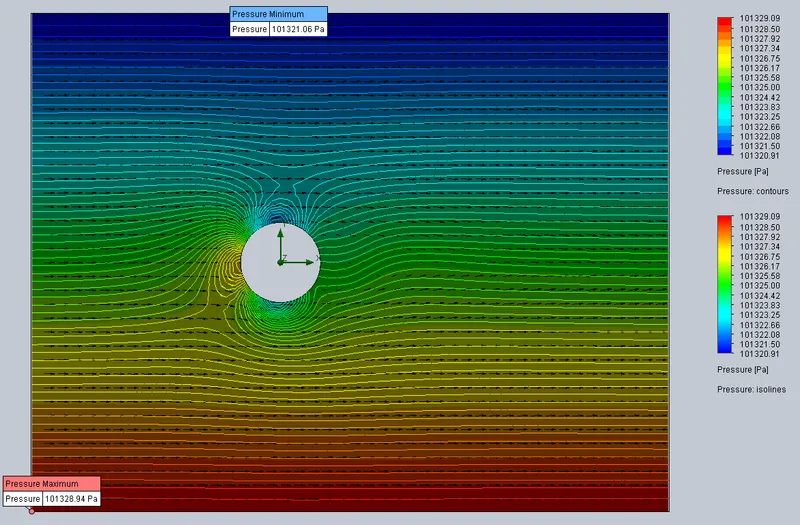
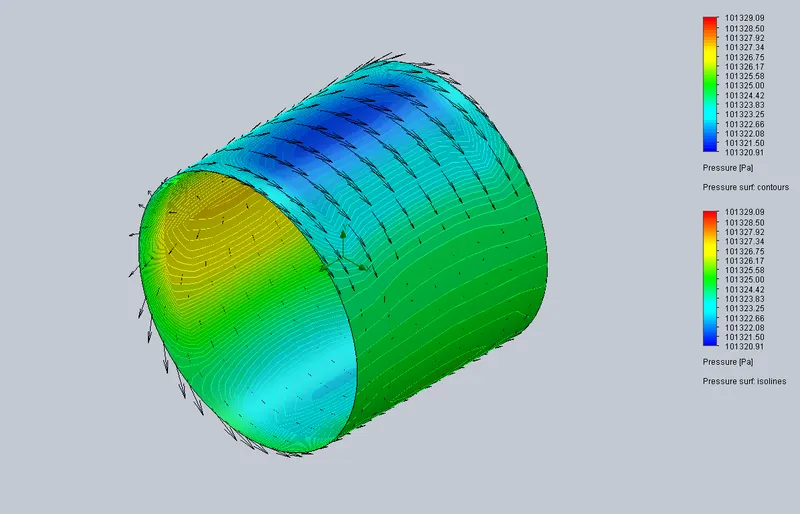
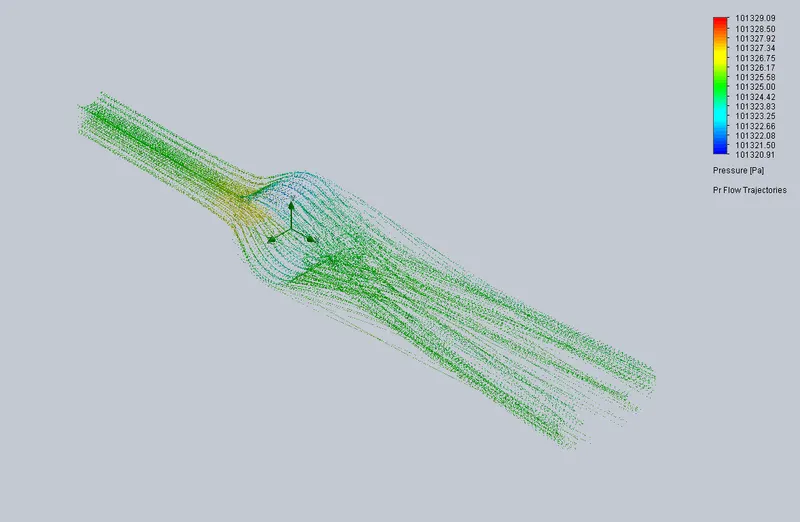
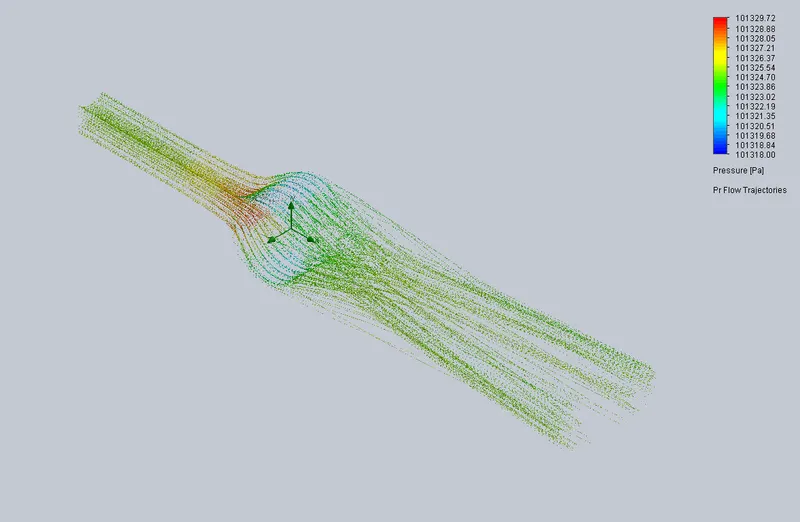
- Pressure Plot (Cut-plot, surface plot and Flow trajectory plot)
- Increment in Reynold’s no. by 20% (Reynold’s no. = 2 x 10 ^4):
- Velocity Plot (Cut-plot, surface plot and Flow trajectory plot)
- Pressure Plot (Cut-plot, surface plot and Flow trajectory plot)
- Increment in Reynold’s no. by 40% (Reynold’s no. = 4 x 10 ^4):
- Velocity Plot (Cut-plot, surface plot and Flow trajectory plot)
- Pressure Plot (Cut-plot, surface plot and Flow trajectory plot)
- Increment in Reynold’s no. by 100% (Reynold’s no. = 2 x 10 ^4):
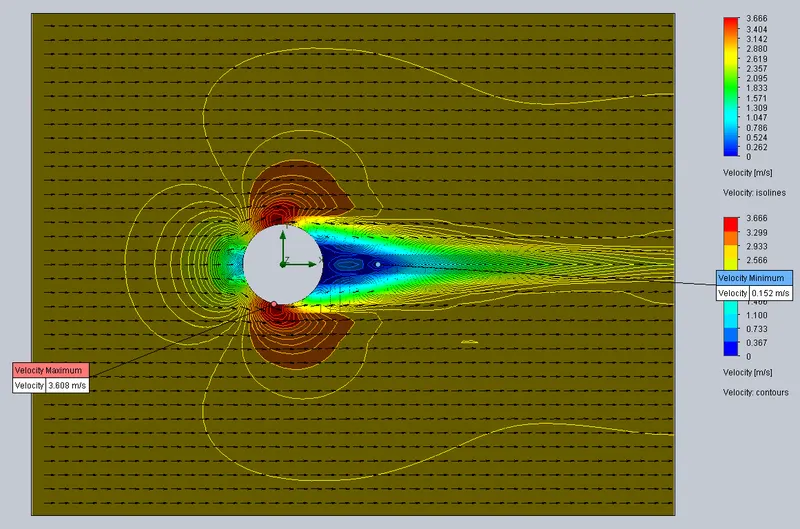
- Velocity Plot (Cut-plot, surface plot and Flow trajectory plot)
- Pressure Plot (Cut-plot, surface plot and Flow trajectory plot)
Observation:
As seen, the flow of air is interrupted by the cylinder. The fluid approaching the cylinder branches out and encircles the cylinder, forming a boundary layer that wraps around the cylinder. The fluid particles on the midplane strike the cylinder at the stagnation point, bringing the fluid to a complete stop and thus raising the pressure at that point.
At the front end of the cylinder where the air flow meets the cylinder for the first time, we can see there is a reduction in air velocity, (marked by green-blue colour in velocity plot). This retardation of air flow will cause drag i.e., a force along the flow of air.
Here, Drag is due is to pressure drag and friction drag.
- The pressure drag is proportional to the frontal area and to the difference between the pressures acting on the front and back of the immersed body (cylinder). Since frontal area in all cases are same but due to the flow velocity being greatest in case 4, large pressure has been developed at the front of the cylinder as compared to the back of it. This pressure build up can be seen by red mark at the front of the cylinder in pressure plot. So, we can say that the pressure drag is maximum in case 4 followed by case 3, case 2 and case 1.
- At low Reynolds numbers, most drag is due to friction drag. And also, as viscosity of the fluid increases, the friction drag increases. Since the viscosity of fluid is same in all the cases, the maximum friction drag will be observed in case 1 followed by case 2, case 3 and case 4.
- As Drag force is proportional to square of velocity and drag co-efficient. We can say that cylinder in case 4 experiences most drag force.
- It should also be noted that, drag is also a function of geometry of the body that means for bluff bodies pressure drag dominates. And for streamlined and slender bodies kept parallel to the fluid flow, friction drag dominates.
The pressure at the top and the bottom of the cylinder is also low in all the cases (marked by blue colour in pressure plot) and also the velocity of air flow is maximum at the top and bottom of the cylinder in all the cases (marked by large vector arrows and red colour in velocity plot). This is because in order to maintain constant flow rate, the flow velocity of the air at the top and bottom increases. And according to Bernoulli’s principle, if the velocity increases, then pressure decreases.
The velocity is zero at the surface of the cylinder, due to no-slip condition (seen in velocity surface plot, the cylinder surface is marked blue).
Flow Separation:
- As seen from the velocity cut-plot, the air follows the front portion of the curved surface, but due to air velocity and curvature of cylinder, it detaches to the surface on the back. This is Flow separation.
- When a fluid separates from a body, it forms a separated region between the body and the fluid stream. This low-pressure region behind the body where recirculation and backflows occur is called the separated region. The larger the separated region, the larger the pressure drag. The effects of flow separation are felt far downstream in the form of reduced velocity (relative to the upstream velocity). The region of flow trailing the body where the effects of the body on velocity are felt is called the wake.
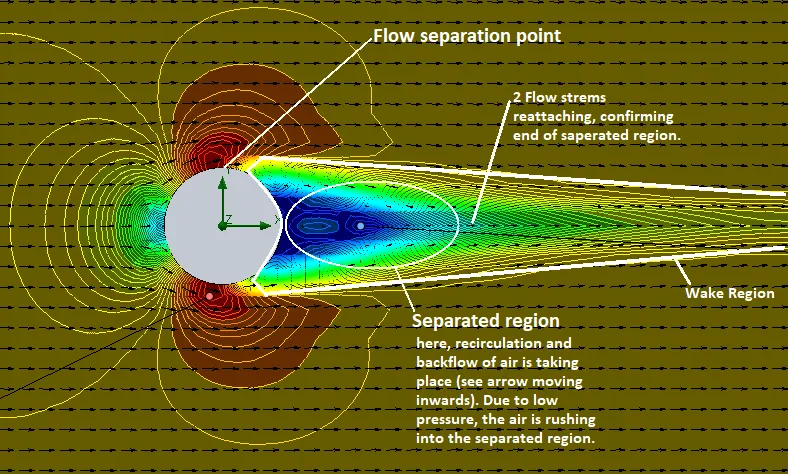
As seen from the velocity cut plots, the wake region of case 4 is largest followed by case 3, case 2, case 1. This is because the velocity of air is highest in case 4.
- The separated region comes to an end when the two flow streams reattach. Therefore, the separated region is an enclosed volume, whereas the wake keeps growing behind the body until the fluid in the wake region regains its velocity and the velocity profile becomes nearly flat again.
- Viscous and rotational effects are the most significant in the boundary layer, the separated region, and the wake.
References:
FLUID MECHANICS (FUNDAMENTALS AND APPLICATIONS) by Yunus Cengel and John Cimbala.