Centrifugal Pump Design and Analysis
Aim: To study the flow through a centrifugal pump, observe the fluid flow pattern and arrive at a pressure ratio
Background:
Centrifugal pumps are used to transport fluids by the conversion of rotational kinetic energy to the hydrodynamic energy of the fluid flow. The rotational energy typically comes from an engine or electric motor. They are a sub-class of dynamic axisymmetric work-absorbing turbomachinery. The fluid enters the pump impeller along or near to the rotating axis and is accelerated by the impeller, flowing radially outward into a diffuser or volute chamber (casing), from which it exits. Generally, centrifugal pumps are axial inlets and radial outlets.
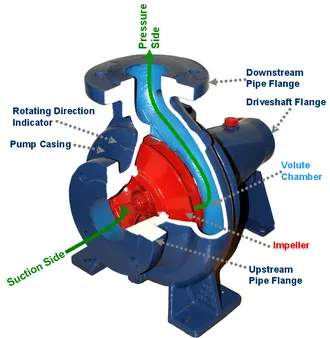
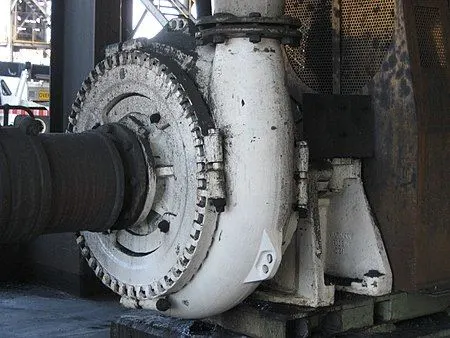
In this project, we are studying the flow of fluid in a centrifugal pump. A rough design of a centrifugal pump is made in solidworks and axial-to-radial flow is simulated in it in Flow SImulation. Finally, Pressure ratio (outlet total pressure/inlet total pressure) is plotted and studied.
Procedure:
- Modelling: Taking the above images as reference, model an impeller of 100 mm radius and 40 mm width, and a casing of 220 mm diameter and 60 mm width. Also model inlet and outlet tubes and make a shell of 1mm thickness. Model an internal fluid casing of roughly 0.5 mm to 1 mm less than the inside of the shell. This is our rotating region which rotates the fluid. Lastly, add lids at the inlet and outlet.
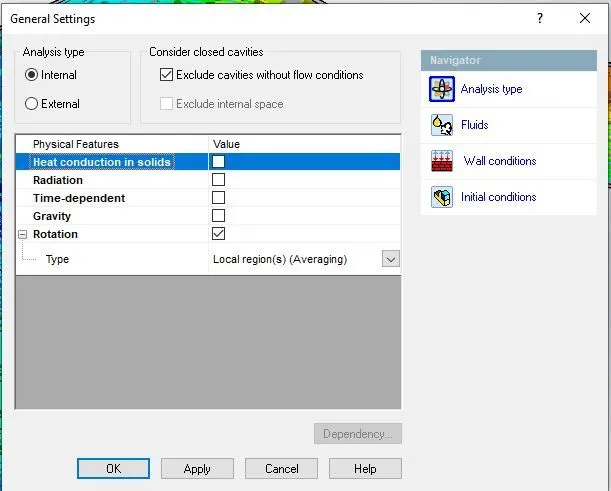
- Start an internal simulation in Flow Simulation with Rotation set to "Local Region(s)- Averaging" in the wizard.
- Select the fluid as water and leave the rest as default. We are not setting a value of velocity as flow will be generated through pressure boundary conditions at inlet and outlet
- Right click "Input Data" and go to "Component Control". Here, deselect the internal casing (highlighted below):
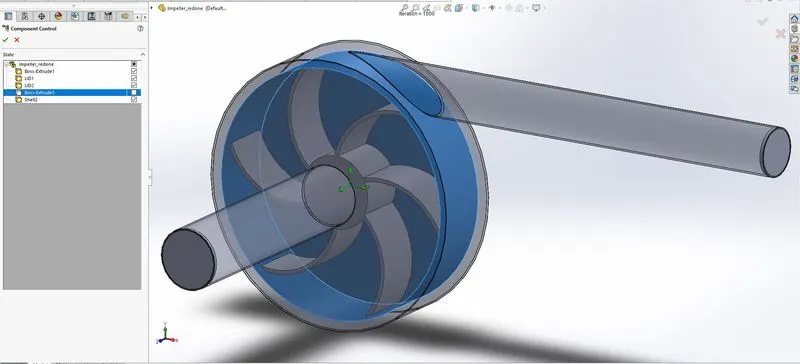
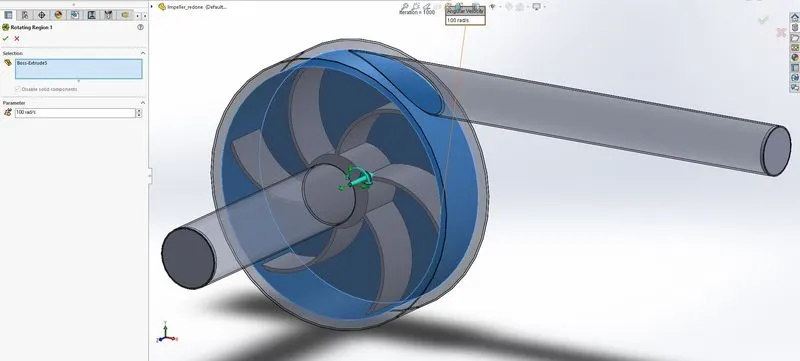
- Add a Rotating Region as follows (the internal casing deselected above becoes the rotating region):
- Add boundary conditions to the inlet and outlet lids:
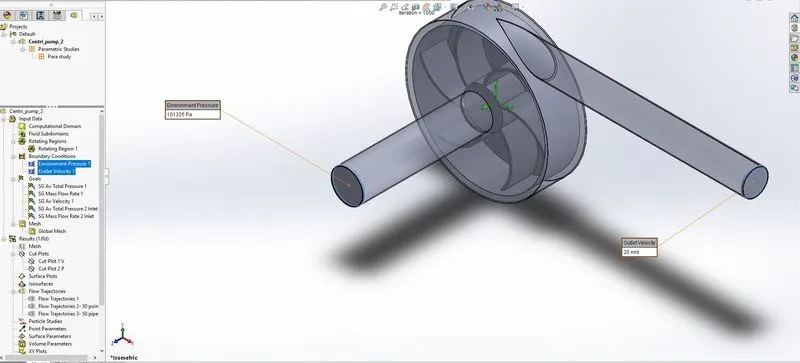
Inlet BC: 1 atm
Outlet BC: 20 m/s
Both set at Face @ Lid 1/2 - Add the following goals:
- Average Total pressure at Inlet and outlet
- Average mass flow rate at Inlet and outlet
- Average velocity at outlet
- Change the auto mesh density to 6.
- Run the simulation.
- Add cut plots for V and P on XY plane.
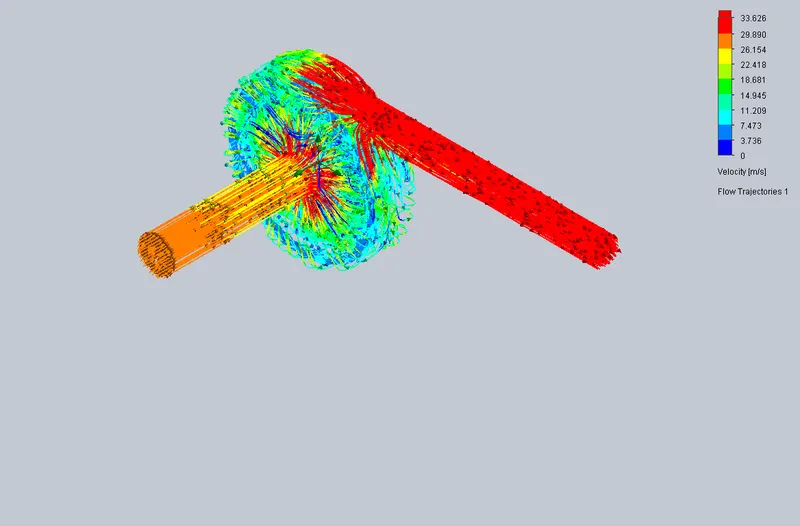
- Add flow trajectories for velocity and pressure from inlet to outlet lids for 200 points. Select "lines with arrows" option. Generate an Animation.
- Parametric Study:
- Create a Parametric study for 5 values of outlet velocities from 20 to 50 m/s.
- Select all cut plots, flow trajectories and goals as output parameters.
- Run the plot and obtain the results.
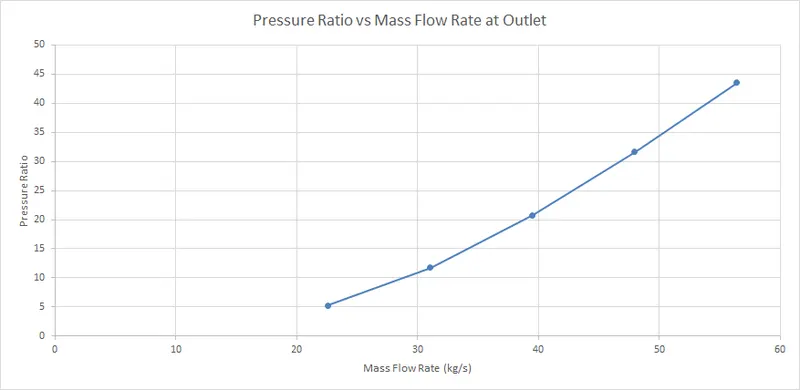
- Calculate Pressure ration as Outlet P/Inlet P, and plot it against Mass Flow rate at outlet.
Results:
- Design Point 20 m/s:
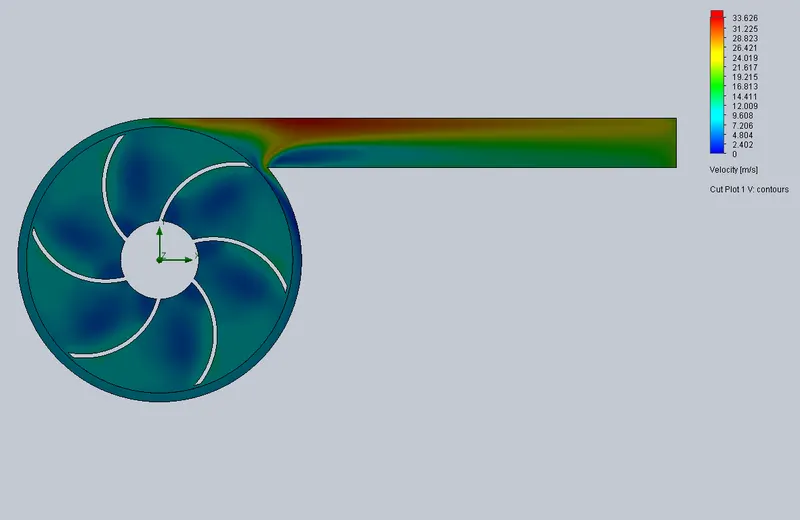
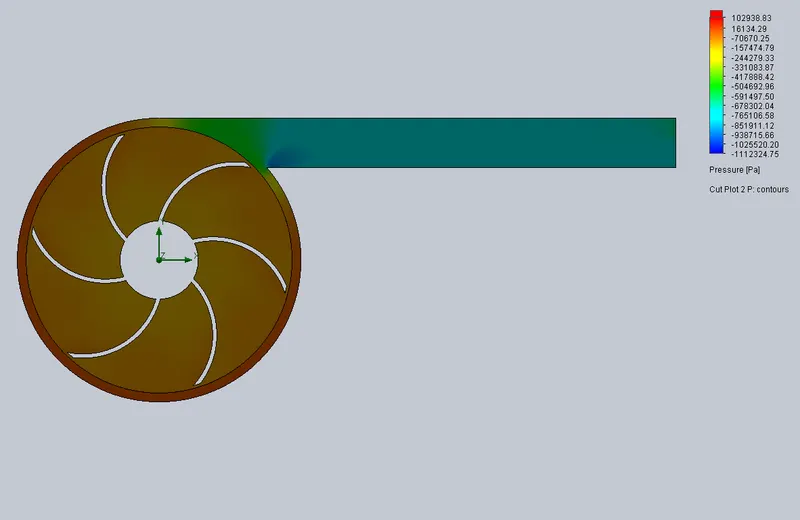
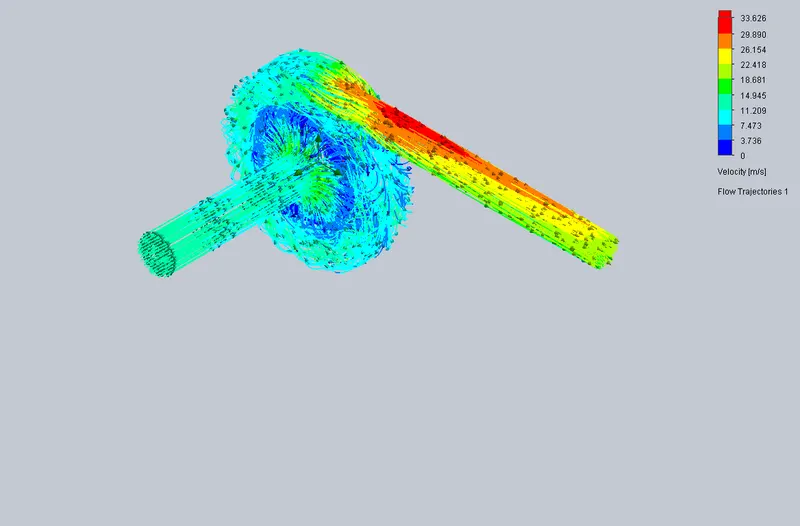
- Design Point 27.5 m/s:
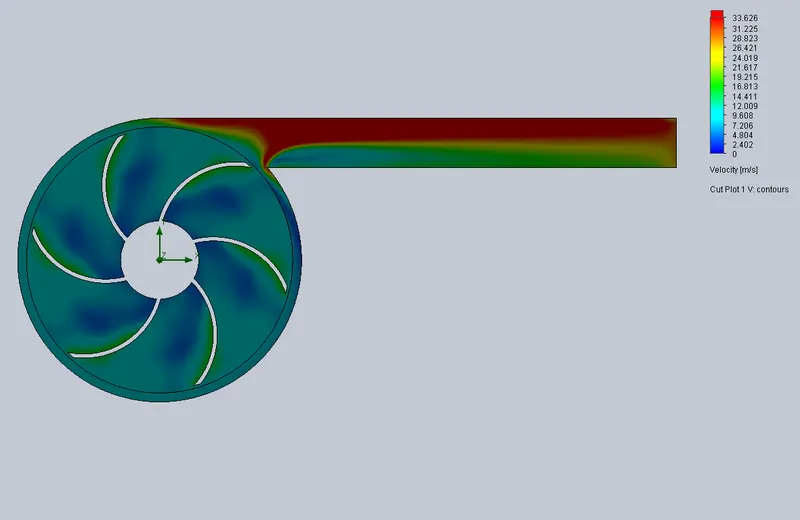
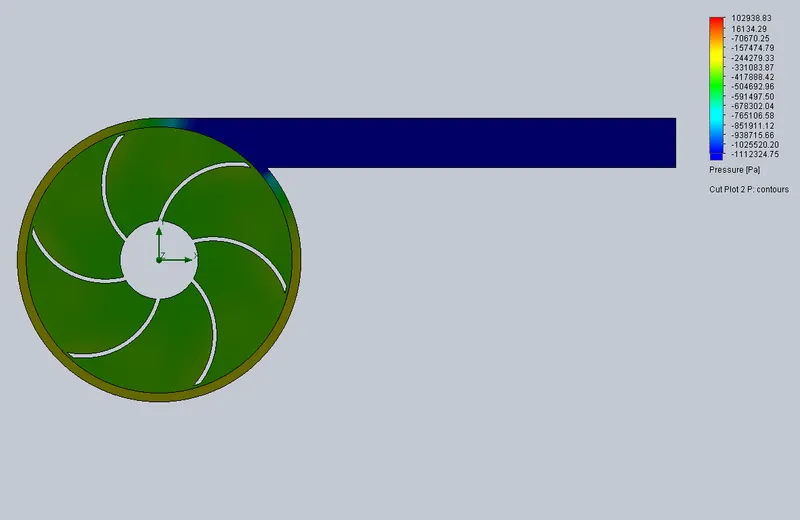
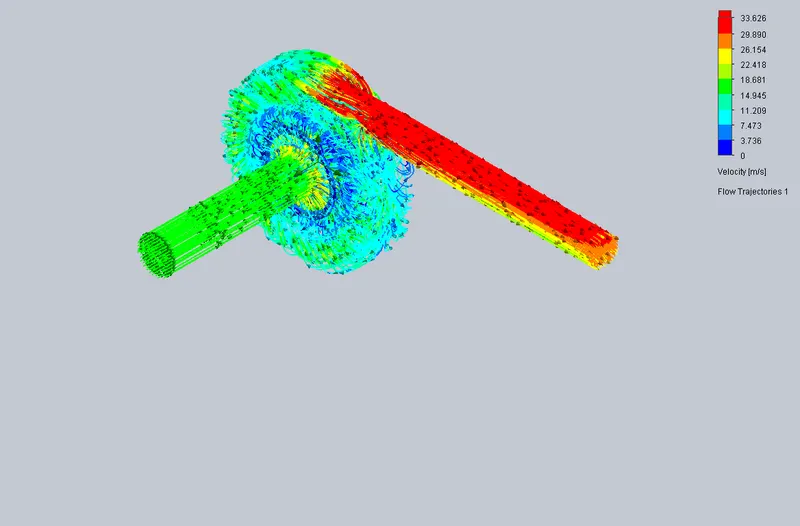
- Design Point 35 m/s:
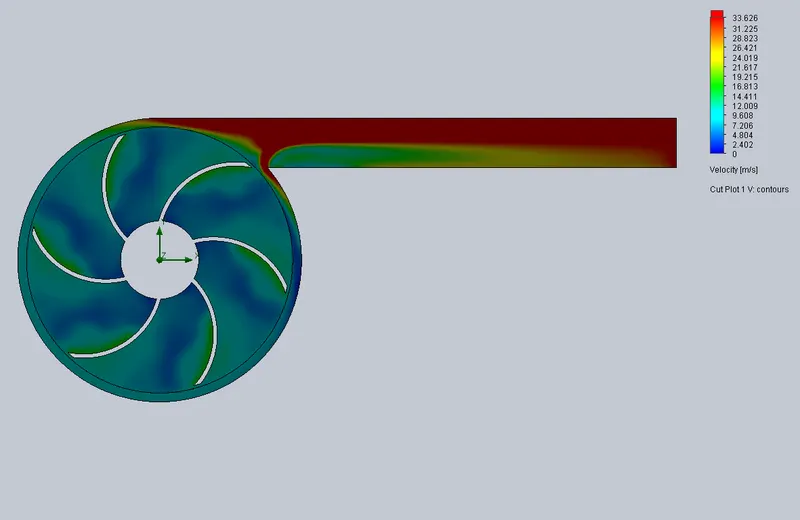
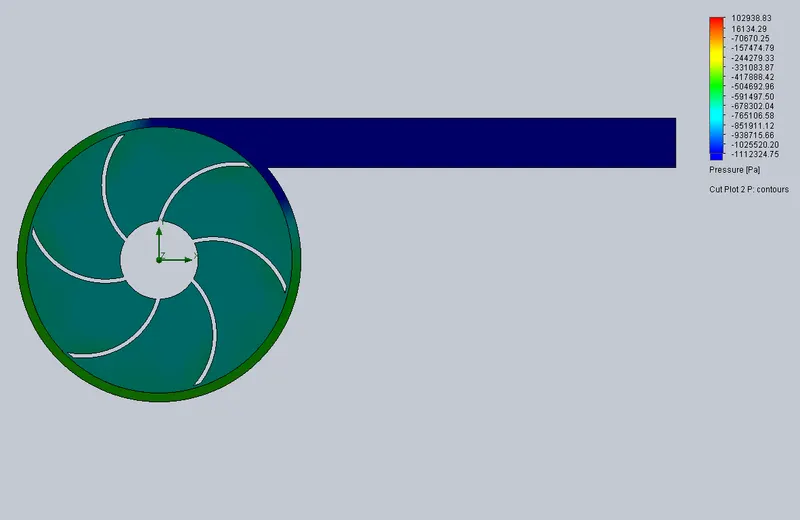
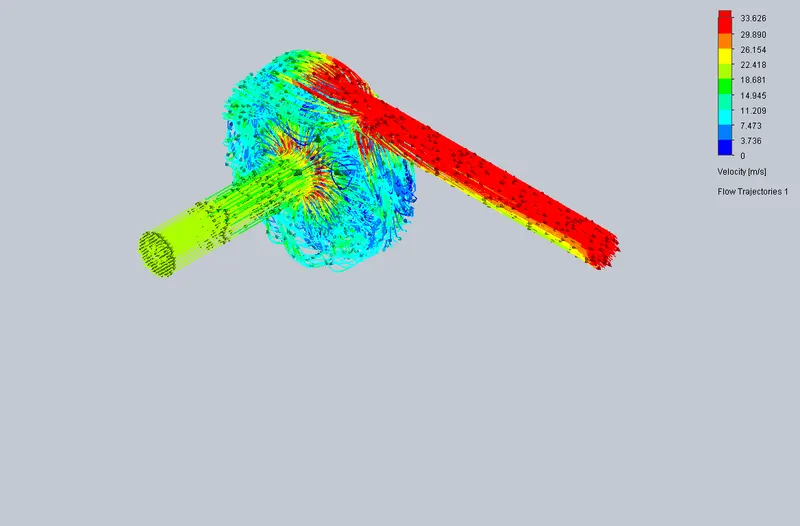
- Design Point 42.5 m/s:
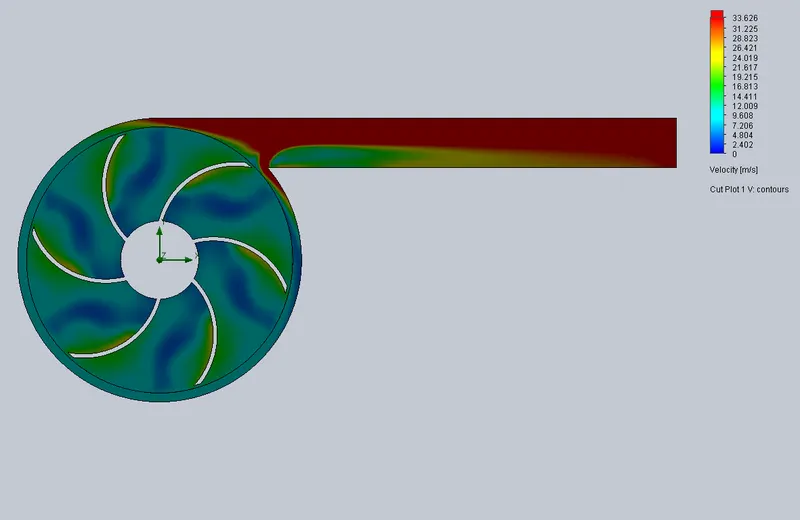
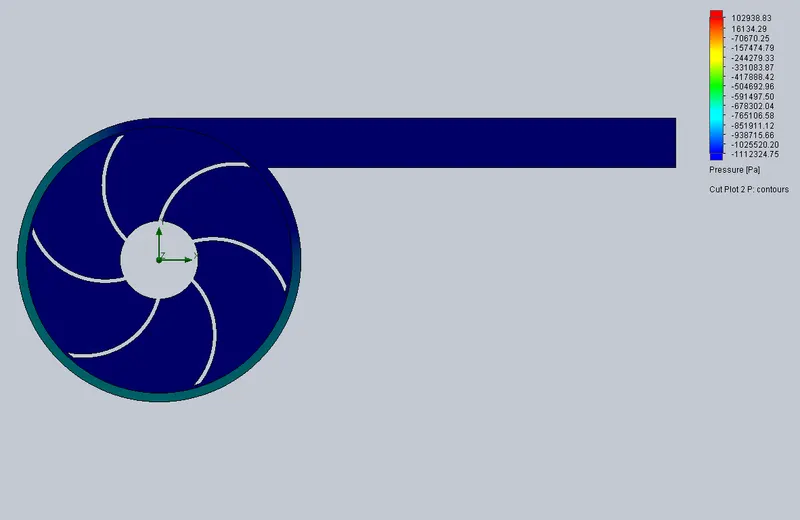
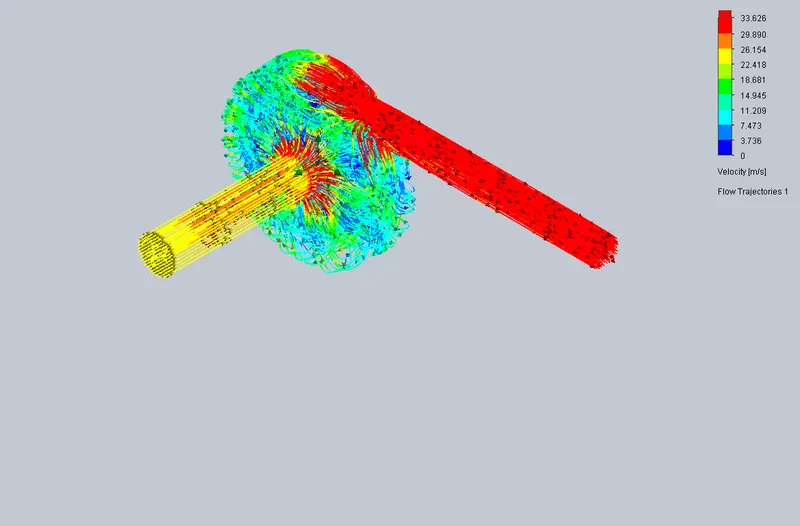
- Design Point 50 m/s:
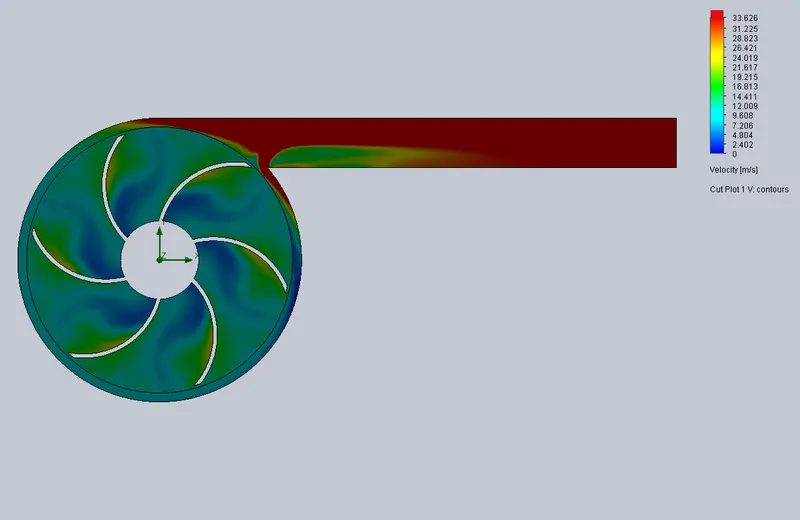
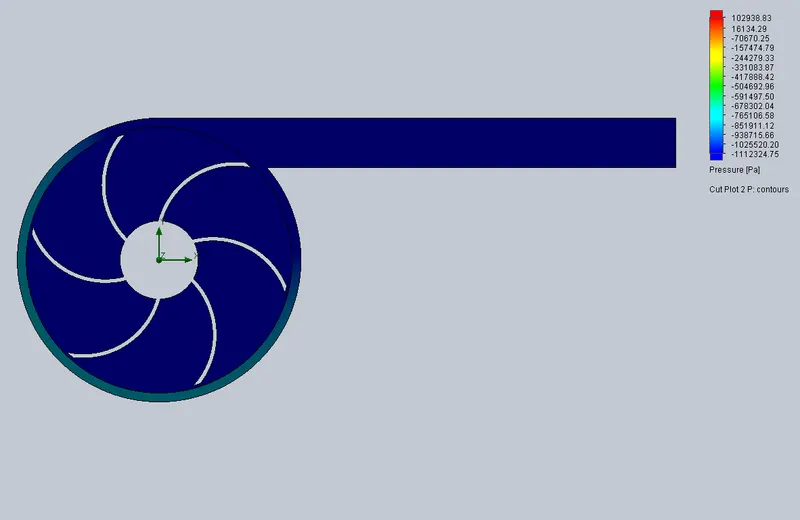
- Data and Graphs from Parametric Study:
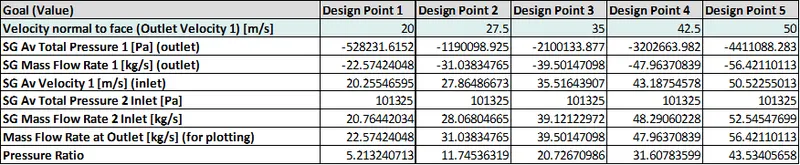
*The negative sign next to the outlet values indicates that flow is leaving the domain.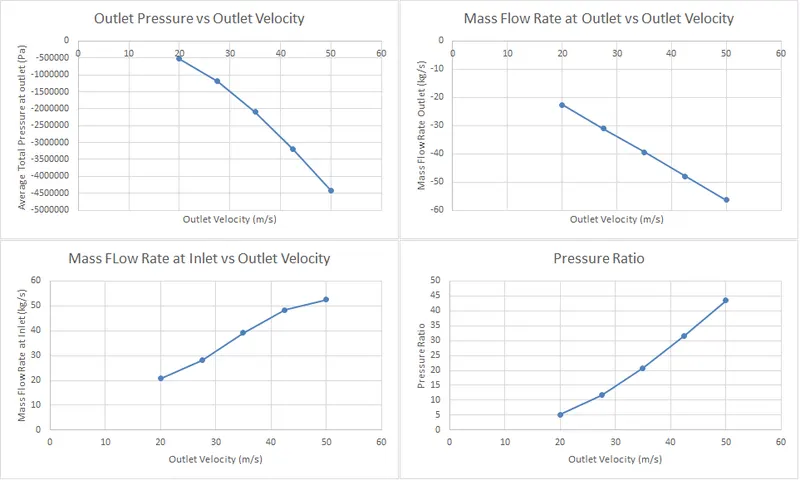
- Pressure Ratio vs Mass Flow Rate at outlet:
- Flow Trajectories Animation:
Flow Through a Centrifugal pump at 20 m/s
Conclusion:
Ideally, the pressure should decrease with an increase in velocity as P and V are inversely related. However, in this case the pressure is INCREASING with an increase in velocity. This is due to an increase in the impact pressure on the outlet lid due to an increase in velocity. The face of the lid registers higher pressures on the fluid (water) hitting it. This would hence explain the increase in pressure ratio with mass flow rate.
The negative sign indicates the flow leaving the system.
The initial model with a smaller inlet and outlet (both length and diameter) was causing backpressure. Increasing the length and diameter of the inlet and outlet pipes reduced backpressure and turbulence.