Modelling and Simulation of flow through flowbench in Solidworks
Aim: To model the fluid flow through a flowbench with a valve and analysing the results obtained.
Background:
A flowbench is a device used for testing internal aerodynamic qualities of an engine component. It is mainly used for testing intake and exhaust ports.
Here, we are using a generalised flow bench geometry to understand flow patterns through it. A valve is also added to show the flow trajectories around the valve.
The end result will be to understand the effect of mass flow rate on various valve lifts.
Proedure:
- Create any flow bench geometry in a 100x100x100 enclosure. Ensure there is a 90 bend pipe.
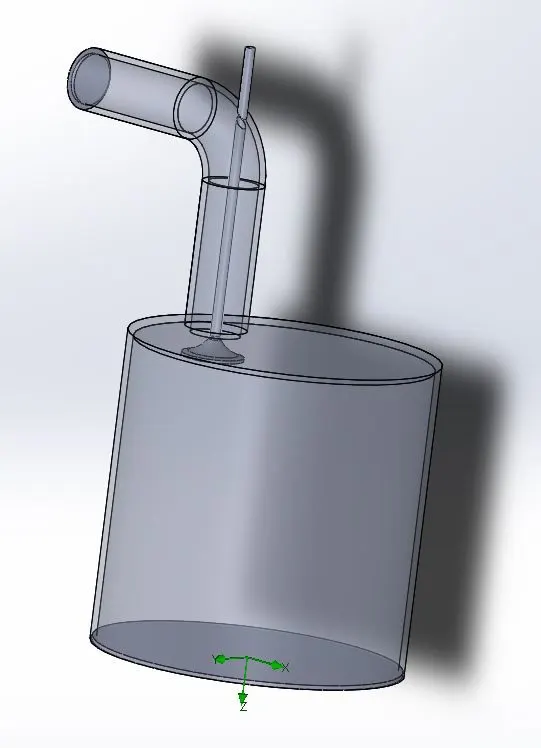
- Create a valve with the same OD as the ID of the pipe outlet into the tank.
- Proceed to the flow simulation wizard and set up an internal flow simulation, keeping all data constant.
- Add a total pressure inlet of 2 atm at the pipe inlet and static pressure outlet of 1 atm at the base of the tank.
- Choose a value for the global mesh. Here, the value chosen is 5.
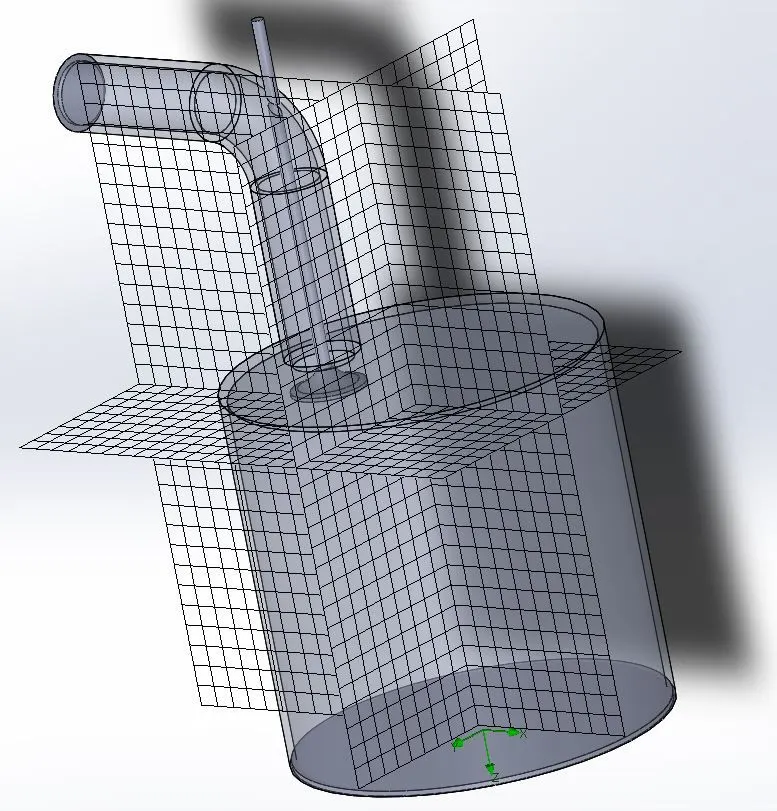
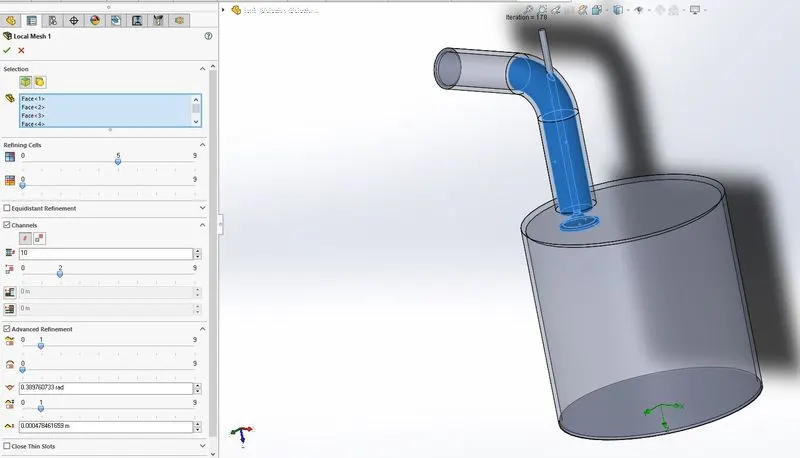
- Also create a local mesh in the pipe and valve region of more density for better results. Here, due to processor limitations, he value of local mesh is set to 5. Choosing 1 higher than the global mesh will yield good results.
- Add 3 goals:
- Mass flow rate (global goal)
- Mass flow rate at outlet of the tank (surface goal)
- Force on valve (surface goal)
- Run the base line simulation (Valve lift = random).
- Create a parametric study for mass flow rate vs valve lift.
- Starting with a valve lift of 0.001, take 10 values.
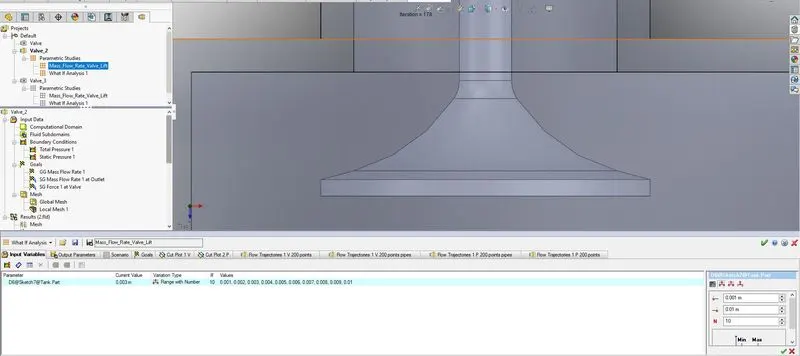
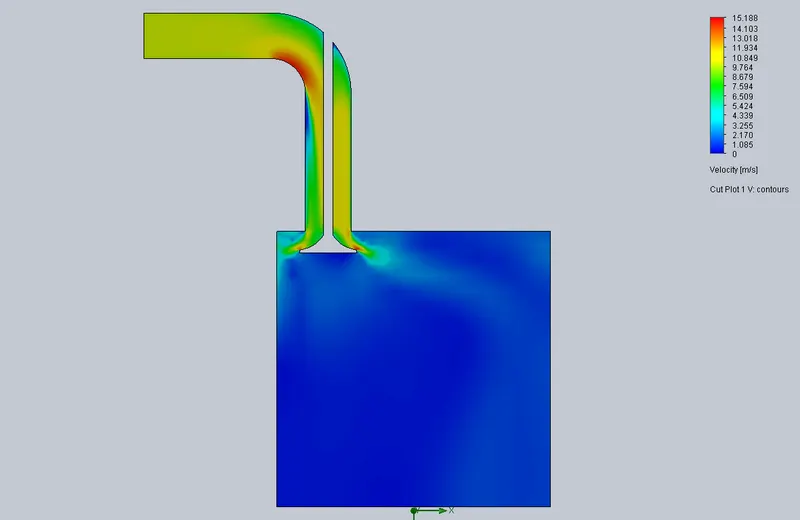
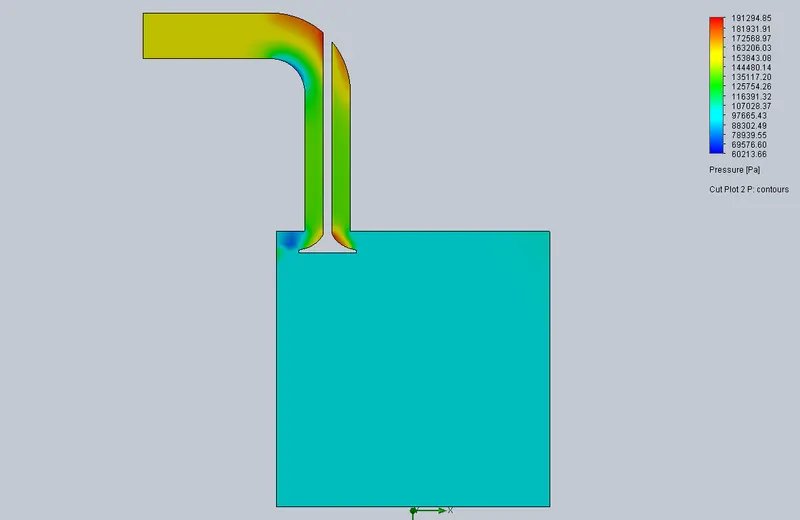
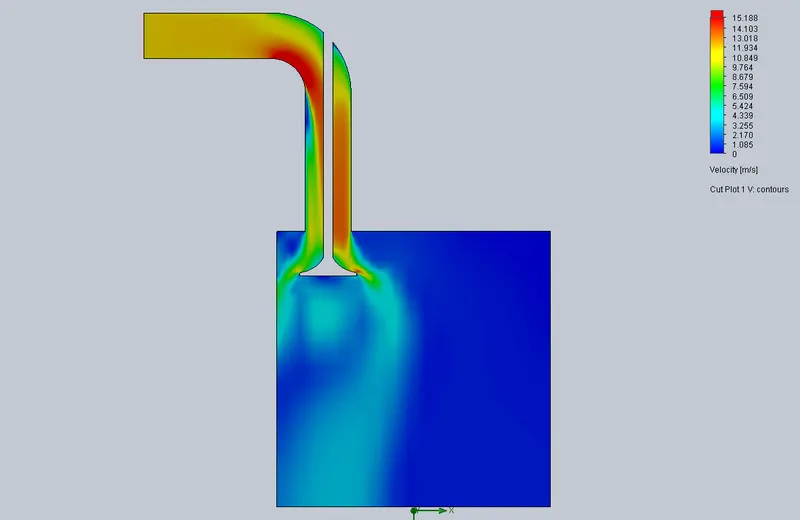
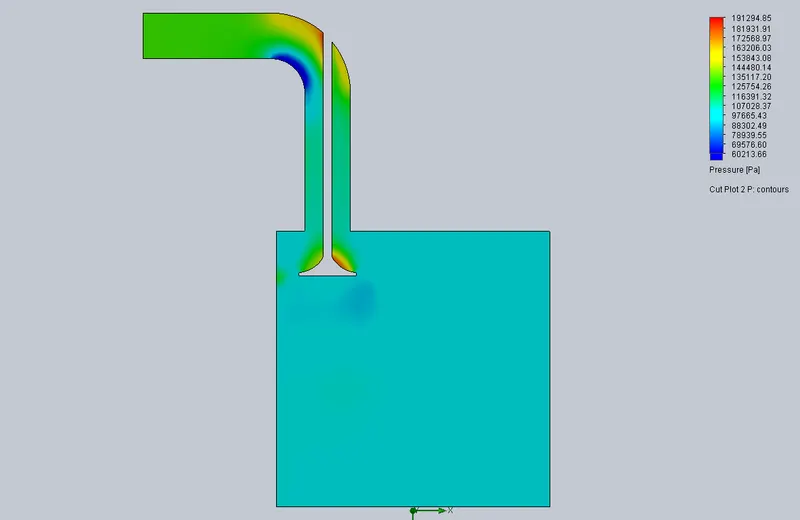
- Add all goals, velocity cut plot, pressure cut plot and flow trajectories of velocity and pressure.
- Ensure that the flow trajectories are selected for all faces and lids, and for 200 points.
- Run the parametric study for all 10 trials.
- Starting with a valve lift of 0.001, take 10 values.
Results:
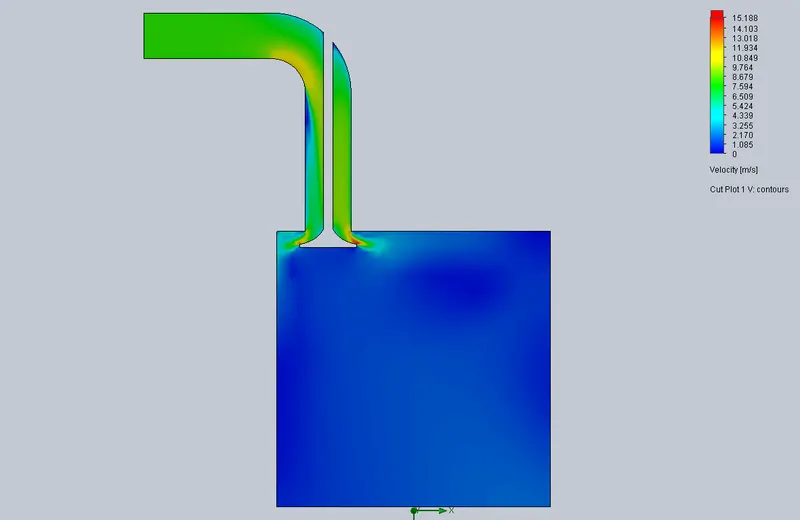
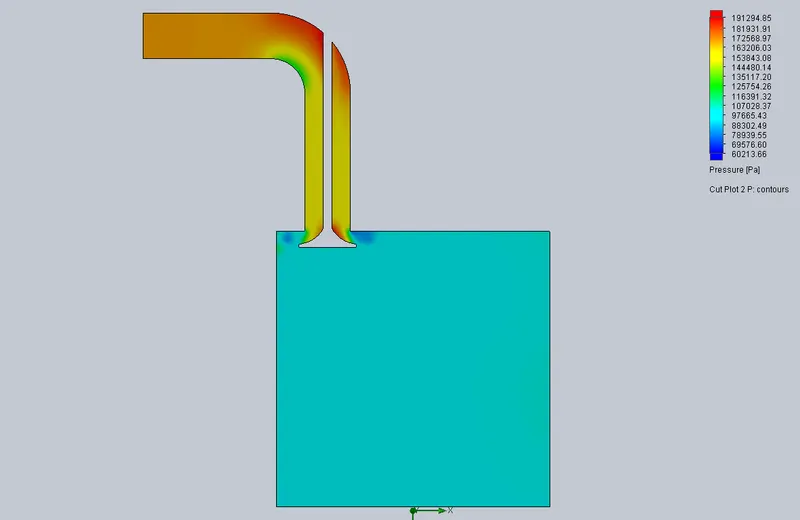
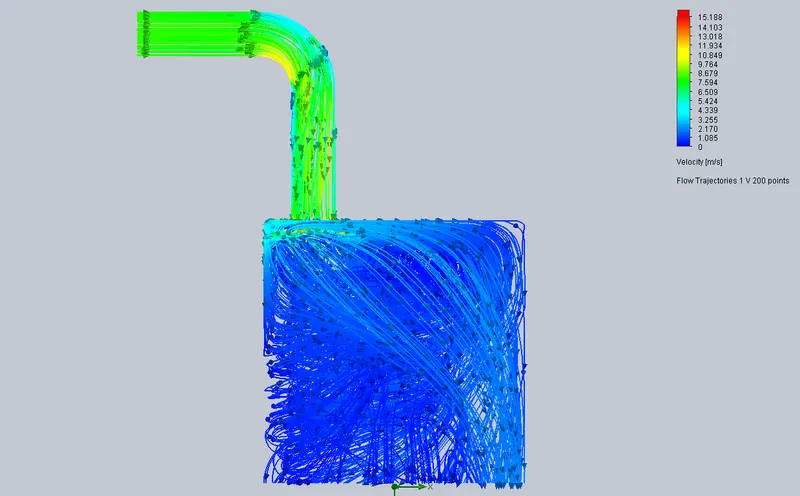
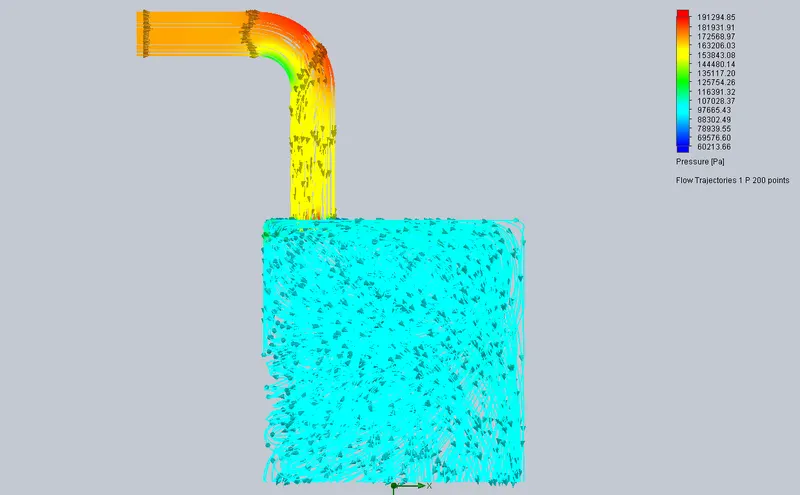
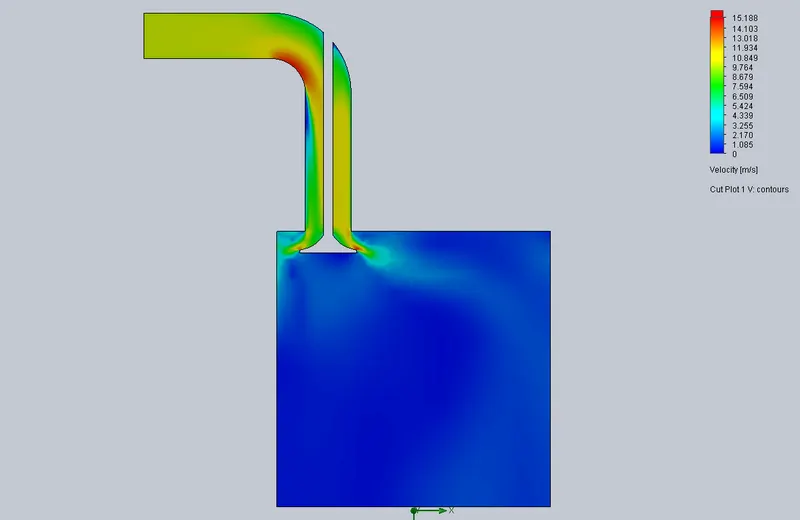
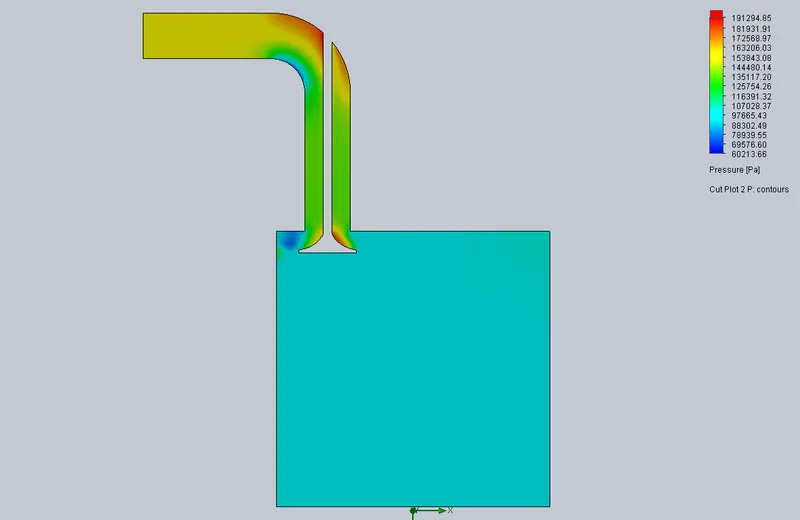
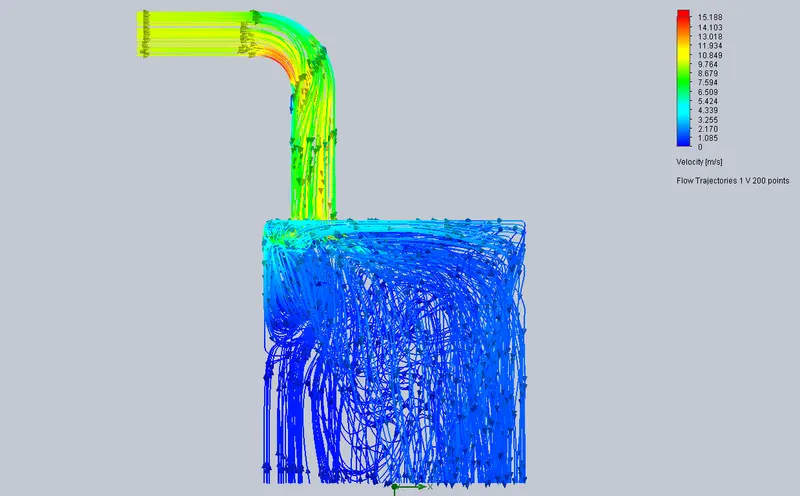
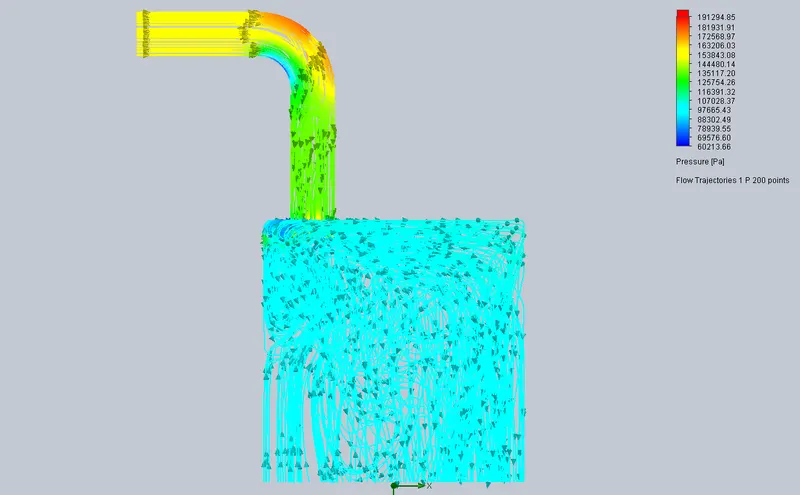
Baseline simulation:
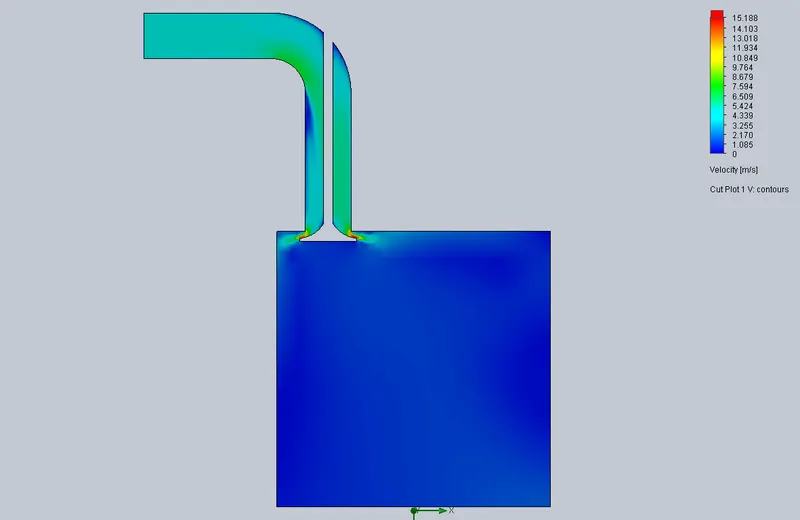
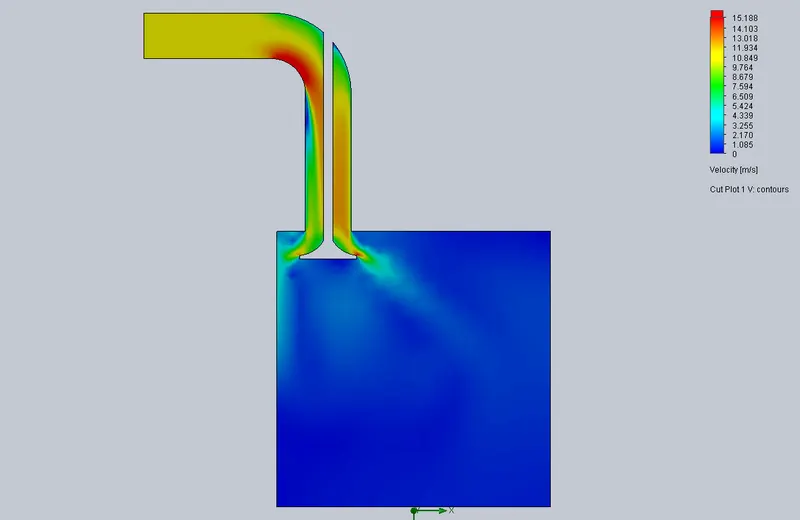
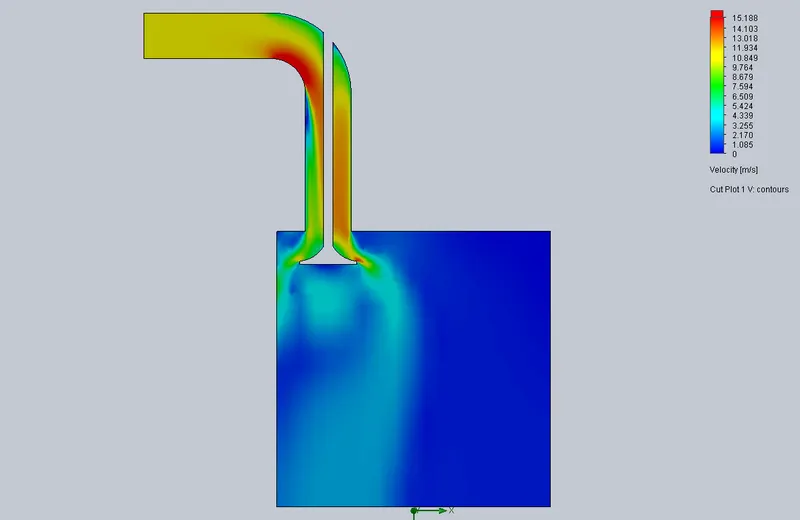
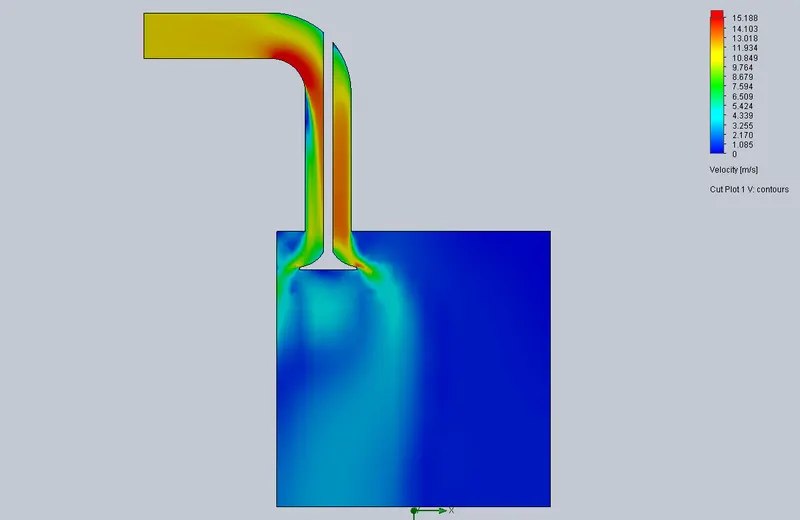
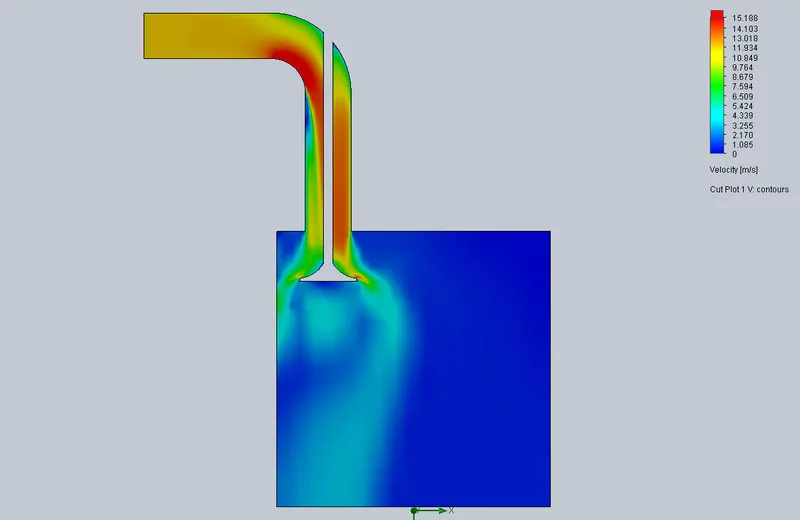
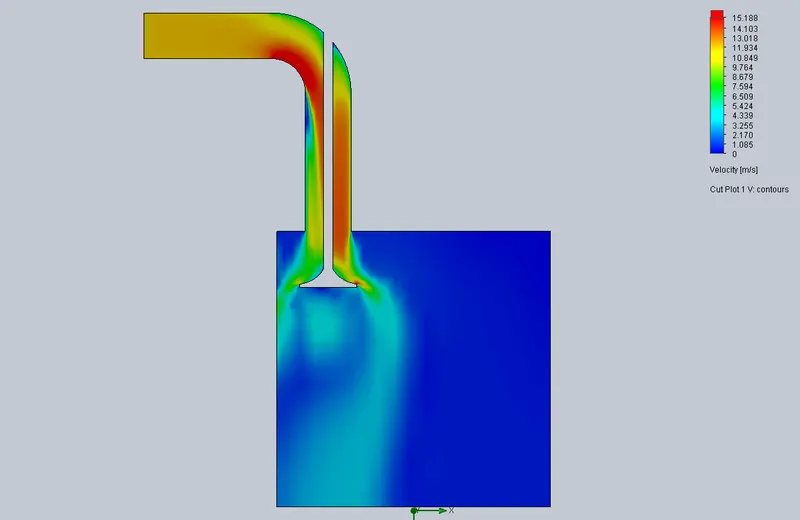
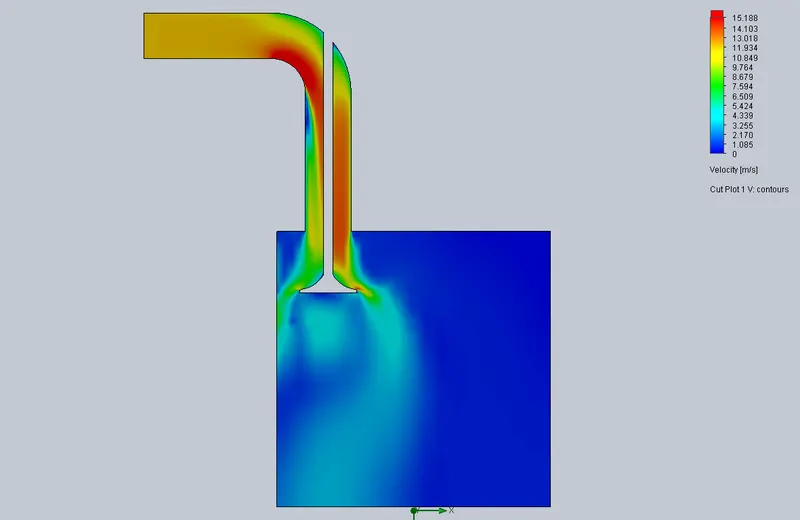
Velocity Cut plot:
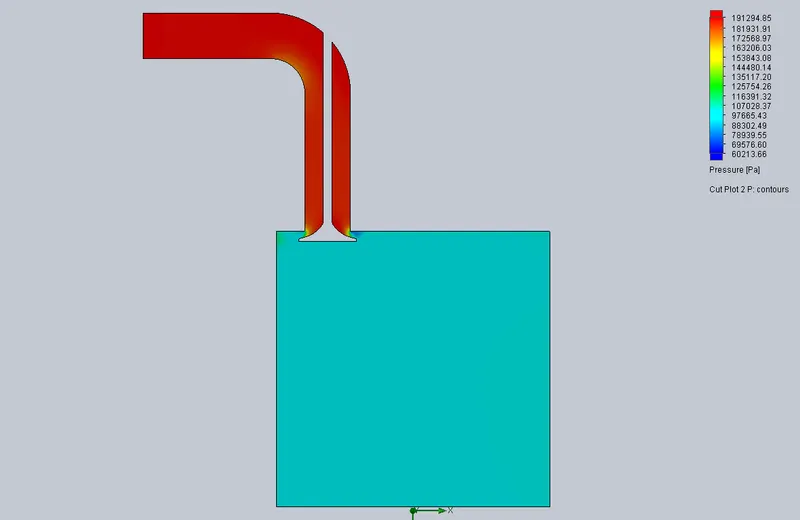
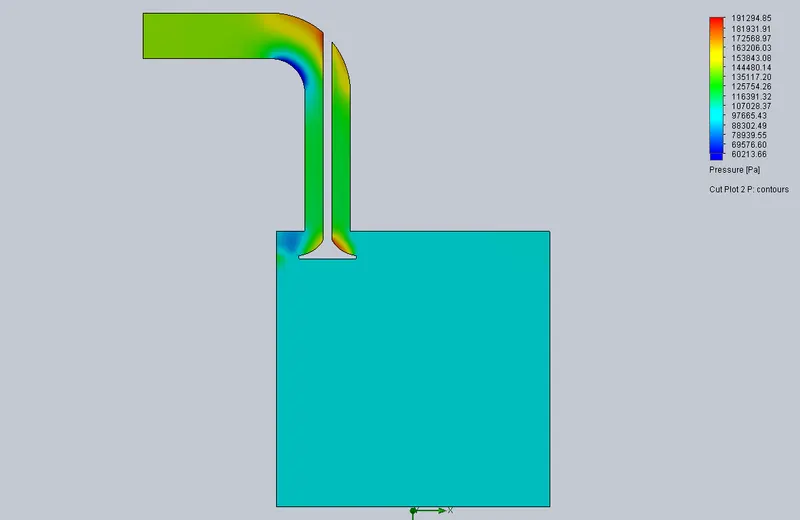
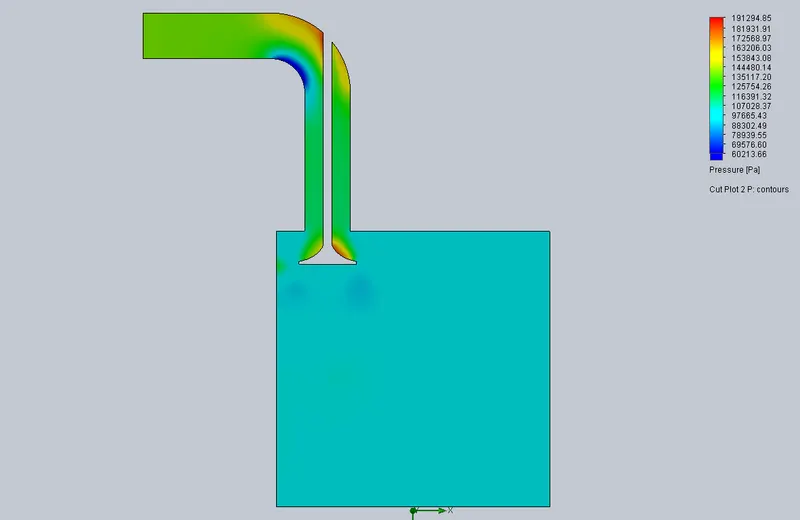
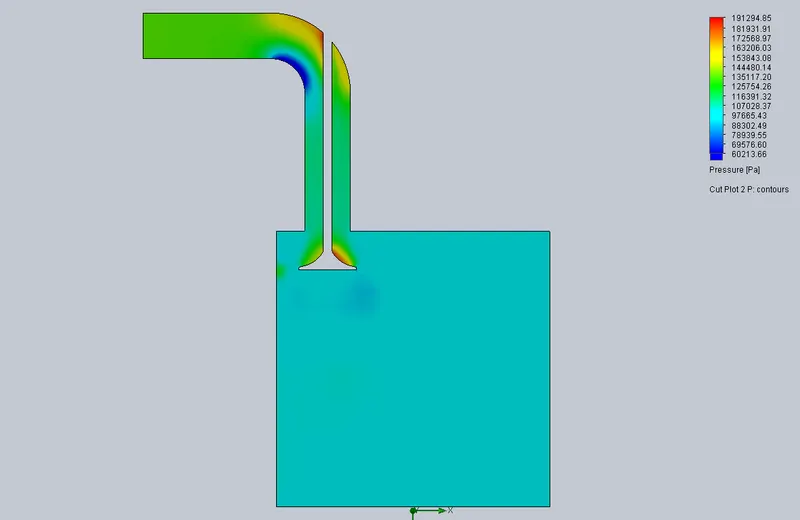
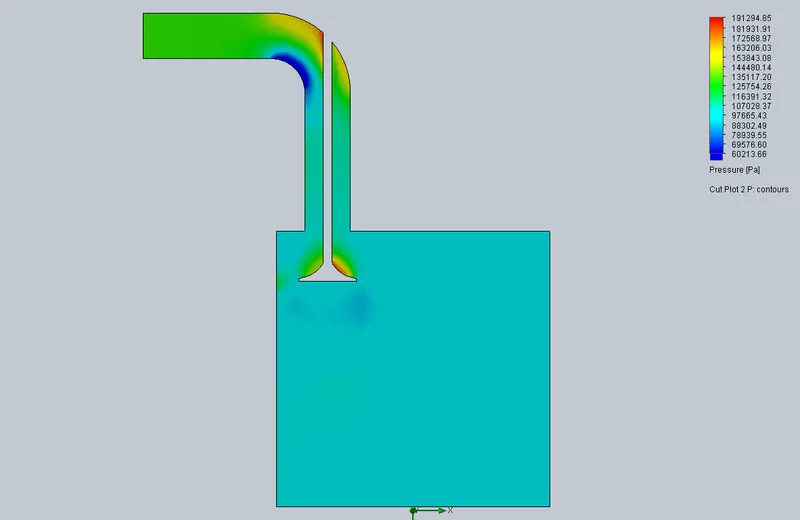
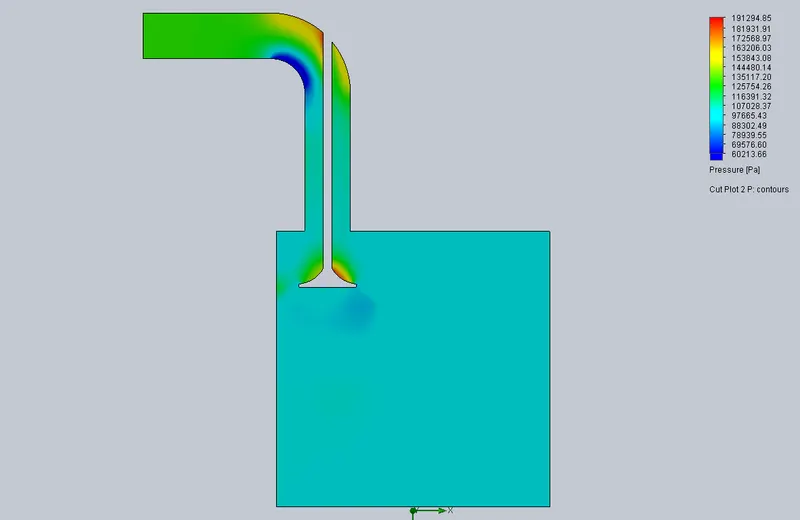
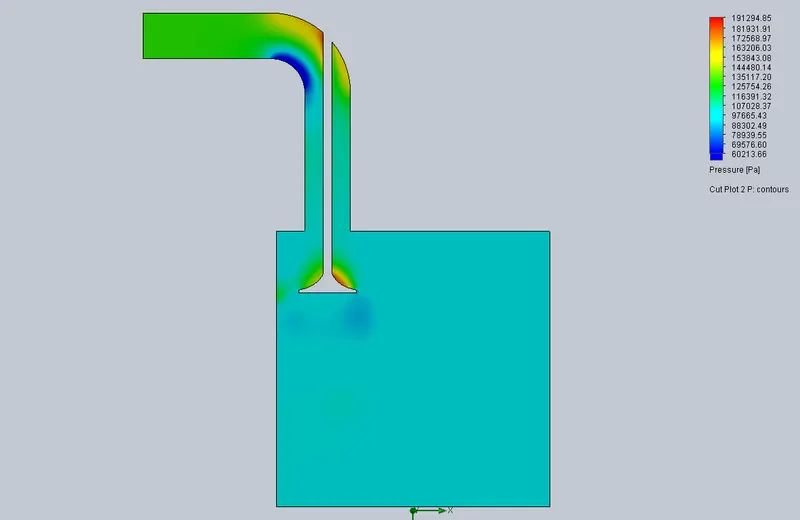
Pressure cut plot:
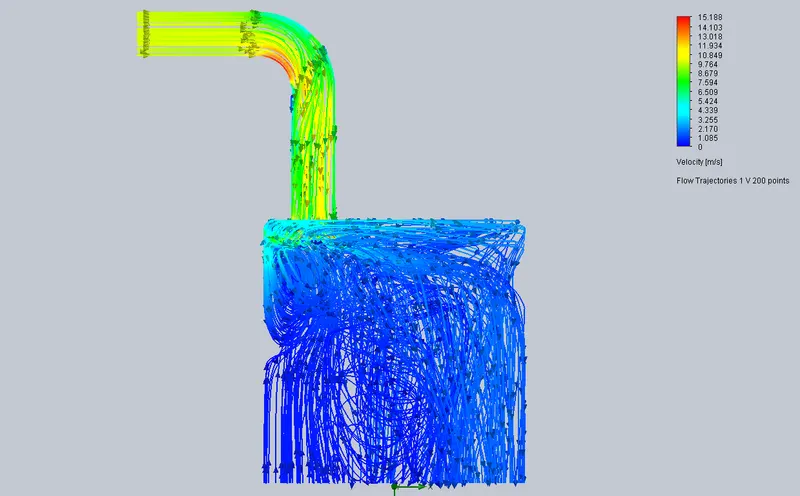
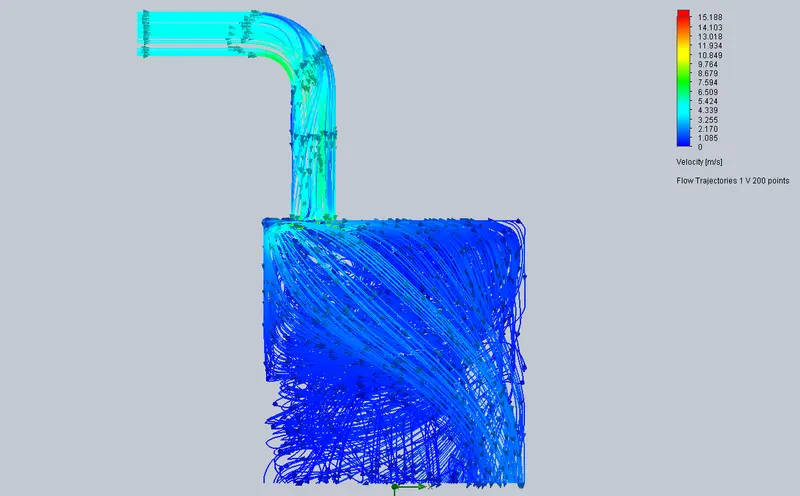
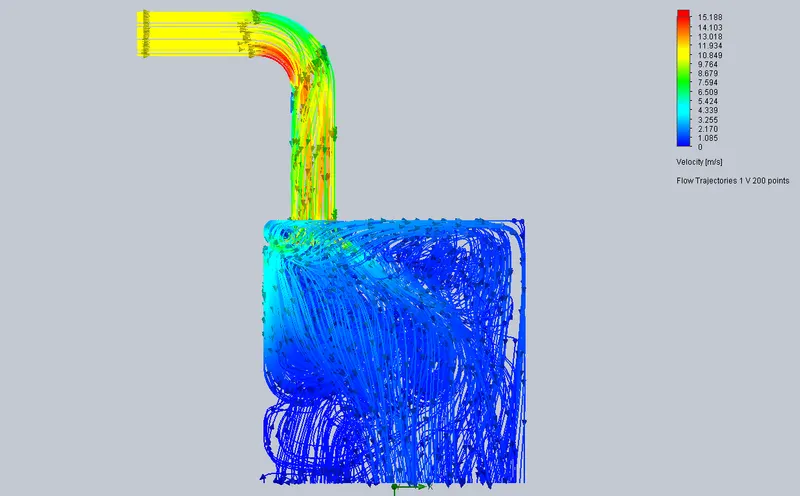
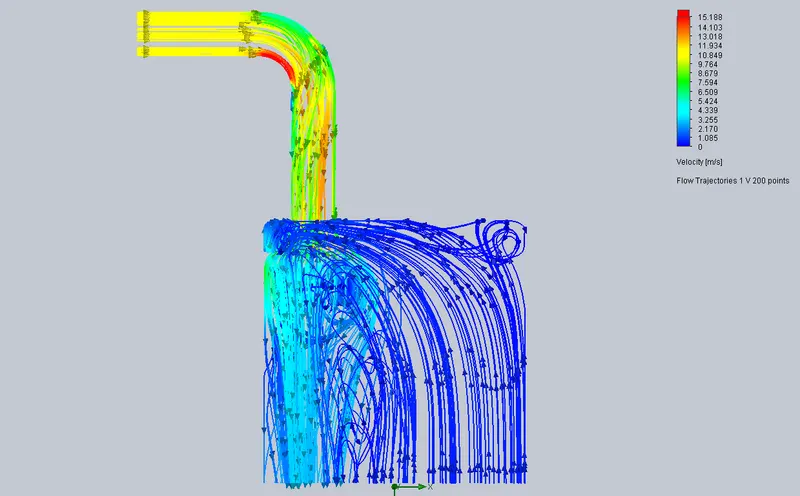
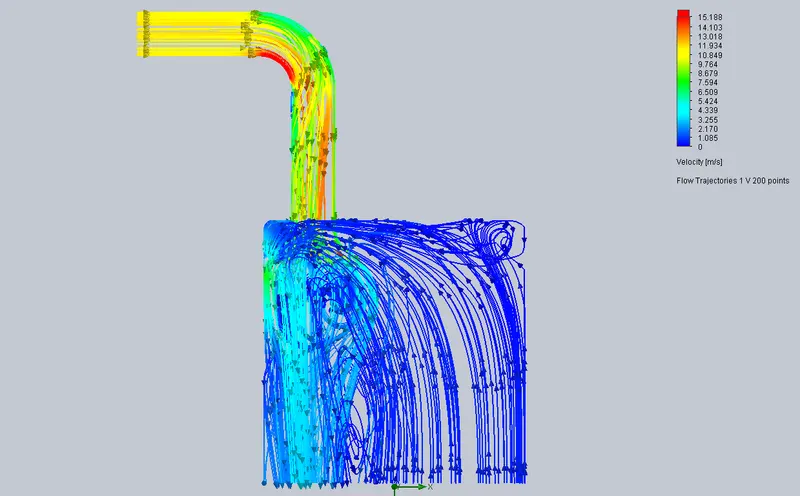
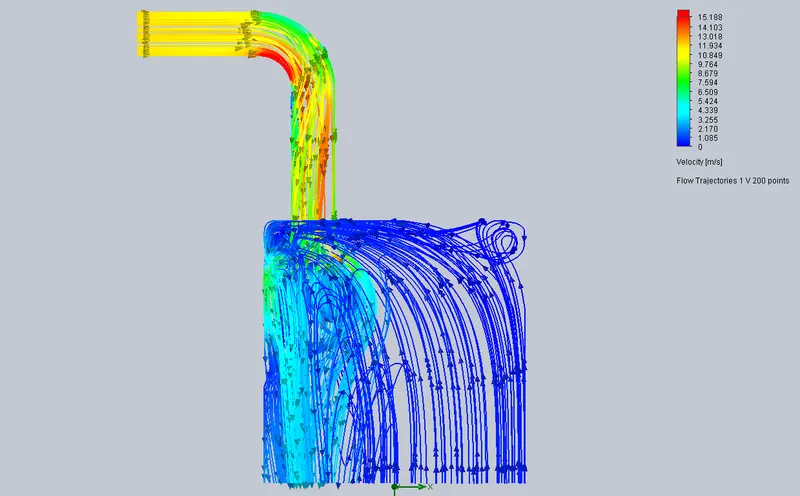
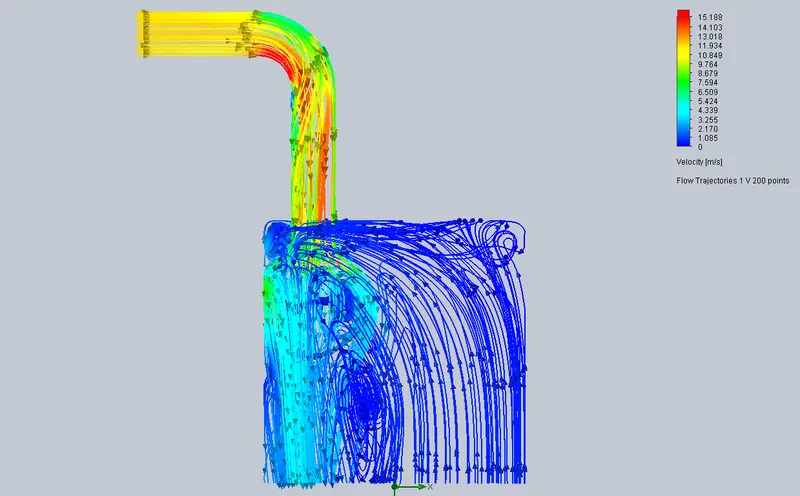
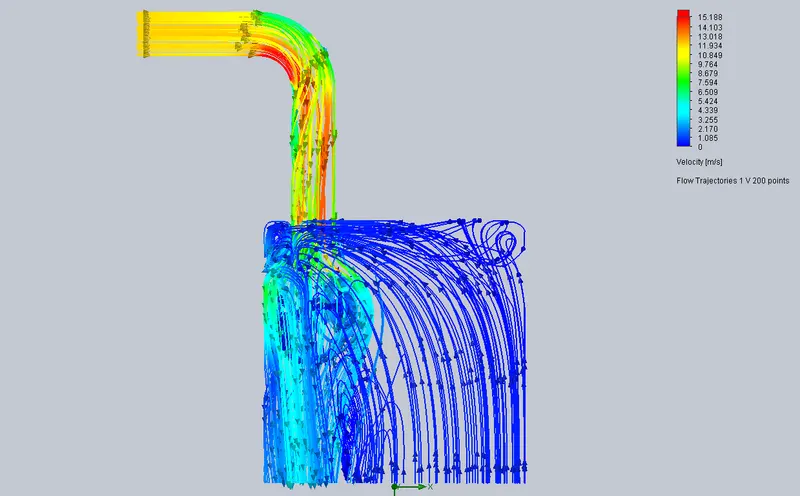
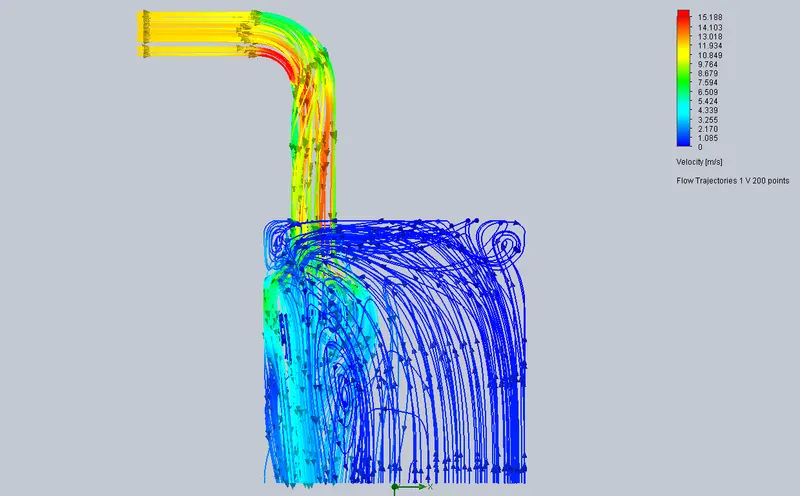
Flow trajectories (velocity):
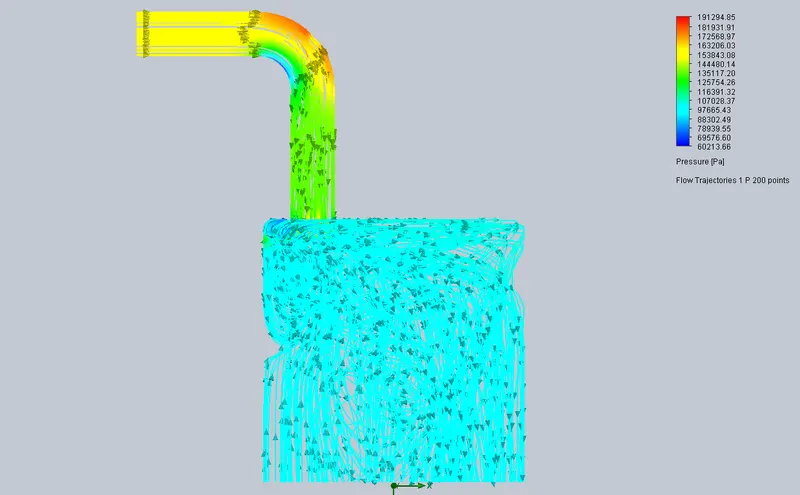
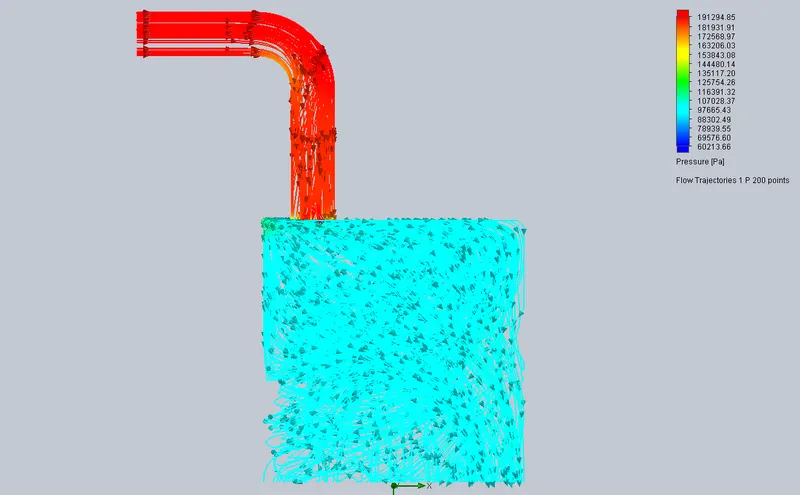
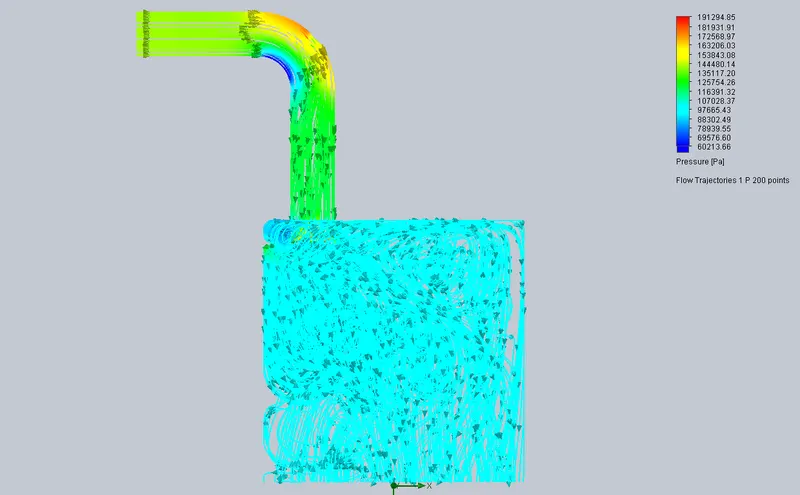
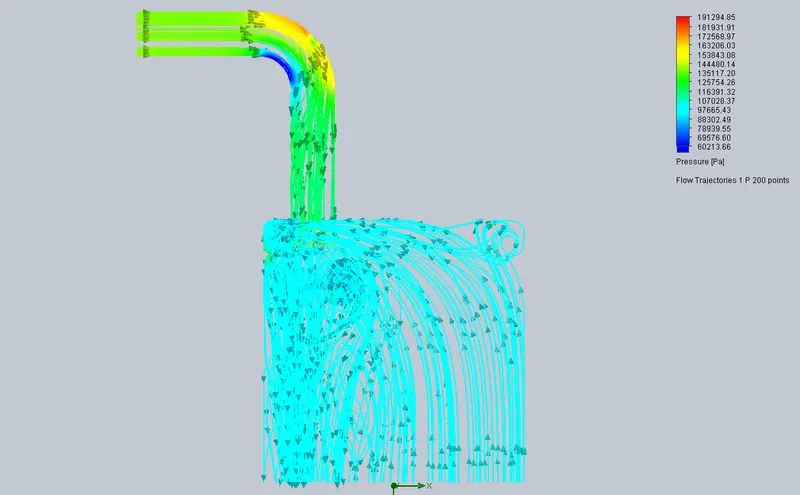
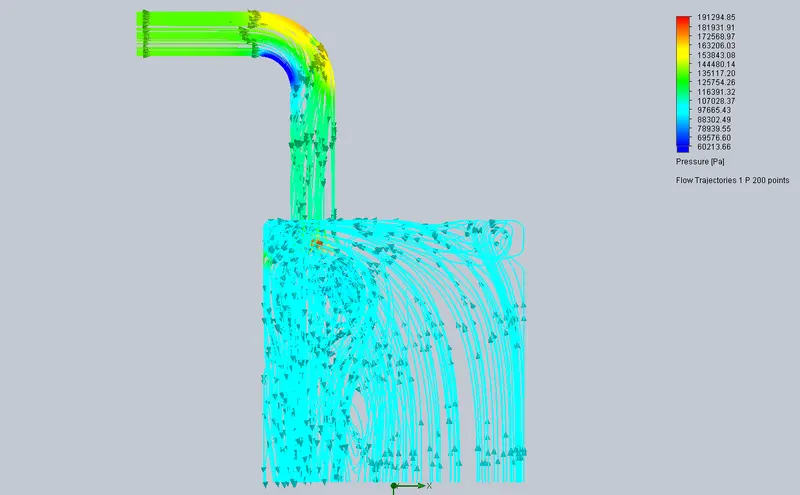
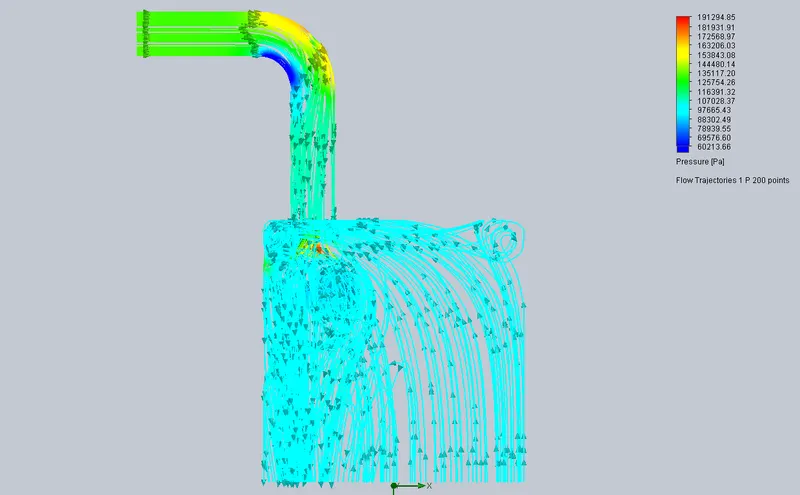
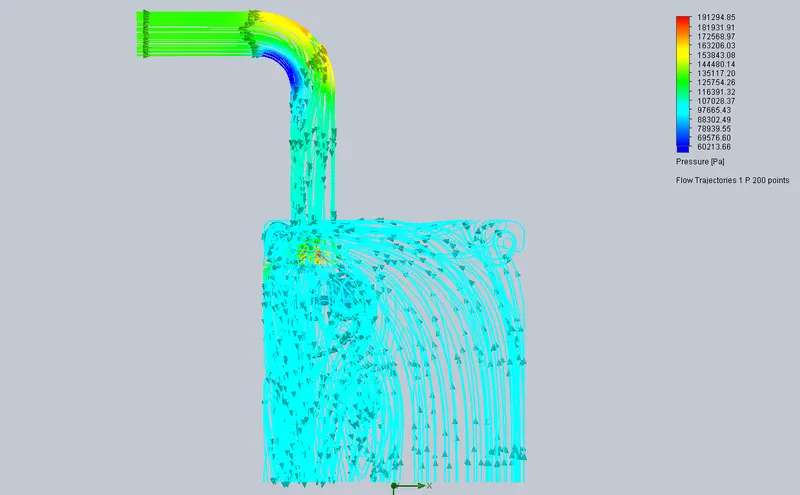
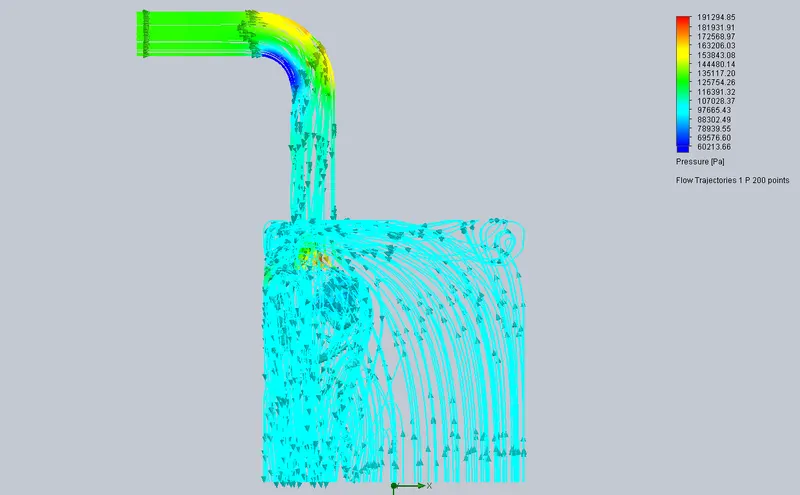
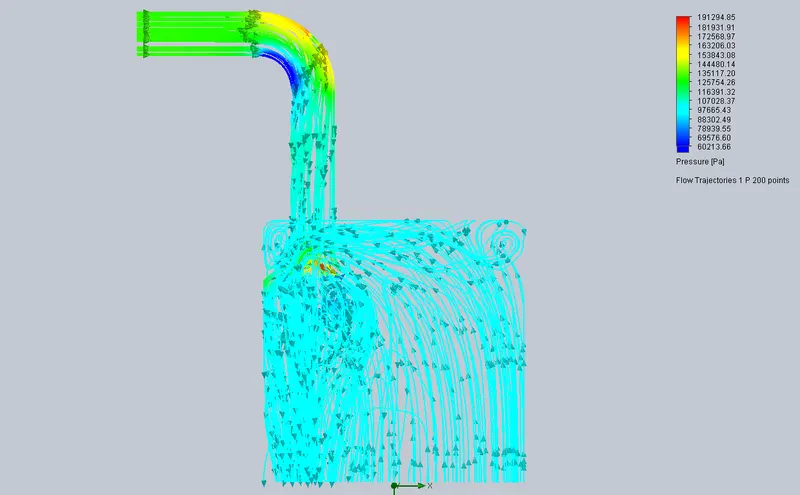
Flow trajectories (Pressure):
Parametric study summary:

Goal values:

- Valve Lift 0.001 mm:
- Valve lift 0.002 mm:
- Valve lift 0.003 mm:
- Valve lift 0.004 mm:
- Valve Lift 0.005 mm:
- Valve lift 0.006 mm:
- Valve Lift 0.007 mm:
- Valve lift 0.008 mm:
- Valve lift 0.009 mm:
- Valve lift 0.01 mm:
Conclusion:
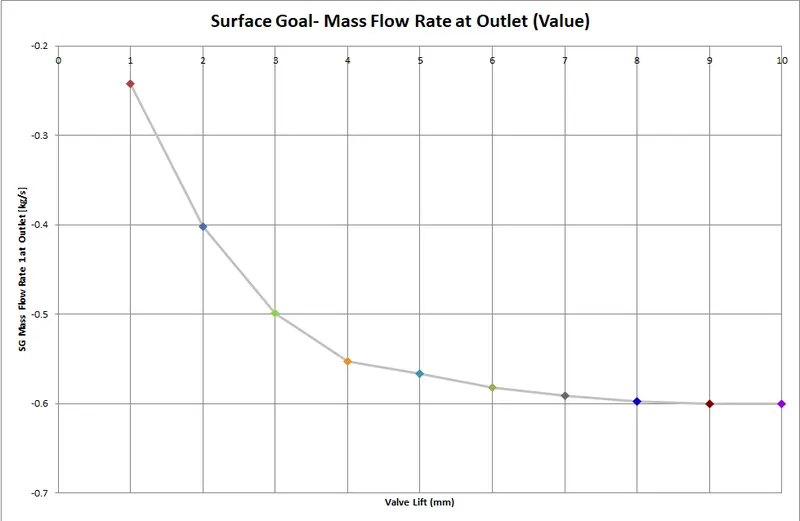
- As valve lift increases, mass flow rate increases. The reason for the negative sign and the dropping curve is due to fluid flow leaving the domain.
- We also notice from the flow trajectories that after valve lift 0.004 mm, the fluid bounces around less, owing to more free flow of fluid due to increasing opening.